Andy Victor Amanoul*![]() | Haval Tariq Sadeeq
| Haval Tariq Sadeeq![]()
© 2025 The authors. This article is published by IIETA and is licensed under the CC BY 4.0 license (http://creativecommons.org/licenses/by/4.0/).
OPEN ACCESS
Dental radiographs are essential for diagnosing tooth-related diseases, yet their interpretation is often time-consuming and varies among clinicians. Although deep learning has advanced dental image analysis, most existing studies remain limited to binary classification or specific imaging modalities. This study aims to develop and evaluate a deep learning framework capable of multi-class single-tooth disease classification from radiographic images. A dataset of 4,439 single-tooth images was prepared from annotated dental radiographs, representing four clinically relevant categories: caries, deep caries, impacted teeth, and periapical lesions. The network integrates efficient convolutional and attention-based feature extraction with anti-aliased down-sampling and multi-scale feature aggregation to enhance representation and calibration reliability. Training employed a two-phase augmentation strategy (heavy to light) and weighted cross-entropy loss under stratified five-fold cross-validation, with final predictions obtained through soft-voting ensemble averaging. The framework achieved an accuracy of 0.980 and an F1-score of 0.974, surpassing the performance reported in recent single-tooth classification studies, which typically achieve accuracies in the range of 0.92-0.95 and F1-scores of approximately 0.83-0.94. These findings indicate that deep learning can provide accurate, consistent, and interpretable multi-class diagnosis at the tooth level, potentially reducing the diagnostic workload of dental professionals and allowing greater focus on complex clinical cases.
convolutional neural network, dental caries, deep learning, medical image processing, ensemble learning, multi-scale feature aggregation, panoramic radiography
Oral disorders are among the most common health problems worldwide, affecting an estimated 3.5 billion people and contributing substantially to disease burden across all age groups [1]. Despite this burden, oral health often receives limited attention in health policy, and access to care remains a challenge, particularly in lower-income settings [2-4].
Radiographic imaging is central to dental diagnosis. Intraoral radiographs, cone-beam computed tomography (CBCT), and panoramic radiography (OPG) are the main modalities, with OPG being the most widely used because it is quick, accessible, and provides a full view of the dentition. However, OPG images are often affected by overlapping structures, low contrast, and distortion, making subtle abnormalities difficult to detect [5]. These strengths and limitations make OPG both essential in daily practice and a key focus for computer-based diagnostic support.
Artificial intelligence (AI) has rapidly advanced radiology, improving accuracy and efficiency while raising challenges of bias, transparency, and accountability [6, 7]. Dentistry has also adopted AI, with promising results in implant planning and anatomical analysis [8]. However, applications targeting dental abnormalities and diseases—including caries, periapical lesions, and other tooth disorders—remain limited. Most studies emphasize prosthetics and implants, leaving a critical gap in single-tooth disease classification that this study addresses.
Recent reviews indicate that AI is being progressively utilized in dentistry, yielding positive outcomes for caries detection and management. Outcomes, however, differ among studies, and the absence of standardization and dependable validation constrains clinical application [9, 10]. These gaps show that dental imaging needs to be more consistent and focused on diseases.
While AI has advanced in dental imaging, little work has addressed single-tooth disease classification, especially when multiple conditions must be distinguished. This study therefore, aims to develop a deep learning model for classifying dental disorders at the individual tooth level and to address the challenges of multi-class classification to improve diagnostic reliability.
Recent studies have demonstrated the potential of deep learning for single-tooth classification of dental diseases, although most are restricted by imaging modality or the number of disease categories.
Chen et al. [11] applied convolutional neural networks to single-tooth periapical radiographs, classifying each tooth into normal, caries, periodontitis, or both. Their work showed that deep learning could handle multi-label classification at the single-tooth level, achieving high accuracy across multiple conditions.
ForouzeshFar et al. [12] focused on bitewing radiographs, cropping them into 6,032 single-tooth images. They compared multiple Convolutional Neural Networks (CNNs) for binary classification (sound vs. decayed), with VGG19 achieving 93.9% accuracy.
Liu et al. [13] developed a pipeline for periapical radiographs where teeth were first segmented and then classified with InceptionV3 as caries or non-caries. This approach confirmed the effectiveness of single-tooth binary classification in periapical images.
Li et al. [14] proposed a deep learning system for detecting both caries and periapical periodontitis from single-tooth regions cropped from periapical radiographs. Their dataset of over 4,000 periapical radiographs provided one of the first large-scale demonstrations of multi-disease classification at the tooth level.
A comparison of these related studies with the present work is summarized in Table 1, highlighting the imaging modalities, tasks, and dataset sizes used across different single-tooth classification approaches.
Table 1. Comparison of related studies on single-tooth disease classification using deep learning
|
Ref. |
Imaging Modality |
Input |
Task |
Classes |
Dataset Size |
|
[11] |
Periapical |
Single-tooth |
Classification |
Normal, Caries, Periodontitis, Both |
2850 images + augmented images = 8150 |
|
[12] |
Bitewing |
Single-tooth |
Classification |
Sound vs Decayed |
713 bitewings → 6,032 single-tooth crops |
|
[13] |
Periapical |
Single-tooth |
Classification |
Caries vs non-caries |
2136 images |
|
[14] |
Periapical |
Single-tooth |
Classification |
Caries, Periapical periodontitis, Both, Normal |
4,129 periapical radiographs (7,924 tooth regions) |
3.1 Dataset
The images were sourced from the Dentex Dental Radiography Challenge and obtained via Roboflow, which provided COCO-format annotations (JSON) including polygonal segmentation masks and bounding boxes. During export, Roboflow applied a minor augmentation (horizontal flips) to slightly increase the sample count. The exported set comprised 873 panoramic orthopantomogram (OPG) radiographs.
From these OPGs, we extracted single-tooth crops using the provided masks within our preprocessing pipeline (Section 3.2). This yielded a final dataset of 4439 single-tooth images with the following class distribution: Caries (n = 2822), Deep Caries (n = 689), Impacted (n = 748), and Periapical Lesion (n = 180), reflecting a pronounced class imbalance (see Figure 1). Because Dentex is a public research dataset, no additional ethical approval was required.
Figure 1. Sample count per disease class in the dataset
3.2 Preprocess and augmentations
Each panoramic OPG can contain multiple annotations, each corresponding to a single tooth. Using the COCO segmentation polygon and its bounding box, we decoded a binary mask and extracted the tooth region. A fixed 320 × 320 square was centered on the bounding-box center (clamped at borders), and the aligned mask was obtained within this crop. Enhancement was applied only inside the mask to avoid altering the non-tooth context.
Inside the mask we apply CLAHE to amplify local dental contrast, a mild gamma tweak to stabilize mid-tones, and small brightness/contrast adjustments (±0.05) to accommodate exposure variation [15, 16]. To avoid hard edges, the mask is Gaussian-blurred and used as an alha matte to feather-blend the enhanced tooth onto a uniform gray background. The result is saved at 320 × 320. Figure 2 summarizes the steps.
Figure 2. Step-by-step illustration of the tooth preprocessing workflow
Train-time augmentation. We apply augmentations only to the 320 × 320 single-tooth images produced by preprocessing. validation/test use normalization only. The following were applied:
1. HEAVY (early training)
•Horizontal flip
•Affine transforms
•Photometric jitter (brightness/contrast, gamma)
•Occasional light blur or sensor-style noise
•Gentle unsharp masking
•Normalization
•Horizontal flip
•Affine transforms
•Photometric jitter (brightness/contrast, gamma)
•Occasional light blur or sensor-style noise
•Gentle unsharp masking
•Normalization
2. LIGHT (mid → late training)
•Horizontal flip
•Very mild photometric jitter (gamma)
•Normalization
3. CLEAN (validation/test)
•Normalization
Correctly chosen augmentations increase data variety, reduce overfitting, and improve robustness to small changes in position/orientation, exposure/illumination, and mild blur/noise—while keeping tooth details intact. Misaligned augmentations can hurt performance, so we keep them conservative.
3.3 Model architecture
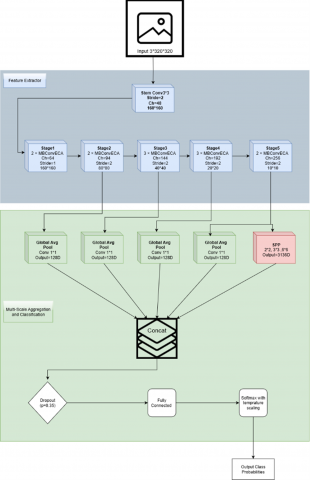
Our proposed method is a convolutional neural network designed specifically for single-tooth radiographs. The overall architecture is illustrated in Figure 3, which shows the convolutional stem, MBConv-ECA backbone with anti-aliased down-sampling, the multi-scale aggregation head, and the calibration layers. This design combines efficient convolutional blocks, lightweight attention, anti-aliasing, multi-scale aggregation, and probability calibration to achieve both high accuracy and reliable predictions.
Figure 3. Structural diagram of the proposed model
The proposed network is organized as a unified pipeline for multi-class single-tooth classification. The MBConv backbone extracts compact representations, ECA emphasizes diagnostically informative channel responses, and anti-aliased filtering is applied at stride-2 transitions to reduce aliasing and preserve fine lesion-related structures. The classifier then aggregates features from multiple backbone stages and applies pyramid pooling on the deepest stage to combine local cues with broader contextual information. Finally, confidence calibration is incorporated through LogitNorm and post-hoc temperature scaling to improve the reliability of predicted probabilities under multi-class and imbalanced conditions.
3.3.1 Stem
The network begins with a convolutional stem (3 × 3, stride 2) followed by normalization and activation. Convolutions with normalization layers are the foundation of medical image CNNs, including dental radiographs [17]. We adopt Group Normalization (GN), which provides stable training under the small-batch settings typical of medical imaging [18, 19]. For activation, we employ the SiLU (Swish) function, a smooth non-linear activation that supports effective gradient flow and convergence stability [20]. Recent studies further confirm that SiLU and its variants improve diagnostic performance in classification tasks [21].
3.3.2 Backbone blocks
The core of the network is built from MBConv blocks, an inverted bottleneck design with depthwise separable convolutions that improves parameter efficiency and representational power. Originally introduced in MobileNetV2 and scaled in EfficientNet [22], MBConv has since been adapted to biomedical imaging for efficient feature extraction [23-25]. These blocks allow the model to balance compactness with accuracy, making them suitable for clinical imaging where computational efficiency is critical.
3.3.3 Efficient channel attention
To enhance feature representation without significant overhead, we integrate Efficient Channel Attention (ECA) into each MBConv block. ECA computes channel attention via a fast 1-D convolution, avoiding the heavy fully connected layers used in earlier methods [26]. Reviews of attention mechanisms emphasize ECA as a lightweight yet effective choice [27], and recent work confirms its continued relevance in CNN design [28] as well as in medical image segmentation pipelines [29].
3.3.4 Anti-aliased down-sampling
In stride-2 operations, aliasing can distort fine structural details such as lesion boundaries. To mitigate this, we introduce blur pooling filters before down-sampling. Anti-aliased CNNs suppress high-frequency artifacts and improve shift-invariance [30], and they have been successfully applied in medical imaging, e.g., tuberculosis detection [31]. This ensures that clinically important small structures are preserved during feature reduction.
3.3.5 Multi-scale aggregation head
For classification, we aggregate features from the last four stages of the backbone. Each feature map is globally pooled and projected, then concatenated with outputs from a spatial pyramid pooling (SPP/PSP) module applied to the final stage. This design captures both local and global contextual information. Multi-scale pooling is a well-established strategy for robust scene parsing [32] and has proven effective in medical imaging tasks [33-35]. By combining global averages with pyramid pooling bins, our head integrates fine and coarse features critical for dental diagnosis.
3.3.6 Calibration layers
Reliable probability estimates are essential in medical decision support. We incorporate two complementary calibration techniques. First, Logit Normalization (Logit-Norm) stabilizes training by constraining logit magnitudes [36]. Second, a learnable temperature scaling parameter is optimized post-training to align predicted confidence with true correctness [37]. Surveys highlight that uncalibrated networks tend to be overconfident [38], while medical imaging reviews stress calibration as a requirement for trustworthy clinical AI [39, 40]. Together, these mechanisms improve the interpretability and clinical reliability of the model outputs.
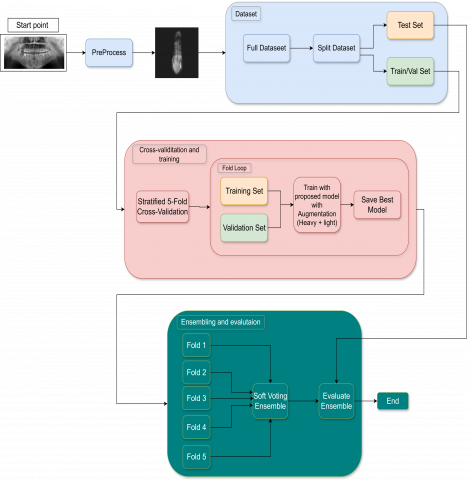
3.4 Training strategy
The overall workflow of training and evaluation is illustrated in Figure 4. Training was conducted in two phases: an initial heavy augmentation stage followed by a light augmentation stage to refine features on cleaner inputs. Class imbalance was addressed using weighted cross-entropy loss with label smoothing, where class weights were derived from the inverse frequency of each class. The complete dataset of 4,439 single-tooth images was first divided into a fixed hold-out test set (10%) and a main set (90%) used for cross-validation. The fixed test set (n = 444) remained completely unseen during model development and was used only for final evaluation. Within the main set (n = 3,995), a stratified 5-fold cross-validation scheme was applied to preserve the class distribution in each fold. In every rotation, 3,196 images were used for training and 799 images for validation. The best-performing model from each fold (based on validation F1-score) was saved and Training stopped if F1 did not improve for 30 epochs. After selecting the best-performing checkpoint in each fold, temperature scaling was optimized on the corresponding validation set to improve probability calibration. The five best models were later combined through soft-voting ensemble averaging to produce the final results on the independent test set.
Figure 4. Training and evaluation workflow of the proposed framework
3.5 Cross-validation and ensemble learning
Cross-validation is the standard practice for validating a model's capacity for generalization. Data is split into a number of folds, and each fold takes a turn as the validation set while the others are used for training. The rotation is a more equitable measure of performance than a single split [41]. Stratified k-fold cross-validation specifically preserves class proportions within folds, so results are more reproducible [42-44].
Ensemble learning improves robustness by considering the predictions of multiple models rather than relying on one model. Ensembles can be homogeneous, where the same model architecture is trained differently, or heterogeneous, where different types of models are used [45, 46]. A common approach is soft voting, where probability outputs are averaged to form the final prediction [47]. In our study, we used a homogeneous cross-validation ensemble, averaging the probability outputs from the best model of each fold to generate the final results.
3.6 Evaluate metrics
To evaluate classification performance, we used several standard metrics. Accuracy measures the proportion of correctly classified samples among all cases:
$Accuracy=\frac{TP+TN}{TP+TN+FP+FN}$ (1)
Precision indicates how many of the predicted positive cases are correct:
$Precision=\frac{TP}{TP+FP}$ (2)
Recall (Sensitivity) measures how many of the actual positive cases were correctly identified:
$Recall=\frac{TP}{TP+FN}$ (3)
To balance these two aspects, the F1-score combines them into a single value:
$F1=\frac{2\cdot Precision\cdot Recall}{Precision+Recall}$ (4)
Finally, the confusion matrix summarizes predictions across classes in tabular form, showing true versus predicted labels and highlighting common misclassifications.
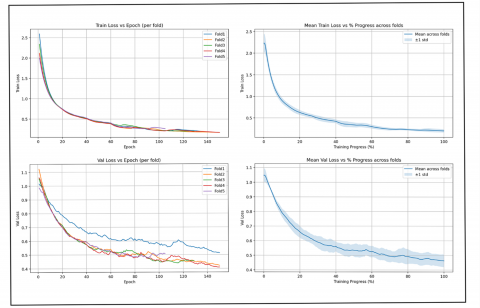
Training and validation behavior were monitored across folds to evaluate convergence. Figure 5 summarizes the learning curves, including training loss, mean training loss with ±1 standard deviation, validation accuracy per fold, and mean validation accuracy across folds. These curves demonstrate smooth convergence, steady improvements in validation accuracy, and no evidence of overfitting, confirming the robustness of the proposed model.
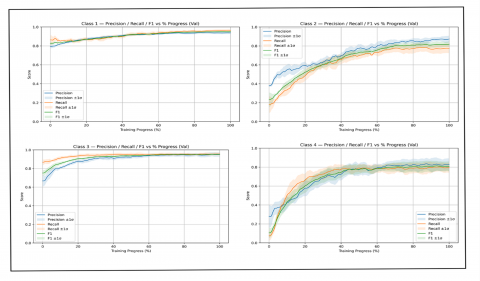
We further analyzed validation performance at the class level. Figure 6 presents precision, recall, and F1-score for each class as a function of training progress. For every metric, the solid line represents the mean value across folds, while the shaded area shows the ±1 standard deviation, reflecting variability between folds. The results demonstrate that performance improved steadily during training and converged consistently across classes, providing a detailed view of model behavior beyond overall averages.
Figure 5. Training and validation loss curves across folds
Figure 6. Per-class validation metrics (Precision, Recall, and F1-score) averaged across five folds
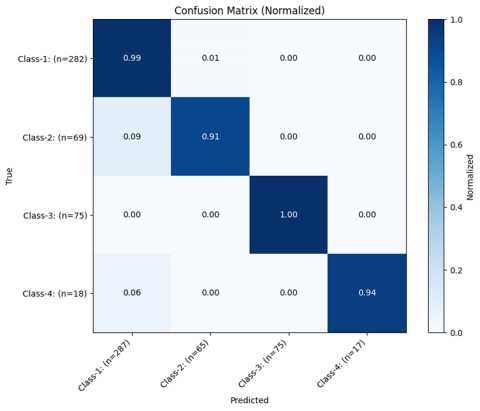
Figure 7. Normalized confusion matrix of the ensemble model
A quantitative summary of model performance is provided in Table 2, which reports accuracy, precision, recall, and F1-score for each of the five folds as well as the final ensemble model. The ensemble, obtained through soft voting, provides a more robust estimate of performance compared to individual folds.
The ensemble model’s results are summarized in the normalized confusion matrix shown in Figure 7. Each row corresponds to the true class, and each column to the predicted class, with values normalized to account for different sample sizes. The matrix highlights that most samples were correctly classified, as indicated by the strong diagonal values. Occasional misclassifications are visible, particularly between Class-2 and Class-1, and between Class-4 and Class-1, while Class-3 achieved perfect separation. Overall, the confusion matrix confirms the balanced and reliable performance of the ensemble model across all categories. The variation in F1-score across folds (Table 2), including the relatively lower performance in Fold 5, can be attributed to differences in the composition of training subsets under stratified cross-validation. Despite preserving overall class proportions, individual folds may contain more challenging samples, such as subtle lesions or borderline cases, which can affect learning. Importantly, the ensemble model mitigates this variance by aggregating predictions across folds, resulting in more stable and improved overall performance.
The previous related studies have all applied deep learning for single-tooth disease classification. Chen et al. [11] reported results for caries and periodontitis, ForouzeshFar et al. [12] focused on binary caries classification, Liu et al. [13] classified caries versus non-caries, and Li et al. [14] evaluated caries and periapical periodontitis. A comparison of their reported outcomes with the results of this study is shown in Table 3.
Table 2. Fold-wise and ensemble performance of the proposed method
|
Folds |
Accuracy |
Precision |
Recall |
F1-Score |
|
Fold 1 |
0.948 |
0.919 |
0.931 |
0.924 |
|
Fold 2 |
0.957 |
0.968 |
0.925 |
0.945 |
|
Fold 3 |
0.944 |
0.956 |
0.908 |
0.930 |
|
Fold 4 |
0.948 |
0.930 |
0.902 |
0.915 |
|
Fold 5 |
0.939 |
0.897 |
0.907 |
0.901 |
|
Ensemble |
0.980 |
0.986 |
0.963 |
0.974 |
Table 3. Fold-wise and ensemble performance of the proposed method
|
Ref. |
Class |
Results |
|
[11] |
Normal, Caries, Periodontitis, Both |
accuracy = 0.9494 (caries), accuracy = 0.9544 (periodontitis) |
|
[12] |
Sound vs Decayed |
Accuracy = 0.939 |
|
[13] |
Caries vs non-caries |
Accuracy ≈ 0.92 |
|
[14] |
Caries, Periapical periodontitis, Both, Normal |
F1 ≈ 0.83 (for both diseases) |
|
In this study |
Caries, Deep Caries, Impacted, Periapical Lesion |
Accuracy = 0.980, Precision = 0.986, Recall = 0.963, F1 = 0.974 |
The findings of this study demonstrate that convolutional neural networks can reliably classify multiple dental diseases at the single-tooth level from OPG-derived crops. The ensemble approach provided consistent and robust performance across folds, indicating that deep learning is effective for capturing disease-specific features in panoramic radiographs once teeth are isolated.
The confusion matrix (Figure 7) shows that most errors occur between visually similar categories, particularly between caries and deep caries (Class-1 and Class-2), and between caries and periapical lesions (Class-1 and Class-4). These classes may share overlapping radiographic features at early or transitional stages, such as subtle radiolucency’s and poorly defined boundaries. Class imbalance and limited samples for advanced lesions may also contribute to these misclassifications, indicating areas for further improvement.
Previous related studies have confirmed the feasibility of single-tooth classification using deep learning, but most were restricted to binary tasks or focused on a limited number of conditions in periapical or bitewing radiographs. The present study extends this line of research by addressing four clinically relevant categories—caries, deep caries, impacted teeth, and periapical lesions—on OPG-derived single-tooth images, and demonstrates high performance across all classes (Table 3). The comparison in Table 3 is based on single-tooth disease classification, not on whole-image or imaging-modality-level performance. Since all referenced studies perform classification at the single-tooth level, the comparison reflects task-level performance rather than differences in imaging modality.
These results have meaningful clinical implications. Automated tooth-level classification can assist dentists in routine evaluation of panoramic radiographs by highlighting potential abnormalities that may otherwise be overlooked. By improving diagnostic efficiency, such systems may also help reduce the workload of dental professionals, enabling them to devote more time to complex or urgent clinical cases.
Despite these strengths, several task-specific limitations should be acknowledged. Data availability constrained the diversity of the training set, and class imbalance was present. Nevertheless, the model was able to effectively learn under low-sample conditions, supported by weighted cross-entropy loss, data augmentation, and ensemble averaging, as reflected by stable performance across folds, although a limited sample size may reduce robustness and contribute to residual misclassifications. In addition, only four disease categories were included, whereas a comprehensive diagnosis would require a broader range of dental conditions. Moreover, while single-tooth cropping is consistent with the study’s task formulation and standardizes inputs, it may limit access to the surrounding anatomical context that could further aid discrimination between advanced disease patterns.
Future work should therefore focus on incorporating multi-center datasets to improve generalizability, expanding the number of disease categories, and addressing class imbalance. Moreover, as this study relied on pre-provided bounding boxes for tooth cropping, integrating the classifier with an automated detection or segmentation model will be necessary to build a complete end-to-end diagnostic system. Prospective validation in real-world clinical settings will also be important to confirm clinical applicability.
This study developed a deep learning framework for multi-class single-tooth disease classification using crops derived from panoramic radiographs. The proposed model achieved high performance, with the ensemble reaching an accuracy of 0.980 and an F1-score of 0.974. These results indicate that convolutional neural networks can effectively support diagnosis at the tooth level, potentially reducing workload for dental professionals and allowing more focus on complex cases. Future research should aim to expand the diversity of datasets, include a wider range of dental diseases, and integrate classification with detection models to enable a complete end-to-end diagnostic system.
The experiments were conducted using the DENTEX panoramic dental X-ray dataset, a publicly available benchmark providing tooth-level annotations for detection and diagnosis tasks. The dataset is available at https://arxiv.org/abs/2305.19112.
|
OPG |
Orthopantomogram (Panoramic Dental Radiograph) |
|
COCO |
Common Objects in Context (Dataset Annotation Format) |
|
JSON |
JavaScript Object Notation |
|
CNN |
Convolutional Neural Network |
|
CLAHE |
Contrast-Limited Adaptive Histogram Equalization |
|
SiLU |
Sigmoid Linear Unit |
|
MBConv |
Mobile Inverted Bottleneck Convolution |
|
ECA |
Efficient Channel Attention |
[1] GBD 2017 Oral Disorders Collaborators, Bernabe, E., Marcenes, W., Hernandez, C.R., Bailey, J., et al. (2020). Global, regional, and national levels and trends in burden of oral conditions from 1990 to 2017: A systematic analysis for the global burden of disease 2017 study. Journal of Dental Research, 99(4): 362-373. https://doi.org/10.1177/0022034520908533
[2] Peres, M.A., Macpherson, L.M., Weyant, R.J., Daly, B., et al. (2019). Oral diseases: A global public health challenge. The Lancet, 394(10194): 249-260. https://doi.org/10.1016/S0140-6736(19)31146-8
[3] Ardakani, M.S.Z., Bayati, M. (2025). Global situation of oral health coverage toward universal health coverage: A scoping review. Preventive Medicine Reports, 58: 103227. https://doi.org/10.1016/j.pmedr.2025.103227
[4] Winkelmann, J., Gómez Rossi, J., Schwendicke, F., Dimova, A., et al. (2022). Exploring variation of coverage and access to dental care for adults in 11 European countries: A vignette approach. BMC Oral Health, 22(1): 65. https://doi.org/10.1186/s12903-022-02095-4
[5] Różyło-Kalinowska, I. (2021). Panoramic radiography in dentistry. Clinical Dentistry Reviewed, 5(1): 26. https://doi.org/10.1007/s41894-021-00111-4
[6] Aldhafeeri, F.M. (2025). Governing artificial intelligence in radiology: A systematic review of ethical, legal, and regulatory frameworks. Diagnostics, 15(18): 2300. https://doi.org/10.3390/diagnostics15182300
[7] Ogut, E. (2025). Artificial intelligence in clinical medicine: Challenges across diagnostic imaging, clinical decision support, surgery, pathology, and drug discovery. Clinics and Practice, 15(9): 169. https://doi.org/10.3390/clinpract15090169
[8] Emami, M., Shirani, M. (2025). Application and performance of artificial intelligence in implant dentistry: An umbrella review. Dentistry Review, 5(3): 100159. https://doi.org/10.1016/j.dentre.2025.100159
[9] Liang, Y., Li, D., Deng, D., Chu, C.H., et al. (2025). AI-driven dental caries management strategies: From clinical practice to professional education and public self care. International Dental Journal, 75(4): 100827. https://doi.org/10.1016/j.identj.2025.04.007
[10] Abbott, L.P., Saikia, A., Anthonappa, R.P. (2025). Artificial intelligence platforms in dental caries detection: A systematic review and meta-analysis. Journal of Evidence-Based Dental Practice, 25(1): 102077. https://doi.org/10.1016/j.jebdp.2024.102077
[11] Chen, I.D.S., Yang, C.M., Chen, M.J., Chen, M.C., Weng, R.M., Yeh, C.H. (2023). Deep learning-based recognition of periodontitis and dental caries in dental x-ray images. Bioengineering, 10(8): 911. https://doi.org/10.3390/bioengineering10080911
[12] ForouzeshFar, P., Safaei, A.A., Ghaderi, F., Hashemikamangar, S.S. (2024). Dental Caries diagnosis from bitewing images using convolutional neural networks. BMC Oral Health, 24(1): 211. https://doi.org/10.1186/s12903-024-03973-9
[13] Liu, C.K., Lin, C.H., Lin, Y.H., Wu, F.H., et al. (2025). Identification of dental caries using a structured deep learning approach. Journal of Mechanics in Medicine and Biology, 25(5): 2540046. https://doi.org/10.1142/S0219519425400469
[14] Li, S., Liu, J., Zhou, Z., Zhou, Z., et al. (2022). Artificial intelligence for caries and periapical periodontitis detection. Journal of Dentistry, 122: 104107. https://doi.org/10.1016/j.jdent.2022.104107
[15] Christudhas, C. (2025). Recent trends in pixel-based image enhancement techniques using VLSI cores–A review. Results in Engineering, 25: 104481. https://doi.org/10.1016/j.rineng.2025.104481
[16] Hayati, M., Muchtar, K., Maulina, N., Syamsuddin, I., Elwirehardja, G.N., Pardamean, B. (2023). Impact of CLAHE-based image enhancement for diabetic retinopathy classification through deep learning. Procedia Computer Science, 216: 57-66. https://doi.org/10.1016/j.procs.2022.12.111
[17] Alkhouly, A.A., Mohammed, A., Hefny, H.A. (2021). Improving the performance of deep neural networks using two proposed activation functions. IEEE Access, 9: 82249-82271. https://doi.org/10.1109/ACCESS.2021.3085855
[18] Yi, D., Ahmedov, H.B., Jiang, S., Li, Y., Flinn, S.J., Fernandes, P.G. (2024). Coordinate-Aware Mask R-CNN with Group Normalization: A underwater marine animal instance segmentation framework. Neurocomputing, 583: 127488. https://doi.org/10.1016/j.neucom.2024.127488
[19] El Habib, B. (2025). Benchmarking normalization methods for a CNN based object detection computer vision model. Procedia Computer Science, 265: 560-565. https://doi.org/10.1016/j.procs.2025.07.219
[20] Kiliçarslan, S., Celik, M. (2021). RSigELU: A nonlinear activation function for deep neural networks. Expert Systems with Applications, 174: 114805. https://doi.org/10.1016/j.eswa.2021.114805
[21] Nguyen, D.T., Bui, T.D., Ngo, T.M., Ngo, U.Q. (2025). Improving YOLO-based plant disease detection using αSILU: A novel activation function for smart agriculture. AgriEngineering, 7(9): 271. https://doi.org/10.3390/agriengineering7090271
[22] Muthulakshmi, K., Jayalakshmi, M. (2025). Rethinking model of EfficientNet-B9 for brain tumor classification: A high-precision deep learning approach. Results in Engineering, 28: 107984. https://doi.org/10.1016/j.rineng.2025.107984
[23] Shang, J., Zhang, K., Zhang, Z., Li, C., Liu, H. (2023). A high-performance convolution block oriented accelerator for MBConv-based CNNs. Integration, 88: 298-312. https://doi.org/10.1016/j.vlsi.2022.10.012
[24] Lauande, M.G.M., Braz Junior, G., de Almeida, J.D.S., Silva, A.C., et al. (2024). Building a DenseNet-based neural network with transformer and MBConv blocks for penile cancer classification. Applied Sciences, 14(22): 10536. https://doi.org/10.3390/app142210536
[25] Ibrar, W., Khan, M.A., Hamza, A., Rubab, S., et al. (2025). A novel interpreted deep network for Alzheimer’s disease prediction based on inverted self attention and vision transformer. Scientific Reports, 15(1): 29974. https://doi.org/10.1038/s41598-025-15007-7
[26] Wang, C.Y., Liao, H.Y.M., Wu, Y.H., Chen, P.Y., Hsieh, J.W., Yeh, I.H. (2020). CSPNet: A new backbone that can enhance learning capability of CNN. In 2020 IEEE/CVF Conference on Computer Vision and Pattern Recognition Workshops (CVPRW), Seattle, WA, USA, pp. 390-391. https://doi.org/10.1109/CVPRW50498.2020.00203
[27] Liu, T., Luo, R., Xu, L., Feng, D., Cao, L., Liu, S., Guo, J. (2022). Spatial channel attention for deep convolutional neural networks. Mathematics, 10(10): 1750. https://doi.org/10.3390/math10101750
[28] Yang, Q., He, Y., Chen, H., Wu, Y., Rao, Z. (2025). A Novel lightweight facial expression recognition network based on deep shallow network fusion and attention mechanism. Algorithms, 18(8): 473. https://doi.org/10.3390/a18080473
[29] Zhang, J., Chen, X., Yang, B., Guan, Q., et al. (2025). Advances in attention mechanisms for medical image segmentation. Computer Science Review, 56: 100721. https://doi.org/10.1016/j.cosrev.2024.100721
[30] Suzuki, S., Takeda, S., Makishima, N., Ando, A., Masumura, R., Shouno, H. (2022). Knowledge transferred fine-tuning: Convolutional neural network is born again with anti-aliasing even in data-limited situations. IEEE Access, 10: 68384-68396. https://doi.org/10.1109/ACCESS.2022.3186101
[31] Singh, J., Tripathy, A., Garg, P., Kumar, A. (2020). Lung tuberculosis detection using anti-aliased convolutional networks. Procedia Computer Science, 173: 281-290. https://doi.org/10.1016/j.procs.2020.06.033
[32] Zhou, J., Hao, M., Zhang, D., Zou, P., Zhang, W. (2019). Fusion PSPnet image segmentation based method for multi-focus image fusion. IEEE Photonics Journal, 11(6): 1-12. https://doi.org/10.1109/JPHOT.2019.2950949
[33] Rana, K., Singh, G., Goyal, P. (2022). MSRD-CNN: Multi-scale residual deep CNN for general-purpose image manipulation detection. IEEE Access, 10: 41267-41275. https://doi.org/10.1109/ACCESS.2022.3167714
[34] Harouni, M., Goyal, V., Feldman, G., Michael, S., Voss, T.C. (2025). Deep multi-scale and attention-based architectures for semantic segmentation in biomedical imaging. Computers, Materials & Continua, 85(1): 331-366. https://doi.org/10.32604/cmc.2025.067915
[35] Elizar, E., Zulkifley, M.A., Muharar, R., Zaman, M.H.M., Mustaza, S.M. (2022). A review on multiscale-deep-learning applications. Sensors, 22(19): 7384. https://doi.org/10.3390/s22197384
[36] Cao, Z., Li, Y., Kim, D.H., Shin, B.S. (2024). Deep neural network confidence calibration from stochastic weight averaging. Electronics, 13(3): 503. https://doi.org/10.3390/electronics13030503
[37] Balanya, S.A., Maronas, J., Ramos, D. (2024). Adaptive temperature scaling for robust calibration of deep neural networks. Neural Computing and Applications, 36(14): 8073-8095. https://doi.org/10.1007/s00521-024-09505-4
[38] Gawlikowski, J., Tassi, C.R.N., Ali, M., Lee, J., et al. (2023). A survey of uncertainty in deep neural networks. Artificial Intelligence Review, 56(Suppl 1): 1513-1589. https://doi.org/10.1007/s10462-023-10562-9
[39] Varoquaux, G., Cheplygina, V. (2022). Machine learning for medical imaging: Methodological failures and recommendations for the future. NPJ Digital Medicine, 5(1): 48. https://doi.org/10.1038/s41746-022-00592-y
[40] Lambert, B., Forbes, F., Doyle, S., Dehaene, H., Dojat, M. (2024). Trustworthy clinical AI solutions: A unified review of uncertainty quantification in deep learning models for medical image analysis. Artificial Intelligence in Medicine, 150: 102830. https://doi.org/10.1016/j.artmed.2024.102830
[41] Szeghalmy, S., Fazekas, A. (2023). A comparative study of the use of stratified cross-validation and distribution-balanced stratified cross-validation in imbalanced learning. Sensors, 23(4): 2333. https://doi.org/10.3390/s23042333
[42] Ünalan, S., Günay, O., Akkurt, I., Gunoglu, K., Tekin, H.O. (2024). A comparative study on breast cancer classification with stratified shuffle split and K-fold cross validation via ensembled machine learning. Journal of Radiation Research and Applied Sciences, 17(4): 101080. https://doi.org/10.1016/j.jrras.2024.101080
[43] Rafało, M. (2022). Cross validation methods: Analysis based on diagnostics of thyroid cancer metastasis. ICT Express, 8(2): 183-188. https://doi.org/10.1016/j.icte.2021.05.001
[44] Kumar, M., Bhardwaj, V., Thakral, D., Rashid, A., Ben Othman, M.T. (2024). Ensemble learning based model for student’s academic performance prediction using algorithms. Ingénierie des Systèmes d’Information, 29(5): 1925-1935. https://doi.org/10.18280/isi.290524
[45] Warner, B., Ratner, E., Carlous-Khan, K., Douglas, C., Lendasse, A. (2024). Ensemble learning with highly variable class-based performance. Machine Learning and Knowledge Extraction, 6(4): 2149-2160. https://doi.org/10.3390/make6040106
[46] Singh, H., Sharma, P., Prabha, C., Meenakshi, Singh, S. (2024). Ensemble learning with an adversarial hypergraph model and a convolutional neural network to forecast stock price variations. Ingénierie des Systèmes d’Information, 29(3): 1151-1160. https://doi.org/10.18280/isi.290332
[47] Kumari, S., Kumar, D., Mittal, M. (2021). An ensemble approach for classification and prediction of diabetes mellitus using soft voting classifier. International Journal of Cognitive Computing in Engineering, 2: 40-46. https://doi.org/10.1016/j.ijcce.2021.01.001