Chaima Hannachi*![]() | Sofia Kouah
| Sofia Kouah![]() | Omar Cheikhrouhou
| Omar Cheikhrouhou![]() | Meryem Ammi
| Meryem Ammi![]() | Saeed M. Alqahtani
| Saeed M. Alqahtani![]()
© 2025 The authors. This article is published by IIETA and is licensed under the CC BY 4.0 license (http://creativecommons.org/licenses/by/4.0/).
OPEN ACCESS
Obstructive Sleep Apnea (OSA) is a common yet underdiagnosed sleep disorder associated with serious cardiovascular and metabolic risks. Early and accurate detection is critical for timely intervention and improved patient outcomes. To the best of our knowledge, this study presents the first hybrid Multiscale Convolutional Neural Network (MSC-CNN) and Extra Trees (ET) model for OSA detection using single-lead ECG signals, integrating deep learning for feature extraction with ensemble learning for classification. The MSC-CNN component uses three parallel convolutional branches with distinct kernel sizes (30, 15, and 3) to capture temporal features at multiple scales, which are then classified by the Extra Trees classifier, an ensemble-based method known for its robustness and resistance to overfitting. On the PhysioNet Apnea-ECG dataset, the proposed model achieved an accuracy of 93.83%. It also demonstrated balanced classification performance, with a precision of 91.72%, a recall of 92.28%, and an F1-score of 92.00%. In addition, the model achieved a specificity of 94.79%, and its discriminative ability was reflected in an AUC of 97.82%. Compared with recent state-of-the-art methods, MSC-ET offers competitive performance compared to existing methods, while remaining architecturally simple and interpretable. These results demonstrate the potential of AI-driven ECG analysis to provide cost-effective, non-invasive, and scalable screening for OSA in clinical and home monitoring settings.
single-lead ECG, Extra Trees classifier, Multiscale Convolutional Neural Network, sleep apnea
Sleep occupies approximately one-third of the human lifespan and is a fundamental biological process essential for both physical and mental restoration [1]. High-quality sleep strengthens the immune system, consolidates memory, regulates metabolism, and supports cardiovascular health [2]. Conversely, poor sleep is associated with numerous disorders, including Obstructive Sleep Apnea (OSA), insomnia, diabetes, hypertension, and depression [3].
Among these disorders, OSA is one of the most common and widely underdiagnosed conditions, posing serious health risks, as it is estimated that approximately 1 billion individuals worldwide suffer from OSA [4].
In the United States alone, OSA affects about 22 million individuals [5], while prevalence rates in Europe range from 17 to 23% of the general population [6]. This high prevalence is particularly concerning given that OSA often remains undiagnosed, especially in low-resource settings or among patients lacking access to specialized sleep laboratories.
These observations underscore the substantial global burden of OSA and highlight the urgent need for effective and accessible detection methods.
Sleep apnea is characterized by repeated cessations of breathing during sleep, each lasting at least 10 seconds. It manifests in two main forms: (i) Obstructive Sleep Apnea, caused by a blockage of the upper airway, and (ii) central sleep apnea, which results from the brain's failure to send signals to the respiratory muscles [7].
Accurate diagnosis of these apnea events typically requires the use of overnight monitoring systems. Polysomnography (PSG) remains the gold standard for diagnosing OSA and its subtypes. PSG is a comprehensive sleep study and diagnostic tool commonly used in sleep medicine to monitor various physiological signals, including the electrocardiogram (ECG), electroencephalogram (EEG), electromyogram (EMG), blood oxygen saturation, thoracic and abdominal movements, and airflow [8]. While PSG offers high diagnostic accuracy, it has several limitations: the need for overnight laboratory monitoring, significant patient discomfort, high costs, and long waiting times [9]. These limitations have motivated growing interest in alternative, noninvasive approaches for sleep apnea detection.
To address these limitations, researchers have turned to automated detection methods using simpler physiological signals, particularly the electrocardiogram (ECG). The ECG signal is noninvasive, widely available, and contains rich information related to autonomic nervous system activity, making it well suited for apnea detection [10, 11]. Early studies applied traditional machine learning techniques using handcrafted features derived from ECG or ECG-based signals such as heart rate variability (HRV) and ECG-derived respiration (EDR). Thachayani and Loganayagi [12] applied Support Vector Machines (SVM) and achieved 84.38% accuracy, Qatmh et al. [13] used an artificial neural network (ANN) and reached 92.34% accuracy, and Ramachandran et al. [14] employed a K-Nearest Neighbors (KNN) model with 84.7% accuracy.
Although these models are simple and interpretable, their reliance on handcrafted, context-dependent features and domain-specific knowledge limits their performance and generalizability across different patients and recording conditions.
In recent years, deep learning models have emerged as powerful alternatives due to their ability to automatically learn discriminative features from raw or minimally processed ECG signals, thereby eliminating the need for handcrafted feature engineering. Wicaksono and Yunanda [15] proposed a one-dimensional CNN (1D-CNN) model with 88.36% accuracy, Biswas and Yousuf [16] introduced a Transformer-based deep learning model, reaching 91.85% accuracy, while Choudhury et al. [17] applied a modified GoogLeNet to ECG scalograms, achieving 93.85% accuracy. Overall, deep learning approaches demonstrate strong performance but require high computational resources and often lack interpretability, which may limit their clinical adoption.
Hybrid approaches that combine CNN-based feature extraction with conventional machine learning classifiers such as random forest (RF), Support Vector Machine (SVM), or Extra Trees remain underexplored in this domain. These models offer the potential to combine the feature learning capabilities of deep networks with the robustness and interpretability of ensemble methods. In this study, we leverage this hybrid design by introducing a multiscale CNN feature extractor combined with an Extra Trees classifier. Motivated by this observation, the present study introduces a multiscale CNN feature extractor coupled with an Extra Trees classifier, referred to as the MSC-ET model for ECG-based sleep apnea detection, providing a robust solution without relying on additional signal modalities.
Despite the progress of deep learning approaches in sleep apnea detection, several challenges persist. Many models suffer from high computational complexity, which restricts their deployment in real-time or resource-constrained environments. The widespread use of softmax classifiers also limits flexibility in decision boundaries. Most existing models also fail to incorporate multiscale temporal representations, which are essential for capturing both short- and long-term dependencies in ECG signals.
In this paper, we aim to develop a hybrid model for sleep apnea detection using single-lead ECG signals. The proposed method, Multiscale CNN–Extra Trees (MSC-ET), integrates multiscale temporal feature extraction through a CNN architecture with an ensemble Extra Trees classifier to enhance both detection accuracy and interpretability. Specifically, the multiscale CNN extracts feature at multiple temporal resolutions from raw ECG signals, capturing both short- and long-term patterns associated with apnea events, while these features are then classified using an Extra Trees ensemble, offering robust performance and enhanced interpretability.
The main contributions of this study are as follows:
The remainder of this paper is organized as follows: Section 2 reviews related work. Section 3 outlines the materials and methods. Section 4 presents the experimental results and discussion. Section 5 discusses limitations and directions for future work. Section 6 concludes the paper.
Recent advancements in deep learning have led to the development of diverse approaches for the automatic detection of Obstructive Sleep Apnea (OSA) using single-lead ECG signals. Existing methods can be broadly categorized according to the type of input representation employed: raw ECG signals, derived ECG features, and ECG-transformed image representations.
Raw ECG-based methods operate directly on unprocessed or minimally processed waveforms, enabling end-to-end learning from time-domain data. Li et al. [18] proposed EDSFnet, combining a deep residual branch for extracting high-level features with a shallow CNN for extracting lower-level features with higher resolution. By employing Effective Channel Attention for adaptive fusion, the model achieved an accuracy of 92.6% on the Apnea-ECG dataset. Paul et al. [19] developed a real-time CNN framework for raw ECG and SpO₂ signals without any preprocessing. They addressed class imbalance using SMOTE and tested different window sizes (30 s, 20 s, and 10 s), finding that a 10-second window delivered the best performance.
Their convolutional neural network achieved an accuracy of 96%, precision of 95%, recall of 97%, and F1-score of 96% for SpO₂ signals. For ECG, the model reached an accuracy of 95%, precision of 94%, recall of 96%, and F1-score of 95%. Wicaksono and Yunanda [15], on the other hand, demonstrated that a 1D-CNN trained on raw ECG outperformed traditional machine learning models like Random Forest (RF), Decision Tree (DT), and K-Nearest Neighbors (KNN), reaching an accuracy of 88.36%, precision of 89.63%, recall of 91.36%, and F1-score of 90.49%.
Furthermore, Hossan et al. [20] introduced DeepApneaNet, a cascaded CNN–BiLSTM architecture operating on raw 1-minute ECG segments, reaching 88.61% accuracy, 84.23% sensitivity, and 91.04% specificity. Additionally, Widad et al. [21] proposed a lightweight end-to-end One-Dimensional Convolutional Neural Network (1D-CNN) model for the automatic detection of OSA using single-lead ECG signals. The model processes 1-minute ECG segments and consists of four convolutional layers, pooling layers (evaluated with both max and average pooling), dropout, and fully connected layers. The best performance was achieved using average pooling with a filter length of 9 and 20 filters, reaching an accuracy of 92.6%.
More recently, Liu et al. [22] employed a CNN–Transformer-based model. The architecture combines a Convolutional Neural Network (CNN) to extract local features from 3-minute ECG segments and a Transformer module that leverages self-attention to model global temporal dependencies and perform final classification. The model was evaluated on the Apnea-ECG dataset, resulting an accuracy of 88.2%. Biswas and Yousuf [16] proposed a Transformer-based framework. The architecture combines a multiscale 1D-CNN for local feature extraction with a Transformer block to capture long-term dependencies using self-attention. Evaluated on 1-minute ECG segments from the PhysioNet Apnea-ECG dataset, the model achieved 91.85% accuracy, 90.45% sensitivity, 92.92% specificity, 88.82% precision, and an F1-score of 89.6%.
Yeh et al. [23] proposed a sleep apnea detection model using filter bank decomposition and a 1D CNN. One-minute ECG signals were decomposed into 15 subbands using Butterworth filters, and each subband was processed by an independent CNN for classification. The model, tested on both subject-dependent and subject-independent datasets from the PhysioNet Apnea-ECG database, achieved up to 88.6% per-minute accuracy on the subject-dependent set and 85.8% per-minute on the subject-independent set for the 31.25–37.5 Hz subband.
ECG-derived feature methods, which use signals such as RR intervals, heart rate variability (HRV), and ECG-derived respiration (EDR), are widely utilized because of their strong relationship with apnea events. Vu et al. [24] extracted RR intervals and R amplitudes using the Teager Energy Operator and trained an SE-ResNeXt50 model, which achieved 89.21% accuracy, 90.29% sensitivity, 87.36% specificity, 92.43% precision, and an F1-score of 90.85%. Similarly, Jiao et al. [25] proposed DAN-MTIF, which utilized standardized RR intervals and R-peak amplitudes from variable-length segments (1, 3, and 5 minutes) and applied a multi-head attention mechanism to extract temporally relevant features, resulting in 91.06% accuracy, 93.96% precision, 84.70% sensitivity (recall), 95.88% specificity, and an F1-score of 89.09%.
Additionally, Tyagi and Agrawal [26] explored biologically inspired processing by designing a spiking neural network trained on spike-encoded HRV and EDR features using a leaky integrate-and-fire (LIF) model and temporal encoding. The model demonstrated exceptional performance, achieving 94.63% accuracy in per-segment classification, along with strong specificity (96.21%), sensitivity (92.04%), and an AUC of 0.9851. Validation on the UCD dataset yielded 84.57% accuracy. Moreover, Shen et al. [27] proposed a multiscale dilated CNN using RR interval sequences in combination with a weighted-loss time-dependent hidden Markov model (WLTD-HMM), achieving 89.4% accuracy, 89.8% sensitivity, 89.1% specificity, 83.6% precision, 86.6% F1-score, an AUC of 0.964 per segment, and 100% accuracy with a mean absolute error of 0.42 at the subject level.
Image-based ECG representations convert 1D signals into 2D time–frequency formats such as spectrograms, scalograms, or Gramian angular fields to leverage the spatial pattern recognition strengths of convolutional architectures. For instance, Lin et al. [28] employed wavelet-based time–frequency images as input to a Coordinate Attention–enhanced EfficientNet (CA-EfficientNet). Their study showed that longer ECG segments (3 minutes) and Fbsp wavelets improved OSA detection. Additionally, coordinate attention (CA) and Dice loss helped address feature localization and data imbalance. The model achieved an accuracy of 92.51%, precision of 94.8%, sensitivity of 84.5%, specificity of 97.3%, F1-score of 89.4%, and an AUC of 90.9%.
In a related approach, Bhongade and Gandhi [29] proposed WIVIDOSA-Net, which uses Wigner–Ville Distribution spectrograms smoothed with a Savitzky–Golay filter and classified using a six-layer CNN, achieving an accuracy of 90.09%, sensitivity of 87.41%, specificity of 91.12%, precision of 86.68%, and F1-score of 87.03%. Choudhury et al. [17] introduced a transfer learning framework in which ECG signals were converted into scalograms using continuous wavelet transform (CWT) and classified using a modified GoogLeNet. Enhanced with LIME-based visual explanations, the model achieved 93.85% accuracy, 93.42% sensitivity, 94.30% specificity, and an F1-score of 93.83% on the Apnea-ECG dataset, while also performing well on UCDDB (87.20%) and MIT-BIH (88.58%).
Furthermore, Zhou and Kang [30] proposed MFAE-OSA, a multi-feature ensemble framework using both scalogram and Gramian Angular Field (GAF) representations, which were fed into a hybrid residual–inception CNN ensemble with a soft voting mechanism. Their method achieved 96.37% accuracy, 94.67% sensitivity, 97.44% specificity, and an AUC of 0.96.
Table 1 provides a synthesized comparison of the reviewed studies, emphasizing their key findings and contributions. Previous studies on sleep apnea detection have predominantly relied on end-to-end deep learning architectures, such as convolutional neural networks, bidirectional long short-term memory networks (BiLSTMs), and Transformer-based models.
These approaches often incorporate complex time–frequency transformations (e.g., scalograms, spectrograms) or derived ECG features such as RR intervals and heart rate variability (HRV). While they demonstrate strong classification performance, they typically introduce significant computational overhead and lack the flexibility required for real-time deployment.
Moreover, limited research has explored multiscale kernel optimization or the integration of ensemble learning techniques, which have the potential to enhance model robustness and interpretability. Most existing models rely on softmax-based classifiers without benchmarking alternative methods.
To address these limitations, this study proposes a novel hybrid framework that combines multiscale CNN-based feature extraction with the Extra Trees ensemble classifier. The proposed approach is modular, interpretable, and computationally efficient, eliminating the need for extensive signal transformations and supporting real-time applicability.
3.1 Overview of the proposed model
The proposed framework employs a hybrid architecture to automatically identify sleep apnea episodes from raw single-lead ECG data. As illustrated in Figure 1, the framework consists of three stages: preprocessing, multiscale feature extraction, and classification.
Figure 1. The structure of the proposed framework
During the preprocessing stage, ECG signals were filtered and segmented to reduce noise and standardize the input.
In the feature extraction stage, a multiscale convolutional neural network (CNN) was employed to capture both short-term and long-term temporal dependencies present in the ECG signals. These learned feature representations are then fed into an Extra Trees ensemble classifier, selected for its robustness, interpretability, and resistance to overfitting.
Table 1. Overview and comparison of related sleep apnea studies
|
Ref |
Input Type |
Model |
Key Features |
Accuracy (%) |
Precision (%) |
Recall (%) |
Specificity (%) |
F1-Score (%) |
AUC |
|
[18] |
Raw ECG |
EDSFnet (Deep–Shallow Fusion) |
Deep residual branch extracts high-level+Shallow CNN captures high resolution+ Effective, Channel Attention for adaptive feature fusion |
92 |
– |
– |
– |
– |
– |
|
[19] |
Raw ECG & SpO2 |
Real-Time CNN |
End-to-end architecture + Class imbalance addressed using SMOTE + Evaluation across window sizes (10s, 20s, 30s) |
ECG: 95 SpO2: 96 |
ECG: 94 SpO2: 95 |
ECG: 96 SpO2: 97 |
– |
ECG: 95 SpO2: 96 |
– |
|
[15] |
Raw ECG |
1D-CNN |
End-to-end model+ CNN model outperforms traditional machine learning classifiers |
88.36 |
89.63 |
91.36 |
– |
90.49 |
– |
|
[20] |
Raw ECG |
Deep ApneaNet (CNN-BiLSTM) |
Cascaded architecture combining CNN and BiLSTM |
88.61 |
– |
84.23 |
91.04 |
– |
– |
|
[21] |
Raw ECG |
1D-CNN |
End-to-end model |
92.6 |
– |
– |
– |
– |
– |
|
[22] |
Raw ECG |
CNN + transformer |
CNN extracts local features + self-attention to capture global temporal dependencies |
88.2 |
– |
– |
– |
– |
– |
|
[23] |
Raw ECG |
1D-CNN |
Utilized Filter Bank+ End-to- end CNN model+ + Subject- Independent Evaluation |
88.6(SD) 85.8 (SI) |
– |
– |
– |
– |
– |
|
[16] |
Raw ECG |
CNN + transformer |
Multi-scale 1D-CNN+ Applied Transformer blocks to capture long-term temporal dependencies |
91.85 |
88.82 |
90.45 |
92.92 |
89.6 |
– |
|
[24] |
RR intervals, R amplitudes |
SE-ResNeXt50 |
Employed a Squeeze and Excitation ResNeXt-50 model + Applied Teager Energy Operator (TEO) |
89.21 |
92.43 |
90.29 |
87.36 |
90.85 |
– |
|
[25] |
RR intervals, R-peak am- plitudes |
DAN-MTIF |
Used variable- length segments + applied CNN + Multihead attention |
91.06 |
93.96 |
84.70 |
95.88 |
89.09 |
– |
|
[26] |
HRV, EDR |
Spiking Neural Network (LIF) |
Used a biologically inspired neural + Applied temporal encoding to convert ECG signals into spike |
94.63 84.57 |
– |
92.04 |
96.21 |
– |
0.9851 |
|
[27] |
RR intervals |
MS-Dilated CNN + WLTD-HMM |
Applied Multiscale dilation attention 1D CNN + Utlised Attention Mechanism |
89.4 |
83.6 |
89.8 |
89.1 |
86.6 |
0.964 |
|
[28] |
Scalogram |
CA-EfficientNet |
used Wavelet transform to turn ECG signals into time–frequency images + Utilized EfficientNet model with coordinated attention |
92.51 |
94.8 |
84.5 |
97.3 |
89.4 |
0.909 |
|
[29] |
Spectrogram |
WIVIDOSA-Net |
Used smoothed Wigner –Ville spectrograms (SWVSs) + Applied Savitzky Golay filtering |
90.09 |
86.68 |
87.41 |
91.12 |
87.03 |
– |
|
[17] |
Scalogram (CWT) |
GoogLeNet (Transfer Learning) |
Used CWT to turn ECG signals into scalograms+ Used LIME |
93.85 87.20 88.58 |
– |
93.42 |
94.30 |
93.83 |
– |
|
[30] |
Scalogram + GAF |
MFAE-OSA (Hybrid Ensemble) |
Utilized CWT + GAF for image conversion + Combines residual and inception blocks |
96.37 |
– |
94.67 |
97.44 |
– |
0.96 |
The model produces a binary output for each input segment, where 0 indicates a normal event and 1 denotes the presence of a sleep apnea episode. By combining automatic learning of complex patterns from raw ECG signals with the stability of ensemble-based classification, the hybrid model effectively addresses variability in ECG data and improves detection accuracy while reducing the risk of overfitting.
3.2 Apnea-ECG data description
This study employed the Apnea-ECG dataset [31, 32] which was provided by Philipps University. The dataset contains 70 single-lead ECG recordings obtained from 32 subjects, sampled at 100 Hz with a 16-bit resolution.
The dataset is divided into:
Recording durations range from approximately 7 to 10 hours. Only the released dataset includes apnea annotations—A (Apnea) or N (Normal)—provided by a human expert, indicating the presence or absence of apnea events at each minute.
All annotated apnea events are either obstructive or mixed, while events of pure central apnea and Cheyne–Stokes respiration are not included. In addition, the dataset includes machine-generated QRS annotations.
Recordings are categorized into three classes:
Although these record-level categories are defined, the present study adopted a minute-level classification strategy using binary labels (A/N). Minute-wise ECG segments with valid labels from recordings in all three classes are pooled to construct the training and test sets. Therefore, the A/B/C classification of each record does not directly influence the sample distribution used for model training.
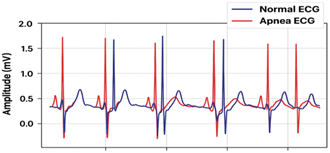
Figure 2 illustrates ten seconds of normal and apnea ECG signals from record a01.
Figure 2. Ten seconds of normal and apnea ECG signals from record a01
3.3 Preprocessing
Electrocardiogram (ECG) signals are frequently used for detecting Obstructive Sleep Apnea due to their non-invasive nature and their ability to effectively reflect changes in both the autonomic nervous system and respiratory activity during sleep [33]. However, raw ECG recordings are commonly affected by noise, typically introduced by electromyographic activity, respiratory motion artifacts, and unstable electrode-skin contact [34].
To address these challenges and improve signal clarity, several preprocessing steps were applied:
$Z=\frac{\text{X}-\text{ }\!\!\mu\!\!\text{ }}{\text{ }\!\!\sigma\!\!\text{ }}$ (1)
where, X is the original signal, µ is the mean, and σ is the standard deviation of the segment
Figure 3 presents an example of a 5-second ECG segment before and after applying the high-pass and notch filters.
Figure 3. Example of a 5-second ECG segment before and after filtering
3.4 The model architecture
In this section, we introduce a novel framework, named MSC-ET (Multiscale CNN with Extra Trees), for automatic sleep apnea (SA) detection using single-lead ECG signals. The proposed model consists of two main modules:
The step-by-step procedure of the proposed model is illustrated in Algorithm 1.
|
Algorithm 1. Proposed MSC-ET model |
|
1: Input: ECG _segment ← 30-second preprocessed single-lead ECG signal 2: Output: label ∈ {1, 0}, where 1 = Apneic and 0 = Normal 3: xnormalized ← BatchNormalization(ECG_segment) 4: kernel_sizes ← {3, 15, 30} 5: branches ← empty list 6: for each kernel_size in kernel_sizes do 7: Block 1: 8: x ← Conv1D(xnormalized,filters=45, kernel_size, padding=’same’) 9: x ← BatchNormalization(x) 10: x ← ReLU(x) 11: x ← MaxPooling1D(x, pool_size=2, stride=2) 12: Block 2: 13: x ← Conv1D(xnormalized,filters=90, kernel_size, padding=’same’) 14: x ← BatchNormalization(x) 15: x ← ReLU(x) 16: x ← MaxPooling1D(x, pool_size=2, stride=2) 17: Block 3: 18: x ← Conv1D(xnormalized,filters=135, kernel_size, padding=’same’) 19: x ← BatchNormalization(x) 20: x ← ReLU(x) 21: x ← MaxPooling1D(x, pool_size=2, stride=2) 22: x ← Dropout(x, rate=0.5) 23: Append x to branches 24: end for 25: merged_features ← Concatenate(branches along channel axis) 26: feature_vector ←GlobalAveragePooling1D(merged_features) 27: Train Extra Trees Classifier using feature_vector and corresponding labels 28: for each new ECG_segment do 29: extract feature_vector 30: Predict label using trained classifier 31: end for 32: return predicted label |
Multiscale Convolutional Neural Network: The proposed multiscale feature extraction module is designed to extract time-series features from single-lead ECG signals at various scales via convolutional layers with multiple kernel sizes. This enables sensitive characterization of apnea-related signal changes.
Initially, the input signal was normalized using a batch normalization layer to stabilize training. The signal was then processed through three parallel convolutional branches, each designed with a unique kernel size (30, 15, and 3), which were selected empirically to enable multiscale feature extraction. This approach allows the model to capture both fine-grained details and long-range dependencies, which are crucial for accurately detecting apnea events.
Each branch has three convolutional blocks:
The convolution computation in each layer is mathematically defined as:
$Y_{i}^{\left( l \right)}=\underset{j}{\overset{k}{\mathop \sum }}\,x_{i+j-1}^{l-1}.w_{j}^{l}+{{b}^{l}}$ (2)
where, xl−1 is the input, wl is the kernel weights, bl is the bias term, and k is the kernel size.
Once feature extraction has been completed, the outputs from the three branches are concatenated along the channel dimension to form a multiscale feature map with c channels and t time steps.
To eliminate the time dimension and retain the salient information from each multiscale output, we apply a global average pooling (GAP) layer. The GAP layer computes the mean of each feature map (channel) across the t time steps, producing a compact feature vector for classification. Mathematically,the global average pooling (GAP) operation produces a feature vector z ∈ RC, where each element is computed as:
${{Z}_{C}}=\frac{1}{T}+\mathop{\sum }_{t=1}^{T}{{f}_{c}}\left( t \right)~~~for~c=1,2,\ldots .C$ (3)
where, fc(t) denotes the activation of the c-th channel at time step t, T is the number of time steps, and C is the total number of channels. The resulting vector z = [z1, z2, . . . , zC] captures the average activation of each channel, with each component representing the temporal summary of a specific feature map. The full structure of this module is illustrated in Figure 4.
Figure 4. Architecture of the multiscale CNN feature extraction module
Classification module: To classify each 30-second ECG segment as apneic or normal, we adopted the Extremely Randomized Trees (Extra Trees) algorithm, a robust ensemble method.
The classifier uses feature vectors generated from the global average pooling (GAP) layer in the multiscale CNN-based feature extraction module. Extra Trees constructs multiple decision trees using randomized subsets of features and split points, even during the tree construction phase.
This increased randomness results in a more diverse set of trees, enhancing generalization, reducing overfitting, and often leading to faster training times. It enables the model to form more flexible and robust decision boundaries [41].
3.5 Training
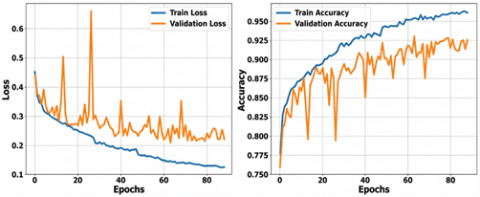
In the first stage of the proposed framework, a multiscale CNN-based feature extraction module was trained to automatically learn high-level representations from the input signals. The network was initialized using the He normal initializer [42] and optimized with the Adam optimizer (learning rate = 0.001) [43]. The model was trained for up to 200 epochs with a batch size of 32, using binary cross-entropy as the loss function. Early stopping with a patience of 25 epochs and a ReduceLROnPlateau scheduler (factor = 0.5, patience = 10) were applied to prevent overfitting and enhance training efficiency. The model achieved its highest validation accuracy at epoch 62, as illustrated in Figure 5. A summary of the training hyperparameters is provided in Table 2.
Figure 5. Training and validation loss and accuracy
Table 2. Hyperparameter configurations used in the proposed model
|
Hyperparameter |
Value |
Hyperparameter |
Value |
|
Initializer |
He normal |
Optimization Algorithm |
Adam |
|
Learning Rate |
0.001 |
Number of Training Epochs |
200 |
|
Batch Size |
32 |
Loss Function |
Binary Cross-Entropy |
|
Early Stopping Patience |
25 |
LR Scheduler Factor |
0.5 |
|
LR Scheduler Patience |
10 |
Minimum Learning Rate |
1e-6 |
In the second stage, the feature vectors extracted by the CNN were used as inputs to an Extra Trees classifier, implemented using the ExtraTreesClassifier from scikit-learn, with 100 estimators and a fixed random state of 42. All other hyperparameters were kept at their default values. Model training and evaluation were carried out using 5-fold cross-validation, where the entire dataset was partitioned into five equal folds. In each iteration, four folds were used for training and the remaining fold for testing, ensuring that every sample was evaluated exactly once.
This approach provided a reliable estimate of model performance without requiring a separate hold-out test set. All experiments were conducted on the Kaggle platform using an NVIDIA T4 GPU. The dataset contained 17,010 samples (10,496 normal and 6,514 apnea).
3.6 Performance metrics
The evaluation metrics for SA detection include Accuracy (Acc), Sensitivity (Sens), Specificity (Spec) and F1-score, which are defined to be:$~$
$Accuracy~\left( Acc \right)=\frac{\text{TP}+\text{TN}}{\text{TP}+\text{TN}+\text{FP}+\text{FN}}$ (4)
$Sensitivity~\left( Sens \right)=\frac{\text{TP}}{\text{TP}+\text{FN}}$ (5)
$Precision~\left( Prec \right)=\frac{\text{TP}}{\text{TP}+\text{FP}}$ (6)
$Specificity~\left( Spec \right)=\frac{\text{TN}}{\text{TN}+\text{FP}}$ (7)
Due to the class imbalance in the dataset—where normal segments significantly outnumber apneic ones—accuracy alone may be misleading. To provide a more reliable evaluation, we additionally report the F1-score, which balances precision and sensitivity, and the Area Under the ROC Curve (AUC), which provides a threshold-independent measure of the classifier’s discriminative ability. These metrics are defined as follow:
$F1~Score=2\times \frac{\text{Perc}\times Sens}{\text{Perc}+Sens}$ (8)
$AUC=\mathop{\int }_{0}^{1}TPR\left( FPR \right)d\left( FPR \right)$ (9)
where, TP indicates the number of SA segments correctly identified as SA, TN is the number of normal segments correctly identified as normal, FN represents the SA segments incorrectly identified as normal, FP is the number of normal segments incorrectly identified as SA.
This section presents the experimental results of the proposed framework, followed by ablation studies designed to evaluate the contribution of individual model components. Model performance was assessed using standard evaluation metrics, including accuracy, precision, recall, specificity, and F1-score.
4.1 Classification results
The proposed model, which combines a multiscale convolutional neural network with three parallel convolutional branches and an Extra Trees classifier, demonstrated strong performance on the test dataset. High accuracy, precision, recall, and F1-score values indicate the model’s ability to reliably differentiate between apneic and non-apneic ECG segments. These findings emphasize the ability of the multiscale feature extraction module to capture both short- and long-term temporal patterns in ECG signals, as well as the generalizability of the Extra Trees ensemble classifier.
The classification performance of each iteration in the 5-fold cross-validation is presented in Table 3, while Figure 6 illustrates the average performance across the five folds. The results demonstrate consistent performance, with an overall accuracy of 93.82% ± 0.29, indicating robust model behavior. Precision (91.67% ± 0.59) and recall (92.25% ± 0.47) were well balanced, reflecting the model’s ability to detect apnea events while minimizing false positives. Reflecting the model’s ability to detect apnea events while minimizing false positives. Similarly, the high specificity (94.80% ± 0.40) confirms that the model correctly identifies normal cases with strong reliability. The F1-score (91.96% ± 0.37) further supports the balance between precision and recall, while the ROC AUC (98.27% ± 0.09) highlights the excellent discriminative power of the model in distinguishing between apneic and normal segments Finally, the low standard deviations across folds demonstrate the stability of the model during cross-validation.
Figure 6. Model performance
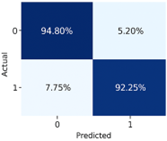
To better understand the model’s classification behavior, an average confusion matrix was generated from the predictions obtained during the cross-validation process. This matrix provides insight into the distribution of correctly and incorrectly classified apneic and normal ECG segments, thereby illustrating the balance between sensitivity (true positive rate) and specificity (true negative rate). As shown in Figure 7, the model correctly classified most of the apneic and normal segments with accuracies of 92.25% and 94.80%, respectively, while maintaining minimal false positives and false negatives. This indicates that the model performs well in detecting apnea events while preserving a low misclassification rate. Furthermore, Figure 8 illustrates the average ROC curve, which demonstrates the trade-off between sensitivity and specificity across different classification thresholds. The high area under the curve (AUC) further confirms the model’s effectiveness in distinguishing between apnea and normal events.
Figure 7. Binary confusion matrix
Figure 8. Model performance ROC
Table 3. Performance metrics across 5-fold cross-validation
|
Folds |
Accuracy |
Precision |
Recall |
Specificity |
F1-Score |
ROC AUC |
|
Fold 1 |
93.83 |
91.18 |
92.86 |
94.43 |
92.01 |
98.24 |
|
Fold 2 |
93.92 |
91.58 |
93.63 |
94.71 |
92.10 |
98.37 |
|
Fold 3 |
94.06 |
92.51 |
91.94 |
95.38 |
92.22 |
98.28 |
|
Fold 4 |
94.03 |
92.18 |
92.25 |
95.14 |
92.21 |
98.35 |
|
Fold 5 |
93.27 |
90.93 |
91.56 |
94.33 |
91.24 |
98.12 |
|
Average |
93.82 ± 0.29 |
91.67 ± 0.59 |
92.25 ± 0.47 |
94.80 ± 0.40 |
91.96 ± 0.37 |
98.27 ± 0.09 |
4.2 Performance comparison with state-of-the-art
The proposed MSC-ET model was compared with recent state-of-the-art (SOTA) methods for OSA detection based on raw ECG signals. For a fair and consistent comparison, we evaluate MSC-ET against models that process raw ECG signals directly. Methods that transform ECG into images or extract statistical features are excluded due to differences in input representation and task complexity. As shown in Table 4, the proposed MSC-ET model, which combines a Multiscale Convolutional Neural Network for feature extraction with an Extra Trees ensemble classifier, demonstrates strong performance across all evaluation metrics. It employs multiscale convolutional kernels (sizes 30, 15, and 3) to extract both global and local temporal features (Table 3), performance of state-of-the-art sleep apnea detection models using ECG signals enhancing temporal resolution, and leverages an efficient ensemble classifier to improve robustness in binary classification.
Table 4. Performance of state-of-the-art sleep apnea detection models using ECG signals
|
Ref. |
Accuracy |
Sensitivity |
Specificity |
Precision |
F1-Score |
|
[18] |
92.6% |
N/A |
N/A |
N/A |
N/A |
|
[19] |
95.0% |
96.0% |
N/A |
94.0% |
95.0% |
|
[15] |
88.36% |
91.36% |
N/A |
89.63% |
90.49% |
|
[20] |
88.61% |
84.23% |
91.04% |
N/A |
N/A |
|
[21] |
92.6% |
N/A |
N/A |
N/A |
N/A |
|
[22] |
88.2% |
N/A |
N/A |
N/A |
N/A |
|
[16] |
91.85% |
90.45% |
92.92% |
88.82% |
89.60% |
|
[23] |
88.6% |
83.8% |
91.5% |
N/A |
N/A |
|
Our |
93.82% |
92.25% |
94.80% |
91.67% |
91.96% |
Among the compared methods, Paul et al. [19] reported the highest accuracy (95%), precision (94%), recall (96%), AUC (99%), and F1-score (95%) using a real-time CNN on raw ECG. However, their model’s use of a short 10-second window, while improving granularity, may limit performance on longer segments, as they noted a drop in AUC when extending to 30 seconds, the length used in our model. Wicaksono and Yunanda [15] developed a simple 1D-CNN trained on raw ECG and achieved 88.36% accuracy and an F1-score of 90.49%. The performance gap compared to our model highlights the benefit of multiscale feature extraction and ensemble learning for capturing complex temporal dynamics in ECG signals. Widad et al. [21] proposed a lightweight 1D-CNN architecture with a reported accuracy of 92.6%. However, the absence of detailed metrics such as sensitivity or F1-score limits a comprehensive comparison. Similarly, Yeh et al. [23] applied a filter bank followed by parallel 1D-CNNs and achieved 88.6% accuracy, 92.28% sensitivity, and 91.5% specificity. However, this approach introduces additional preprocessing complexity without yielding proportional performance gains.
Transformer-based models have also shown promise. Li et al. [18] proposed EDSFnet, a hybrid deep-shallow CNN architecture augmented with Effective Channel Attention, achieving 92.6% accuracy. Similarly, Liu et al. [22] combined CNN and Transformers using 3-minute ECG segments, attaining 88.2% accuracy and an AUC of 0.95. Biswas and Yousuf [16] employed a multi-scale 1D-CNN with Transformer blocks, reporting 91.85% accuracy, 90.45% sensitivity, 92.92% specificity, 88.82% precision, and an F1-score of 89.6%. Although these models achieve competitive results, their reliance on self-attention mechanisms increases computational overhead, which may limit their suitability for lightweight or real-time deployment. Furthermore, the use of extended 3-minute input windows, as in the work of Liu et al. [22], may obscure short-term apnea events and introduce latency in detection. Finally, Hossan et al. [20] proposed DeepApneaNet, a cascaded CNN–BiLSTM architecture that achieved 88.61% accuracy, 84.23% sensitivity, and 91.04% specificity. While BiLSTM layers improve long-term temporal modeling, the increased model complexity can raise the risk of overfitting and reduce applicability in lightweight or real-time environments.
The superior performance of MSC-ET can be attributed to the synergy between multiscale feature extraction and the Extra Trees classifier. The multiscale CNN captures temporal patterns at multiple resolutions, while the Extra Trees ensemble leverages randomization in feature selection and tree splits to enhance robustness and reduce overfitting [40]. This combination allows MSC-ET to achieve consistently high accuracy, precision, recall, and F1-score, outperforming other models that rely solely on CNNs, Transformers, or longer input windows [18-23].
4.3 Ablation study
To evaluate the contribution of each component in the proposed MSC-ET model and to justify the selected design choices, a series of ablation experiments was conducted. These experiments aimed to systematically evaluate how variations in the feature extraction and classification components affect model performance, helping to identify the most effective configuration for detecting OSA from ECG signals.
Feature extraction module: To assess the impact of the multiscale CNN-based feature extraction, we developed several model variants with different convolutional kernel configurations. Single-kernel models M11, M21, and M31 used kernel sizes of 3, 15, and 30, respectively. Among these, M31, with the largest kernel, achieved the highest performance among single-kernel models, with an average accuracy of 93.60% and an F1-score of 91.65%. These results suggest that larger convolutional kernels are more effective in capturing relevant temporal patterns associated with apnea events.
Dual-kernel models were then developed to investigate the benefits of multiscale feature extraction. Model M41 used kernels of sizes 3 and 15, M51 used 3 and 30, and M61 used 15 and 30. All dual-kernel models consistently outperformed their single-kernel counterparts, indicating that combining multiple resolutions improves the model’s ability to extract apnea-relevant features. Among these, M41 (3 & 15) achieved the highest dual-kernel performance, with an average accuracy of 93.76% and an F1-score of 91.87%, demonstrating that integrating fine-grained and medium-scale features captures both local details and broader context.
The full MSC-ET model, containing three convolutional branches with kernel sizes 3, 15, and 30, achieved the highest overall performance (accuracy 93.82%, F1-score 91.96%). This confirms that multiscale convolution effectively captures both short- and long-range dependencies in ECG signals, allowing the model to extract the most comprehensive representation of apnea patterns. Detailed results for the feature extraction variants are presented in Table 5.
Table 5. Performance comparison of multiscale CNN variants
|
Model |
Accuracy |
Precision |
Recall |
Specificity |
F1-Score |
|
M11 |
92.73 ± 0.31 |
90.44 ± 0.45 |
90.59 ± 0.51 |
94.05 ± 0.30 |
90.51 ± 0.40 |
|
M21 |
93.57 ± 0.25 |
91.57 ± 0.41 |
91.66 ± 0.37 |
94.76 ± 0.27 |
91.61 ± 0.32 |
|
M31 |
93.60 ± 0.32 |
91.59 ± 0.57 |
91.71 ± 0.65 |
94.77 ± 0.39 |
91.65 ± 0.43 |
|
M41 |
93.76 ± 0.19 |
91.63 ± 0.42 |
92.11 ± 0.11 |
94.78 ± 0.28 |
91.87 ± 0.24 |
|
M51 |
93.66 ± 0.14 |
91.51 ± 0.37 |
91.99 ± 0.23 |
94.70 ± 0.26 |
91.75 ± 0.17 |
|
M61 |
93.61 ± 0.09 |
91.68 ± 0.26 |
91.63 ± 0.35 |
94.84 ± 0.19 |
91.65 ± 0.13 |
|
MSC-ET |
93.82 ± 0.29 |
91.67 ± 0.59 |
92.25 ± 0.47 |
94.80 ± 0.40 |
91.96 ± 0.37 |
Classification module: To evaluate the contribution of the classification module, we replaced the Extra Trees ensemble with a variety of conventional machine learning classifiers. M12, which used a Support Vector Machine (SVM), achieved the best performance among non-ensemble classifiers (accuracy 93.12%, F1-score 90.98%). Simpler classifiers, such as Decision Tree (M32) and Logistic Regression (M22), performed worse, and Naive Bayes (M62) showed the weakest performance (F1-score 76.15%), highlighting its limitations in handling complex, high-dimensional features generated by the CNN.
Table 6. Performance comparison of classification algorithms
|
Model |
Accuracy |
Precision |
Recall |
Specificity |
F1-Score |
|
M12 |
93.12 ± 0.39 |
91.45 ± 0.87 |
90.51 ± 0.28 |
94.74 ± 0.58 |
90.98 ± 0.48 |
|
M22 |
92.06 ± 0.43 |
89.51 ± 0.74 |
89.81 ± 0.70 |
93.46 ± 0.50 |
89.66 ± 0.56 |
|
M32 |
89.66 ± 0.32 |
86.44 ± 0.38 |
86.58 ± 0.51 |
91.57 ± 0.22 |
86.51 ± 0.44 |
|
M42 |
93.57 ± 0.19 |
91.76 ± 0.37 |
91.42 ± 0.37 |
94.90 ± 0.26 |
91.59 ± 0.24 |
|
M52 |
93.63 ± 0.26 |
91.38 ± 0.42 |
92.06 ± 0.49 |
94.61 ± 0.29 |
91.72 ± 0.34 |
|
M62 |
79.07 ± 0.47 |
67.57 ± 0.62 |
87.23 ± 0.94 |
74.01 ± 0.83 |
76.15 ± 0.50 |
|
M72 |
92.91 ± 0.40 |
90.16 ± 0.78 |
91.48 ± 0.37 |
93.80 ± 0.54 |
90.81 ± 0.49 |
|
M82 |
90.72 ± 0.37 |
87.11 ± 0.70 |
88.95 ± 0.51 |
91.83 ± 0.50 |
88.02 ± 0.45 |
|
MSC-ET |
93.82 ± 0.29 |
91.67 ± 0.59 |
92.25 ± 0.47 |
94.80 ± 0.40 |
91.96 ± 0.37 |
Ensemble classifiers demonstrated superior performance. Random Forest (M42) and XGBoost (M52) achieved F1-scores of 91.59% and 91.72%, respectively, confirming the effectiveness of ensemble methods in leveraging multiscale CNN features. Gradient Boosting (M72) and AdaBoost (M82) provided moderate performance with F1-scores of 90.81% and 88.02%, respectively. The detailed classification results for these variants are summarized in Table 6.
Overall, these ablation experiments highlight the importance of both multiscale feature extraction and ensemble classification in achieving high performance. The MSC-ET model, combining a three-branch multiscale CNN with the Extra Trees classifier, consistently achieved the highest accuracy and F1-score across all variants. These results confirm that the proposed configuration effectively balances feature richness and classifier robustness, making it well-suited for accurate and reliable detection of OSA from ECG signals.
This study demonstrates the detection of sleep apnea through ECG signals; however, several important limitations must be acknowledged. While single-lead ECG provides an accessible and noninvasive approach, it may not adequately capture the multifaceted nature of sleep apnea events in the absence of complementary signals such as SpO₂, airflow, or respiratory effort. The model was trained and tested on a single dataset, which limits its generalizability to other patient populations and real-world clinical environments.
Although the multiscale CNN branches enhance classification accuracy, experimental observations indicate that the model requires approximately 3.23 MB of memory for its parameters, while the Extra Trees classifier requires 8.94 MB of memory for its nodes. These computational and memory requirements present practical challenges for wearable and real-time deployment.
Moreover, the limited interpretability of the proposed model may hinder clinical trust and adoption, as healthcare professionals are unable to directly understand the rationale behind its predictions.
Future research should focus on multimodal signal integration, model complexity reduction through pruning and quantization to improve deployment efficiency, and robustness testing via noise simulation or cross-domain evaluation. Additionally, incorporating explainability methods such as SHAP or Grad-CAM could further enhance the model’s clinical relevance, transparency, and acceptance in medical environments
In this study, MSC-ET, a Multiscale Convolutional Neural Network combined with an Extra Trees classifier, was proposed for the automatic detection of OSA using single-lead ECG signals. The use of multiscale kernels significantly enhanced feature diversity by extracting both local and global temporal patterns, while the Extra Trees classifier provided robust and efficient classification. Experimental results demonstrated that MSC-ET achieved strong performance across all evaluation metrics, confirming its effectiveness in segment-level apnea detection.
[1] National Institute of Neurological Disorders and Stroke, Brain Basics: Understanding Sleep. (2025). https://www.ninds.nih.gov/health-information/public-education/brain-basics/brain-basics-understanding-sleep.
[2] Irwin, M.R. (2015). Why sleep is important for health: A psychoneuroimmunology perspective. Annual Review of Psychology, 66(1): 143-172. https://doi.org/10.1146/annurev-psych-010213-115205
[3] Medic, G., Wille, M., Hemels, M.E. (2017). Short-and long-term health consequences of sleep disruption. Nature and Science of Sleep, 9: 151-161. https://doi.org/10.2147/NSS.S134864
[4] Benjafield, A.V., Ayas, N.T., Eastwood, P.R., Heinzer, R., et al. (2019). Estimation of the global prevalence and burden of obstructive sleep apnoea: A literature-based analysis. The Lancet Respiratory Medicine, 7(8): 687-698. https://doi.org/10.1016/S2213-2600(19)30198-5
[5] Kerner, N.A., Roose, S.P. (2016). Obstructive sleep apnea is linked to depression and cognitive impairment: Evidence and potential mechanisms. The American Journal of Geriatric Psychiatry, 24(6): 496-508. https://doi.org/10.1016/j.jagp.2016.01.134
[6] Malhotra, A., Heinzer, R., Morrell, M.J., Penzel, T., et al. (2018). Late breaking abstract-European prevalence of OSA in adults: Estimation using currently available data. European Respiratory Journal, 52(62): OA4961. https://doi.org/10.1183/13993003.congress-2018.OA4961
[7] Luyster, F.S. (2020). Sleep Apnea. In Encyclopedia of Behavioral Medicine, pp. 2055-2056. https://doi.org/10.1007/978-3-030-39903-0_841
[8] Rundo, J.V., Downey III, R. (2019). Polysomnography. Handbook of Clinical Neurology, 160: 381-392. https://doi.org/10.1016/B978-0-444-64032-1.00025-4
[9] de Oliveira Palombini, L., Assis, M., Drager, L.F., de Mello, L.I.L., Pires, G.N., Zancanella, E., Santos-Silva, R. (2024). 2024 position statement on the use of different diagnostic methods for sleep disorders in adults–Brazilian sleep association. Sleep Science, 17(4): e476-e492. https://doi.org/10.1055/s-0044-1800887
[10] He, B., Li, W., Zhang, X., Wu, Y., Liu, J., Brewer, L.M., Yu, L. (2020). The analysis of how apnea influences the autonomic nervous system using short-term heart rate variability indices. Journal of Healthcare Engineering, 2020(1): 6503715. https://doi.org/10.1155/2020/6503715
[11] Moody, G.B., Mark, R.G., Zoccola, A., Mantero, S. (1985). Derivation of respiratory signals from multi-lead ECGs. Computers in Cardiology, 12(1985): 113-116.
[12] Thachayani, M., Loganayagi, M. (2021). Artificial intelligence based classifier for sleep disorder detection using EEG-BCI data. International Journal of Computer Science Trends and Technology, 9(5): 111-114.
[13] Qatmh, M., Bonny, T., Barneih, F., Alshaltone, O., Nasir, N., Al-Shabi, M., Al-Shammaa, A. (2022). Sleep apnea detection based on ECG signals using discrete wavelet transform and artificial neural network. In 2022 Advances in Science and Engineering Technology International Conferences (ASET), Dubai, United Arab Emirates, pp. 1-5. https://doi.org/10.1109/ASET53988.2022.9735064
[14] Ramachandran, A., Pant, A.K., Karuppiah, A. (2021). Performance analysis of machine learning algorithms for sleep apnea detection using ECG. In Smart Trends in Computing and Communications: Proceedings of SmartCom 2021, Las Vegas, Nevada, USA, pp. 485-493. https://doi.org/10.1007/978-981-16-4016-2_45
[15] Wicaksono, P., Yunanda, R. (2024). Deep learning-based sleep apnea detection using single-lead ECG signals from the PhysioNet apnea-ECG database. Communications in Mathematical Biology and Neuroscience, 2024: 110.
[16] Biswas, P., Yousuf, M.A. (2024). Leveraging transformer models for accurate detection of obstructive sleep apnea from single-lead ECG signals. In Proceedings of the 3rd International Conference on Computing Advancements, Dhaka, Bangladesh, pp. 556-563. https://doi.org/10.1145/3723178.3723252
[17] Choudhury, M., Tanvir, M., Yousuf, M.A., Islam, N., Uddin, M.Z. (2025). Explainable AI-driven scalogram analysis and optimized transfer learning for sleep apnea detection with single-lead electrocardiograms. Computers in Biology and Medicine, 187: 109769. https://doi.org/10.1016/j.compbiomed.2025.109769
[18] Li, P., Ma, W., Yue, H., Lei, W., Fan, X., Li, Y. (2024). Sleep apnea detection from single-lead electrocardiogram signals using effective deep-shallow fusion network. Physiological Measurement, 45(2): 025002. https://doi.org/10.1088/1361-6579/ad205a
[19] Paul, T., Hassan, O., Islam, S.K., Mosa, A.S. (2024). Real-time obstructive sleep apnea detection from raw ECG and SPO2 signal using convolutional neural network. AMIA Summits on Translational Science Proceedings, 2024: 662.
[20] Hossan, I., Dip, M.S.S., Kabir, S., Motin, M.A. (2025). DeepApneaNet: A multi-stage CNN-Bi-LSTM hybrid model for sleep apnea detection from single-lead ECG signal. IEEE Sensors Letters, 9(5): 6005804. https://doi.org/10.1109/LSENS.2025.3558675
[21] Widadi, R., Rizal, A., Hadiyoso, S., Fauzi, H., Said, Z. (2024). Obstructive sleep apnea detection based on electrocardiogram signal using one-dimensional convolutional neural network. IAES International Journal of Artificial Intelligence (IJ-AI), 13(4): 4129-4137. http://doi.org/10.11591/ijai.v13.i4.pp4129-4137
[22] Liu, H., Cui, S., Zhao, X., Cong, F. (2023). Detection of obstructive sleep apnea from single-channel ECG signals using a CNN-transformer architecture. Biomedical Signal Processing and Control, 82: 104581. https://doi.org/10.1016/j.bspc.2023.104581
[23] Yeh, C.Y., Chang, H.Y., Hu, J.Y., Lin, C.C. (2022). Contribution of different subbands of ECG in sleep apnea detection evaluated using filter bank decomposition and a convolutional neural network. Sensors, 22(2): 510. https://doi.org/10.3390/s22020510
[24] Vu, T.A., Phuong, D.T.T., Huy, H.Q., Kien, N.P., Huong, P.T.V. (2024). A sleep apnea detection methodology based on SE-ResNeXt model using single-lead ECG. Journal of Biomimetics, Biomaterials and Biomedical Engineering, 64: 85-93. https://doi.org/10.4028/p-Cbr55F
[25] Jiao, M., Song, C., Xian, X., Yang, S., Liu, F. (2024). Deep attention networks with multi-temporal information fusion for sleep apnea detection. IEEE Open Journal of Engineering in Medicine and Biology, 5: 792-802. https://doi.org/10.1109/OJEMB.2024.3405666
[26] Tyagi, P.K., Agrawal, D. (2024). Automatic detection of sleep apnea from a single-lead ECG signal based on spiking neural network model. Computers in Biology and Medicine, 179: 108877. https://doi.org/10.1016/j.compbiomed.2024.108877
[27] Shen, Q., Qin, H., Wei, K., Liu, G. (2021). Multiscale deep neural network for obstructive sleep apnea detection using RR interval from single-lead ECG signal. IEEE Transactions on Instrumentation and Measurement, 70: 1-13. https://doi.org/10.1109/TIM.2021.3062414
[28] Lin, Y., Zhang, H., Wu, W., Gao, X., Chao, F., Lin, J. (2024). Wavelet transform and deep learning-based obstructive sleep apnea detection from single-lead ECG signals. Physical and Engineering Sciences in Medicine, 47(1): 119-133. https://doi.org/10.1007/s13246-023-01346-0
[29] Bhongade, A., Gandhi, T.K. (2025). WIVIDOSA-Net: Wigner–Ville distribution based obstructive sleep apnea detection using single lead ECG signal. Biomedical Engineering Advances, 9: 100159. https://doi.org/10.1016/j.bea.2025.100159
[30] Zhou, Y., Kang, K. (2024). Multi-feature automatic extraction for detecting obstructive sleep apnea based on single-lead electrocardiography signals. Sensors, 24(4): 1159. https://doi.org/10.3390/s24041159
[31] Penzel, T., Moody, G.B., Mark, R.G., Goldberger, A.L., Peter, J.H. (2000). The apnea-ECG database. In Computers in Cardiology 2000, 27: 255-258. https://doi.org/10.1109/CIC.2000.898505
[32] Goldberger, A.L., Amaral, L.A., Glass, L., Hausdorff, J.M., et al. (2000). PhysioBank, PhysioToolkit, and PhysioNet: Components of a new research resource for complex physiologic signals. Circulation, 101(23): e215-e220. https://doi.org/10.1161/01.CIR.101.23.e215
[33] Reddy, P., Valladares, E.M., Akkad, A., Garabet-Diramerian, L., et al. (2017). Acute ECG changes during authentic obstructive sleep apnea and hypopneas in humans. Circulation, 136: A17281-A17281. https://doi.org/10.1161/circ.136.suppl_1.17281
[34] Kalpande, S., Sahu, N.K., Lone, H. (2025). Investigating the generalizability of ECG noise detection across diverse data sources and noise types. arXiv preprint arXiv:2502.14522. https://doi.org/10.1145/3715071.3750402
[35] Clifford, G.D., Azuaje, F. (2006). Advanced Methods and Tools for ECG Data Analysis (Vol. 10). P. McSharry (Ed.). Boston: Artech House.
[36] Lenis, G., Pilia, N., Loewe, A., Schulze, W.H., Dössel, O. (2017). Comparison of baseline wander removal techniques considering the preservation of ST changes in the ischemic ECG: A simulation study. Computational and Mathematical Methods in Medicine, 2017(1): 9295029. https://doi.org/10.1155/2017/9295029
[37] Ajel, R.I., Shati, N.M., Adullatif, F.A. (2025). EEG signal classification in BCI using new evolutionary optimization of instantaneous frequency features. Ingénierie des Systèmes d’Information, 30(7): 1931-1940. https://doi.org/10.18280/isi.300725
[38] Jibon, R.H., Podder, E., Bulbul, A.A.M. (2019). Power line interference removal from ECG signal using different IIR filters. International Journal of Electrical Engineering and Applied Sciences, 2(2): 69-74.
[39] Ladrova, M., Martinek, R., Jaros, R. (2019). Power line interference elimination in ECG signals. Journal of Biomimetics, Biomaterials and Biomedical Engineering, 41: 105-115. https://doi.org/10.4028/www.scientific.net/JBBBE.41.105
[40] Zhang, Y., Yi, J., Chen, A., Cheng, L. (2023). Cardiac arrhythmia classification by time–frequency features inputted to the designed convolutional neural networks. Biomedical Signal Processing and Control, 79: 104224. https://doi.org/10.1016/j.bspc.2022.104224
[41] Geurts, P., Ernst, D., Wehenkel, L. (2006). Extremely randomized trees. Machine Learning, 63(1): 3-42. https://doi.org/10.1007/s10994-006-6226-1
[42] He, K., Zhang, X., Ren, S., Sun, J. (2015). Delving deep into rectifiers: Surpassing human-level performance on ImageNet classification. In Proceedings of the IEEE International Conference on Computer Vision, Santiago, Chile, pp. 1026-1034. https://doi.org/10.1109/ICCV.2015.123
[43] Adam, K.D.B.J. (2014). A method for stochastic optimization. arXiv preprint arXiv:1412.6980, 1412(6): 6628106.