B. Sivaranjani*![]() | S. Karpagavalli
| S. Karpagavalli![]()
© 2025 The authors. This article is published by IIETA and is licensed under the CC BY 4.0 license (http://creativecommons.org/licenses/by/4.0/).
OPEN ACCESS
Birds play a crucial role in monitoring environmental quality, species diversity and biodiversity detection, thereby aiding in the rare and endangered species conservation. Early detection of declining bird species allows timely intervention to protect them, enabling conservation measures to preserve crucial habitats. Various methods have been developed for the bird species identification. However, some models struggle to solve the image intensity problem, failing to focus on micro (low-level) features due to lighting conditions and faces issues in handling small bird regions of interest (ROI). In this paper, twofold pathway hierarchy structure and ROI refinement model are proposed to enhance low-level depiction of attributes and effectively locate distinct areas for efficient bird species detection. This network uses the feature pyramidal network (FPN) to create a twofold pathway hierarchy that follows up-down feature route and bottom-up attentional route to produce the pyramidal features and pyramidal attentions. Thus, region proposal generator (RPG) employs an Adaptive Non-Maximum Suppression (ANMS) operation on pyramidal attentions to produce distinct ROI with adaptive dimensions, facilitating the network's localization of critical areas. ROI refinement is performed on micro features using dropblock, which removes the most distinct areas identified from small-scaled ROIs, while the merge block procedure identifies the principal regions consolidated from all ROIs. Finally, the filtered feature maps will be fed into the fully connected (FC) layer of Inception-ResNet-v2 is to utilize both contextual and intricate data to enhance the effectiveness of bird species classification. The complete proposed work is named as Enhanced class attention based deep bird species detection network (ECADepBnet). Finally, the test result shows that the suggested model achieves 95.95% accuracy on Indian-Birds-Species-Image-Classification dataset which is 29.16%, 22.17%, 15.79%, 11.89%, 8.33% and 3.72% higher than DenseNet201, EfficientNetB5, VGG19, Hyperparameter Optimization Scheme (HHOS) with EfficientB0, Inception-ResNet-v2 and CADepBnet.
bird species, Non-Maximum Suppression, region of interest (ROI), feature pyramidal network (FPN), twofold pathway hierarchy
Naturally, birds act as proxies for environmental quality indicators to track changes over time. Birds are simple to see in field surveys and are very vulnerable to environmental change [1]. Scientists often look to bird populations as a surrogate for environmental quality and species richness [2]. Some examples include recording changes in bird populations to monitor environmental changes [3], following birds' migratory patterns to monitor climate change [4], and counting bird species to detect biodiversity [5, 6]. Identifying bird species is crucial for protecting endangered and rare bird populations. Despite the continued importance of experts in bird taxonomy, it is very costly and time-consuming to construct a list of species or diversity index from a single site [7]. Identifying the right bird species is also crucial for knowing which birds are in a given photo. Uncertainty and higher expenses have ensued because of the growing difficulty of bird species identification. A robust system that processes bird data on a massive scale that acts as an information block for ornithologists, government agencies and others must be in place for different location occurrences [8].
Images, audio, or video may usually be employed for bird identification. Unfortunately, mixed sounds like insects and other real-world items in the frame make it difficult for the audio or video processing technique to properly detect birds [9, 10]. Therefore, most academics think that images are the efficient way than sound or video when trying to identify different kinds of birds [11]. Because it divides the gathered images into smaller groups within the bigger category, Fine-Grained Image Analysis (FGIA) plays a significant role in bird categorization [12]. To effectively identify bird species, image processing technologies are used to either enhance images or extract useful information from them [13]. The technique involves processing signals, with recorded bird images serving as the input and potentially producing an image or associated attributes as the output. The image processing approach determines the enhanced or fine-grained images features [14]. However, FGIA is still difficult since there is minimal variation across classes and a lot of variation within them. Automatic bird species detection might also greatly speed up identification task.
Recently, DL models have been used to automatically identify and categorize bird species from captured images [15]. Typically, DL algorithms efficiently train large training samples, learning complex features within hidden layers, enhancing prediction and classification of large-scale bird data, aiding ornithologists, researchers and authorities [16]. Numerous DL-based models for classifying bird species have been developed recently. For example, TL-based models such as Inception-ResNet-v2 were used to categorize endemic bird species [17]. Images of endemic bird species were converted into features using the Inception-ResNet-v2 model, and these features were then sent to a target network for training. A multi-layered neural network model was then built to categorize these images. However, this approach fails to capture class-specific areas for a substantial number of species. For bird subcategories, FGIA uses discriminative feature representation and spatial localization; nevertheless, because semantic qualities may entangle, little research has been done on extracting category-aware features.
For this, Class Attention based Deep Bird species detection network (CADepBnet) was designed [18] to segregate the bird’s sub-categories and identify various bird species under the same super-category. A non-parametric feature regularization technique called adaptive graphs of target relations (AGTR) used for deep representation learning categorization. This model employs online center loss class representations to reduce variance and identify class relationships, while utilizing semantic interpolation-based data augmentation to generate more turning images from random input images. AGTR was constructed using training weights and features, is integrated into Inception-ResNet-v2 as a Class Attention Layer (CAL), class-wise feature map and spatial pooling for bird label prediction. However, this model struggles to predict small bird ROI and lacks to discriminate micro and macro features due to changes in lighting conditions of the training and testing images, affecting their images intensity level. Certainly, low background significantly decreases the accuracy of retrieving micro features in bird images.
To address this issue, ECADepBnet model is created to overcome the aforementioned problems to effectively identify bird species. The class-specific region bird images from CADepBnet [18] will be fed into twofold pathway hierarchy structure and ROI refinement model to determine the refined features. These twofold pathway hierarchy structure and ROI refinement model are proposed to enhance low-level depiction of attributes and effectively locate distinct areas. In twofold pathway hierarchy structure, pyramidal features and pyramidal attentions are generated from FPN using two-fold pathway structures like up-down feature route and bottom-up attentional route assigned from the input images. In order to extract characteristics on various dimensions, FPN serves as the foundational top-down structure. While a top-down feature highway moves contextual information from high to low levels, a bottom-up attention pathway uses spatial/channel attention techniques to capture low-level information and move it to the top.
Then, in order to reduce redundancy and preserve the visual integrity of the images, an ANMS procedure is used in conjunction with RPG, or region proposal network (RPN), to construct discriminative ROIs of compatible sizes. Motivated by the RPN idea, the spatial attention masks are considered anchor scores rather than multi-scale feature maps for finding the discriminative regions in the pictures. By assigning anchor suggestions with a single size and aspect ratio to each pyramidal level based on its convolutional receptive field, the approach makes it possible to localize significant locations. ROI on low-level features is then refined using the ROI dropblock and ROI merge block methods. The ROI dropblock eliminates the most discriminative areas selected from small-scaled ROIs, whereas the ROI-merge block operation discovers the major regions combined from all ROIs. Lastly, the FC layer of Inception-ResNet-v2 in CADepBnet will receive the refined feature maps from the ROI refinement model and double pathway hierarchy structure. This will allow the network to use both the intricate and contextual data to improve classification accuracy. This model intends to address the intensity problem due to different lighting conditions and handling small bird images for effective bird species prediction.
The following are the upcoming sections of this article: Related works are given in Section II. The suggested approach is explained in more detail in Section III, and its efficacy is demonstrated in Section IV. The entire study is summed up in Section V, which also looks at future directions.
A Deep CNN (DCNN) model [19] was developed for bird species classification model. In this model, image was converted to grayscale and DCNN was applied for bird species prediction. A rating table was created after evaluating multiple data entry points enabling the highest rating to predict bird species for swift identification. Consecutively, this model results in lower convergence speed.
A dual TL model and spatial pyramid pooling [20] was developed to improve seabird image classification tasks. They used InceptionV3 and DenseNet201 as feature extractors, concatenated outputs using a SPP layer and applied global average and max-pooling methods to SPP output. However, this model faced overfitting issues due to imbalanced data.
A DCNN model [21] was introduced for bird species identification using MobileNet V2 as a feature extractor. This model had a frozen convolutional layers and weights not trained. The extracted features were reduced in the Flatten layer before classification. A web application was introduced to compare the model's output and upload bird images, verifying bird species categories.
An automatic bird species detection method [22] was developed using CNN models. Pre-processed images and audio were extracted through the Gabor filtering approach. The pre-trained CNN models like ResNet50V2 and EfficientNetB0 were constructed on a dataset containing various bird species images. On the other hand, this model provides lower results on larger image samples.
A TL-CNN structure [23] was constructed to classify the bird images for recognizing the species types. Initially, the dataset was collected and pre-processed to improve the different dimensions of images. The TL models like ResNet152V2, InceptionV3, DenseNet201 and MobileNetV2 were used to classify the bird images to recognize the different species. Among other models, DenseNet201 provides efficient results with less loss of information. However, the training time of this model was high.
A VGG19 model [24] for the bird species prediction based on feature analysis. Initially, Gaussian filtering was used to pre-process the images. VGG-19 network was utilized to retrieve the features from these previously processed images. For final identification and classification, FC was used. However, because the sample image size varies depending on the viewpoint, this result was not consistent.
A fine-grained bird categorization model was suggested using attention and decoupled knowledge distillation (DKD) [25]. The model acquired object images and key bird features, learning and distinguishing fine features. The localization-recognition method predicted bird categories using finer features, reducing background noise. However, the model's performance was limited due to its need for preconfigured configuration with specific window size and hyper-parameters configuration.
A TL model [26] was suggested for an efficient bird classification. In this method, a dataset with large number of bird species was augmented using various transformations to the original images. Then, the convolutional and pooling layers of InceptionV3 and VGG19 were employed to extract important patterns and the softmax for different bird species identification. However, as the sample image size varies for various viewpoints, insufficient results were found.
An automatic recognition system for bird species was developed [27] using images incorporating feature enhancement and contrastive learning techniques. A diverse feature fusion module was integrated to systematically collect information from bird images across different sizes and perspectives. An attention feature enhancement module was integrated to mitigate noise and occlusion in images. The Siamese network was utilized to identify similarities within the same class and distinguish differences between different bird species. But it lacks interspecific commonalities across bird species, which leads to a significant error rate.
A TL with hybrid hyperparameter optimization scheme (HHOS) was devised [28] for accurate bird species prediction. Initially, pre-trained EfficientB0 model were chosen and new custom layers were added to them. The models were then retrained using feature extraction and fine-tuning procedures using HHOS to create various classifiers for bird species prediction. However, background image details need to be optimized significantly intends to information loss and lower performance.
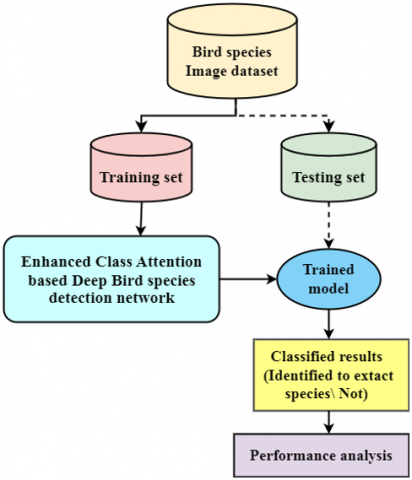
In this section, the proposed ECADepBnet completely is illustrated. Figure 1 displays the block structure of the proposed framework.
3.1 Dataset description
The "Indian-Birds-Species-Image-Classification" dataset [29] contains images of 25 bird species native to India. Some includes Indian Peacock, Cattle Egret, Kingfisher and so on. The dataset consists of 37000 JPEG images with 1500 images representing each species. The original images vary in resolution from approximately 300 × 300 to 1024 × 1024 pixels and for model training they were uniformly resized to 224 × 224 pixels. They were captured under diverse natural lighting conditions, including bright sunlight, overcast skies, and shaded environments and exhibit backgrounds of varying complexity such as dense foliage, open skies, water bodies, and urban settings. This collection can be used for image-classification tasks and to develop machine-learning models for recognizing different bird species found in India [29].
Figure 1. Block structure of the proposed model
3.2 AGTR and CAL
Initially, it is vital to determine the sub-class of birds from their same super categories in the bird species detection. For this, AGTR and CAL from CADepBnet [18] are used to differentiate the bird's sub-categories and recognize numerous bird spices quickly. AGTR is used to tie features to labels. Class-specific feature maps are created from CAL.
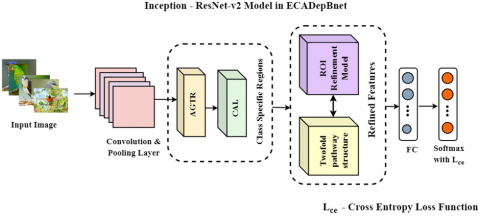
This class- specific region (images) will be fed as input to the ECADepBnet to handle the small ROI of birds and image-intensity issues effectively. ECADepBnet is a dual-phase model that uses rough full images (sub-class regions) as input and outputs the refined features from classifiers which will be fed into FC layer of Inception-ResNet-v2 for bird species identification. Figure 2 presents the pipeline of ECADepBnet model for the different bird species prediction.
In this section, ECADepBnet constitutes two pathway structure and ROI refinement model to extract refined features for bird species detection which are briefly illustrated in below sections. Both phases use identical settings to extract data from the same network, making them directly comparable.
Figure 2. Pipeline of proposed ECADepBnet model
3.3 Two-fold pathway hierarchy structure
The main objective of this two-fold pathway structure includes both semantic and detailed information from the collected images to improve bird species prediction performance. A two-fold pathway structure is used to enhance feature representations by integrating a top-down feature pathway with a bottom-up attention pathway. To build the bottom-up pathway, spatial/channel attention processes work in tandem with FPN, which serves as the underlying top-down framework for feature extraction at different scales. Specifically, convolutional neural networks (CNNs) use sets of convolutional blocks, where each block's output feature maps are represented by $\left\{Y_1, Y_2, \ldots, Y_k\right\}$, where k is the number of blocks. The bird species prediction task is hindered by the lack of specific information in $Y_n$, which is why it will be the final feature map for classification. Despite its strong semantics, it fails to provide enough information. To solve this, FPN is employed to retrieve extract features on different scales to improve prediction task.
3.3.1 Feature pyramidal network (FPN)
In this two-fold pathway hierarchy structure, FPN employs a combination of up-down feature learning and bottom-up attentional pathways for improved deep semantic and shallow detailed image classification. FPN selects part of these features and produces ![]() according to feature hierarchy $\left\{f_1, f_{N+1}, \ldots, f_{n+N+1}\right\}$ $(1 \leq n \leq n+N-1 \leq k)$ by performing a top-down pathway while $Y_{n+N+1}$ as it generates semantically strong feature maps from higher to lower pyramid levels while up sampling spatially grossed images and adjacent associations among respective feature levels i.e., $Y_r \rightarrow f_r(r=n, n+1, \ldots., n+N+1)$ are considered to preserve the backbone information. These attributes aid in locating samples on various sizes enhancing bird species classification by highlighting subtle differences in objects from various image region and scales.
according to feature hierarchy $\left\{f_1, f_{N+1}, \ldots, f_{n+N+1}\right\}$ $(1 \leq n \leq n+N-1 \leq k)$ by performing a top-down pathway while $Y_{n+N+1}$ as it generates semantically strong feature maps from higher to lower pyramid levels while up sampling spatially grossed images and adjacent associations among respective feature levels i.e., $Y_r \rightarrow f_r(r=n, n+1, \ldots., n+N+1)$ are considered to preserve the backbone information. These attributes aid in locating samples on various sizes enhancing bird species classification by highlighting subtle differences in objects from various image region and scales.
Moreover, the structure of FPN is improvised by adopting a supplementary attention hierarchy $\left\{A t t_1, A t t_{N+1}, .., A t t_{n+N+1}\right\}$ on the pyramidal features consisting of pyramidal spatial attention and pyramidal channel attention. The pyramidal spatial attentions $\left\{A t t_n^{(S)}, A t t_{n+1}^{(S)}, \ldots, A t t_{n+N-1}^{(S)}\right\}$ assist to localize the discriminate regions from various scales. The pyramidal channel attentions $\left\{A t t_n^{(C)}, A t t_{n+1}^{(C)}, \ldots, A t t_{n+N-1}^{(C)}\right\}$ contain channel correlations to deliver local information from lower to higher pyramid levels via an additional bottom-up pathway.
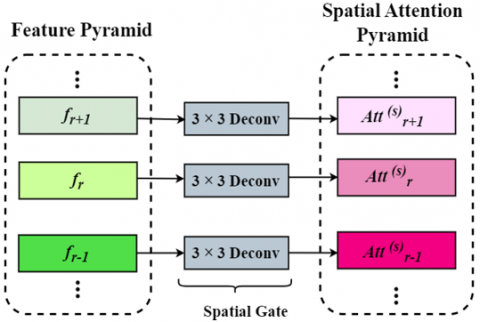
Spatial Gate and Spatial Attention Pyramid: Every building block in the pyramid spatial attentions is regarded as input and generates spatial attention mask $A t t_r^{(S)}$. To extract spatial information, each feature map $f_r$ passes a 3 × 3 deconvolution layer with one output channel separately. Figure 3 shows the structure of spatial attention pyramidal. Each element of the spatial attention mask $A t t_r^{(S)}$ is then normalized to the interval (0,1) indicating spatial significance as in Eq. (1):
$A t t_r^{(S)}=\sigma\left(K_c * f_r\right)$ (1)
In above Eq. (1), σ and * devised a sigmoid function and deconvolution operation. $K_c$ is the convolution kernel. In consequence, spatial attention pyramid $A t t_n^{(S)}, A t t_{n+1}^{(S)}, \ldots, A t t_{n+N-1}^{(S)}$ supplied using multi- scale feature maps. Then, the channel attention pyramid then contains these spatial activations for creating the picture ROI pyramid and doing additional feature refining.
Figure 3. Spatial attention pyramid
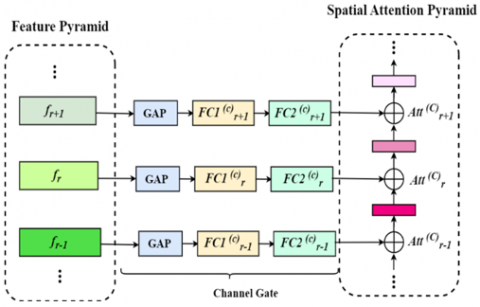
Channel attention pyramid and Gate: By using global average pooling (GAP) and two FC layers, the Channel attentions $\left\{A t t_n^{(C)}, A t t_{n+1}^{(C)}, \ldots, A t t_{n+N-1}^{(C)}\right\}$ are obtained from matching feature maps in the feature pyramid [30]. Eq. (2) presents the channel attention mask.
$A t t_r^{(C)}=\sigma\left(\mathcal{W}_2 . \operatorname{ReLU}\left(\mathcal{W}_1 . {GAP}\left(f_r\right)\right)\right)$ (2)
${GAP}\left(f_r\right)=\frac{1}{\mathcal{W} \times \mathcal{H}} \sum_{u=1}^{\mathcal{H}} \sum_{v=1}^W f_r(u, v)$ (3)
In Eq. (3), (.) denotes element-wise multiplication. GAP is the Global Average Pooling. $\mathcal{W}$ and $\mathcal{H}$ represent the spatial dimensions of $f_r$. $\mathcal{W}_1$ and $\mathcal{W}_2$ are the weight matrices of two FC layers. A bottom-up flow of precise information across pyramid levels is made possible by the channel-attention mechanism in this framework, which differs from the spatial attention pyramid in that it is intended to extract fine-grained, low-level stimuli and gradually transfer them upward via the hierarchy. Figure 4 illustrates the details of channel attention pyramid model.
Figure 4. Channel attention pyramid
Integrating two attention pyramids: The learned spatial and channel attention pyramids are employed to weights the features $f_r$ and obtain the resultant $Z_r$ for bird species categorization which is devised in Eq. (4):
$Z_r=f_r .\left(A t t_r^{(S)} \oplus A t t_r^{(C)}\right)$ (4)
In Eq. (4), ⊕ denotes the addition function utilizing propagated interpretation. Solely classifiers with a GAP layer and two FC layers are established to get final predictions.
3.3.2 Region pyramidal network (RPN)
RPN is also termed as RPG applied on the collected images to broadly employed for visual detection structure that identifies potential informative regions.
Recent approaches employ single-scale or multi-scale convolutional feature maps with anchors of diverse pre-defined scales and aspect ratios to encompass objects of varying forms within images [31, 32]. RPN is a class-independent object detector utilizing a sliding-window approach. This evaluates small subnetwork on dense with 3 × 3 sliding windows by utilizing single scale convolutional feature map for object\non-object binary categorization and bounding box regression. The network head constitutes 3 × 3 convolution layer and 1 × 1 convolutions for classification and regression.
The object and non-object criteria, along with the bounding box regression target, are identified through the use of anchors. Anchors possess multiple pre-established scales and aspect ratios to suit diverse shapes. RPN is implemented by replacing the single-scale feature map with FPN. The analogous architecture (3 × 3 convolution and two corresponding 1 × 1 convolutions) is allocated to each level of the feature pyramid. Due to the head's comprehensive movement across all places at every pyramid level, the implementation of multi-scale anchors at a specific level is unnecessary. Instead, anchors of a uniform scale are allocated to each level of the pyramid.
Figure 5. Integration of RPG with ANMS
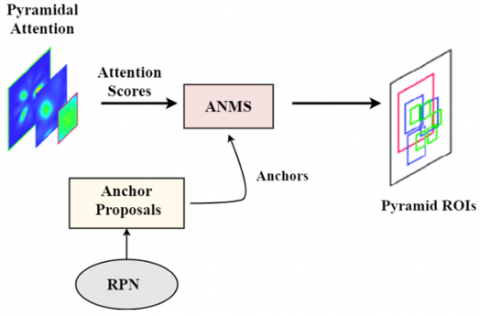
Figure 5 illustrates the RPG with the ANMS architectural paradigm. In Figure 5, RPG identifies the region suggestions with elevated response values on their respective attention maps. Subsequently, it employs ANMS to eliminate redundant ideas and consolidate those that are highly connected.
According to the RPN approach, the spatial attention masks will function as anchor scores instead of multi-scale feature maps to identify discriminative regions supervised manner. In this approach, anchor proposals are assigned a uniform scale and aspect ratio at each pyramidal level based on their convolutional receptive field. Subsequently, ANMS will be implemented on the evaluated proposals to minimize redundancy by removing excessively covered image areas and preserving visual integrity by consolidating related proposals to identify the increased discriminative regions within the images. Algorithm 1 illustrates the ANMS methodology.
Algorithm 1: Adaptive Non-Maximum Suppression
Input: Number of anchor boxes in RPN $\mathcal{A} \mathcal{B}=\left\{a b_1, \ldots, a b_n\right\}$; Corresponding attention scores $\mathcal{S}=\left\{s_1, \ldots, s_n\right\} ;$ division threshold $\mathrm{TD}_{\text {divi }}$ and combination threshold $\mathrm{TD}_{\text {comb}}$.
Output: $\mathcal{A} \mathcal{B}_{\mathrm{NMS}}$
3.4 Region of interest (ROI) refinement model
Unlike the soft mechanism that establishes a threshold on the attention maps, the proposed ROI refinement model may precisely identify several discriminative regions in images of various bird species. For each pyramid stage r, the top $-\delta_r$ information regions $J_r=\left\{j_{r, 1}, j_{r, 2}, \ldots, j_{r, \delta_r}\right\}$ are utilized with the RPG, subsequently forming the region pyramid $J_{R P}=\left\{j_n, j_{n+1}, \ldots, j_{n+N+1}\right\}$. Consequently, the ROI pyramid is initially constructed in its raw form, followed by the application of ROI refinement stages, specifically the ROI dropblock and ROI-merge block operations, on the pyramid's bottom features $Y_n$ to enhance performance in the refined stage for identifying effective image intensity features for bird species classification.
3.4.1 ROI dropblock
A dropblock technique involves randomly removing continuous sections from feature maps to eradicate semantic information, hence compelling the network to adapt and learn from the remaining units. The dropblock technique is utilized to mitigate overfitting in the proposed avian classification model, given that each species is represented by a finite number of photos. In this model, the ROI union ($J_x$) is arbitrarily chosen from $J_{R P}(n \leq x \leq n+N-1)$ with probabilities $\mathcal{P}=\left\{p_n, p_{n+1}, \ldots., p_{n+N+1}\right\}$. Additionally, an informative region $j_x \in J_x$ will be randomly allocated with equivalent probability from the chosen $J_x$ regions. Subsequently, $j_x$ is adjusted to match the sampling rate of $Y_n$ and a drop mask $\chi_m$ is generated by nullifying activations within the ROI region, as delineated in Eq. (5):
$\chi_m(u, v)= \begin{cases}0, & (u, v) \in j_x 0 \\ 1, & { otherwise }\end{cases}$ (5)
The dropped feature maps $d_n$ are determined by associating the mask with the low-level features $Y_n$ with the normalization as in Eq. (6):
$d_n=Y_n \times \chi_m \times C\left(\chi_m\right) \times C_{\text {ones }}\left(\chi_m\right)$ (6)
In Eq. (6), C represents the count, $C(.)$ and $C_{{ones }}$ denotes the total number of elements and the count of elements with a value of one, respectively.
In this work, the ROI dropblock was configured with a fixed drop ratio of 0.1 that is 10% of the selected ROI area masked per each training iteration. Each dropped region was a contiguous 7 × 7 block sampled uniformly at random within the selected ROI. For region selection, a uniform random sampling strategy was used where candidate ROI regions were sampled with equal probability. These hyperparameters were chosen after a small grid search (drop ratios 0.05-0.2), with the selected values yielding the best validation accuracy.
This ROI dropblock improves accuracy by directly removing the informative component prompting the network to identify more discriminative areas. This dropblock refinement only conducted during training and skipped during testing.
3.4.2 ROI merge block function
To learn the input image's lowest bounding rectangle in a weekly supervised manner, the ROI from every level of the pyramid is incorporated. The ROI merge bounding operation is defined as:
$T_{a_1}=min \left(\forall a \in J_x\right) ; T_{a_2}=max \left(\forall a \in J_x\right)$ (7)
$T_{b_1}=min \left(\forall b \in J_x\right) ; T_{a_2}=max \left(\forall b \in J_x\right)$ (8)
In above Eq. (7) and Eq. (8), $\left[T_{a_1}, T_{a_2}, T_{b_1}, T_{b_2}\right]$ is denoted as the combined bounding rectangles' lowest and highest coordinates respectively, in terms of the a and b axes. Next, the area removed from feature maps $d_n$ that were dropped are retrieved and amplify it to the similar dimension $d_n$ to obtain the merge bounded features $M B_n$ as given in Eq. (9):
$M B_n=\varphi\left(d_n\right)\left[T_{b_1}: T_{b_2}, T_{a_1}: T_{a_2}\right]$ (9)
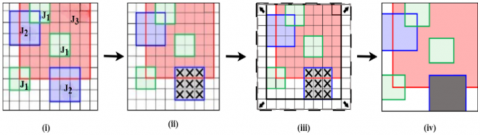
where the bilinear up sample operation is denoted by $\varphi$. For the final bird species categorization, the fully connected layer of Inception-ResNet-v2 receives the refined characteristics $M B_n$. The ROI refinement model is demonstrated in Figure 6. In Figure 6, (i) a low-level feature map $Y_n$ is presented with ROI pyramid $J_{R P}$ as $J_1, J_2$ and $J_3$ for instances; (ii) ROI- Dropblock; (iii) ROI-merge block operation; and (iv) a refined feature map $M B_n$ with background noise removed and local areas masked. The gray rectangle denotes the dropped region, while the other coloured rectangles indicate different levels in the pyramidal system. Algorithm 2 illustrates the framework of ROI Refinement Model.
Algorithm 2: ROI Refinement Model
Input: ROI pyramid $\mathrm{J}_{\mathrm{RP}}=\left\{\mathrm{j}_{\mathrm{n}}, \mathrm{j}_{\mathrm{n}+1}, \ldots ., \mathrm{j}_{\mathrm{n}+\mathrm{N}+1}\right\}$; micro features map $\text{Y}_\text{n}$; Selection probability for dropout candidates $\mathcal{P}$ is equal to $\left\{\mathrm{p}_{\mathrm{n}}, \mathrm{p}_{\mathrm{n}+1}, \ldots., \mathrm{p}_{\mathrm{n}+\mathrm{N}+1}\right\}$;
Output: Refined Feature Maps $\mathrm{MB}_{\mathrm{n}}$;
Figure 6. ROI refinement model
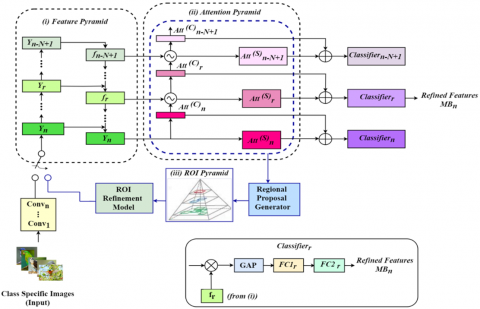
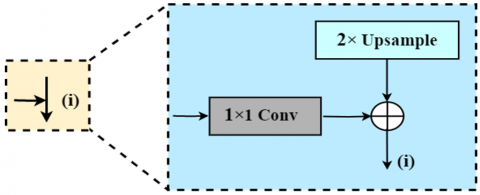
In order to illustrate the improved micro features and identify discriminative areas, Figure 7 depicts the integration of two-fold route hierarchy with the ROI refinement model. The refining procedure, which is carried out on the low-level features $Y_n$, depicted in the blue flow in Figure 7. Additionally, the channel/spatial attentions are highlighted in pink hues, while the feature maps are indicated in green hues. Broadcasting addition is represented by ⨁, while element-wise multiplication is represented by ⨂. The structure of the top-down is illustrated in Figure 8 and bottom-up routes and Figure 9 respectively.
Figure 7. Integration of two-fold pathway hierarchy and ROI refinement model
Figure 8. Top-Down feature route
Figure 9. Bottom-Up attentional route
3.5 Inception-ResNet-v2 for bird species classification
The refined features from the refined feature maps from twofold pathway hierarchy structure and ROI refinement model will be fed into the FC layer of Inception-ResNet-v2 in CADepBnet to employ both contextual and intricate data to enhance classification performance.
Algorithm 3 illustrates the ECADepBnet model for the different bird species prediction.
Algorithm 3: ECADepBnet model for the different bird species prediction
Input: Collected different bird images.
Output: Improvising micro features and locating discriminative regions.
Step 1: Collected class specific region of images from the CADepBnet [18].
Step 2: Input the features into twofold pathway hierarchy structure and ROI refinement model.
Step 3: Twofold pathway hierarchy structure utilizes FPN to produce pyramidal features and attentions using top-down feature and bottom-up attentional route.
Step 4: FPN utilizes base top-down structure for feature extraction and spatial/channel attention mechanisms to construct the bottom-up route.
Step 5: RPG with ANMS function is employed to generate discriminative ROIs and preserving visual integrity of images.
Step 6: ROI refinement is performed on shallow attributes using ROI dropblock and ROI merge block operation.
Step 7: ROI dropblock eliminates the most distinct areas from small-scaled ROIs.
Step 8: The ROI-merge block procedure identifies the key areas combined from all ROIs.
Step 9: Refined feature maps are obtained from the twofold pathway hierarchy structure and ROI refinement model.
Step 10: Refined feature is fed into the FC layer of Inception-ResNet-v2 in CADepBnet.
Step 11: This leverages both the contextual and intricate data for bird species prediction.
Thus, this model addresses image intensity problem and enhances the feature representation of micro (low-level) features and accurately locating discriminative regions for the effective bird species prediction.
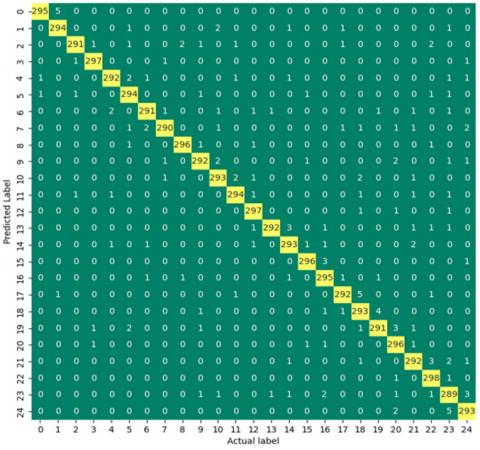
In this part, the efficiency of the ECADepBnet is examined by implementing it in Python 3.7.8 using the Indian-Birds-Species-Image-Classification dataset which is discussed in Section 4.1. For the experimental purposes, 80% (1200) of images are taken for training and 20% (300) are taken for testing. The confusion matrix for the proposed model is depicted in below Figure 10. Table 1 depicts the hyperparameter settings of the proposed model.
The following evaluation metrics are measured to compare the proposed and existing models:
Accuracy: It is the proportion of exact recognitions among the overall instances (bird species) tested.
$Accuracy=\frac{T P+T N}{T P+T N+F P+F N}$ (10)
TP denotes the number of bird species properly recognized as the target species.
TN reports the amount of bird species accurately recognized as non-target bird species.
FP denotes the number of bird species that have been mistakenly recognized as the target bird species.
FN is defined as the number of bird species that have been mistakenly recognized as not being the target bird species.
Precision: It refers to the proportion of correctly identified bird species (TP) out of all species predictions made by the model including those that were incorrect (FP).
$Precision=\frac{T P}{T P+F P}$ (11)
Recall: It represents the fraction of correctly identified bird species instances (TP) including those the model failed to detect (FN).
$Recall=\frac{T P}{T P+F N}$ (12)
F-measure: It is the harmonic average of precision and recall.
$F-measure=\frac{2 \times { Precision × Recall }}{ { Precision }+ { Recall }}$ (13)
Table 1. Hyperparameter settings
|
Hyperparameter |
Values |
|
Top-down up sampling in FPN |
2 × nearest-neighbour |
|
Channel-attention reduction ratio |
16 |
|
Spatial-attention kernel size |
7 × 7 |
|
Anchor size in RPN |
32 pixels (per pyramid level) |
|
ANMS IoU threshold |
0.5 |
|
Drop ratio (RPN drop block) |
0.10 (10 % of selected ROI area) |
|
RPN Drop block size |
7 × 7 (feature-map pixels) |
|
Region selection |
Uniform random |
|
Upsampling |
Bilinear, factor 2 |
|
Fully connected units |
256 |
|
Optimizer |
Adam |
|
Learning rate |
1 × 10⁻⁴ |
|
Batch size |
32 |
|
Epochs |
100 |
|
Loss function |
Categorical cross-entropy |
|
Early stopping |
10 epochs |
Figure 10. Confusion matrix for the proposed model
4.1 Comparison of the suggested model and benchmark models
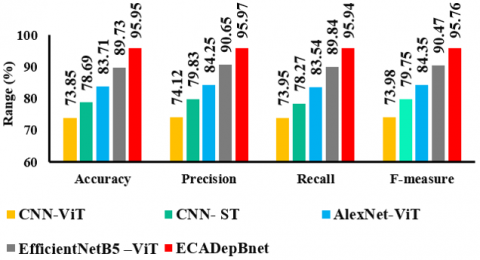
In this section, the comparative analysis is carried out between proposed ECADepBnet model and the standard models like CNN-ViT, CNN- Swin Transformer (ST), AlexNet-ViT and EfficientNetB5 -ViT. All these standard models are evaluated on benchmark dataset in section 3.1.
Figure 11. Comparison of proposed model and standard models
Figure 11 depicts the comparison of the proposed and standard models in terms of accuracy, precision, recall and f-measure. It can be observed that the accuracy of the proposed ECADepBnet model surpasses that of CNN-ViT, CNN-ST, AlexNet-ViT and EfficientNetB5-ViT by 29.93%, 21.93%, 14.62%, and 6.93%, respectively. In terms of precision, ECADepBnet outperforms the same models by 29.48%, 20.22%, 13.91%, and 5.87%. When comparing recall, the ECADepBnet model shows an improvement of 29.74%, 22.58%, 14.84%, and 6.79% over same models, respectively. Finally, ECADepBnet's F-measure is higher by 29.44%, 20.08%, 15.53%, and 5.85% compared to the other models. The proposed ECADepBnet model outperforms standard models by addressing image intensity issues and effectively refining small ROI for bird species detection.
4.2 Analysis of proposed model and state-of-art models
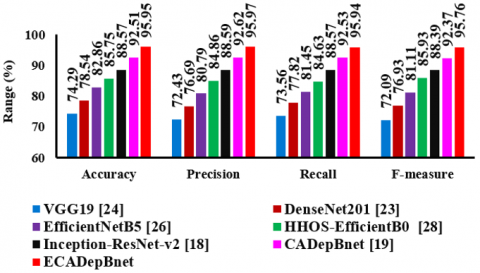
In this section, the comparative analysis is carried out between proposed ECADepBnet model and the existing models like DenseNet201 [23], VGG19 [24], EfficientNetB5 [26], HHOS-EfficientB0 [28], Inception-ResNet-v2 [18] and CADepBnet [19]. All these existing models are evaluated on benchmark dataset in section 3.1.
Figure 12 depicts the comparison of the proposed and existing bird species recognition models in terms of accuracy, precision, recall and f-measure. It can be seen that the accuracy of the proposed ECADepBnet model is increased by 29.16%, 22.17%, 15.79%, 11.89%, 8.33% and 3.72% compared to the VGG19, DenseNet201, EfficientNetB5, HHOS-EfficientB0, Inception-ResNet-v2 and CADepBnet models, respectively. The precision of the ECADepBnet model is 32.51%, 25.14%, 18.79%, 13.09%, 8.33% and 3.62% higher than the same models respectively. The recall of the ECADepBnet model is 30.42%, 23.28%, 17.79%, 13.36%, 8.32% and 3.69% higher than the same models, respectively. The f-measure of the ECADepBnet model is 32.83%, 24.48%, 18.06%, 11.44%, 8.34% and 3.67% higher than the same models, respectively. It is clear from these results that the ECADepBnet model can improve the recognition accuracy of bird species prediction by effectively addressing the image intensity issues by effectively handling small ROI of birds, retrieving the low-level information and refining discriminative regions in the collected images for an effective bird species prediction.
Figure 12. Comparison of proposed and existing bird species recognition models
4.3 Ablation study
Table 2 depicts the comparison of ECADepBnet with its baseline (Inception-ResNet-v2) and different ablated variants, highlighting the individual model contributions. The ablation study on different variants demonstrates that both the twofold pathway and ROI refinement modules independently improve the baseline performance, while their combination in ECADepBnet yields the highest accuracy, precision, recall and F-measure. This confirms that the modules are complementary, with the twofold pathway enhancing multi-scale feature representation and ROI refinement strengthening the localization of discriminative regions, together ensuring robust bird species classification.
Table 2. Ablation study results on the benchmark dataset
|
Model Variants |
Accuracy (%) |
Precision (%) |
Recall (%) |
F-Measure (%) |
|
Inception-ResNet-v2 (without modules) |
87.62 |
86.48 |
85.93 |
86.20 |
|
Twofold Pathway only |
91.84 |
90.72 |
90.15 |
90.43 |
|
ROI Refinement only |
92.56 |
91.63 |
91.07 |
91.35 |
|
ECADepBnet (Twofold pathway + ROI Refinement+ Inception-ResNet-v2) |
95.95 |
95.97 |
95.94 |
95.76 |
In this article, ECADepBnet is developed to address the image intensity issues from the collected images for the efficient bird species classification. Twofold pathway hierarchy structure and ROI refinement model aim to improve low-level depiction of attributes and effectively locate distinct areas in the images. This network generates pyramidal features and attentions from FPN using top-down feature and bottom-up attentional routes. The pyramidal ROI is generated using region proposal generator with an ANMS operation. ROI refinement is performed using dropblock and merge block operations to remove discriminative regions and locate major regions. The refined feature maps are fed into the FC layer of Inception-ResNet-v2, enhancing bird species classification performance. Finally, the experimental results revealed that the proposed model achieves 95.95% accuracy on collected dataset outperforms HHOS-EfficientB0, EfficientNetB5, HHOS-EfficientB0, Inception-ResNet-v2, CADepBnet.
Despite the high classification accuracy achieved by the proposed ECADepBnet, the model has certain limitations. The model’s performance may decrease due to complex backgrounds in collected images such as dense foliage or urban settings and in cases where birds are partially occluded. Additionally, variations in birds’ motion could affect feature extraction and classification accuracy. In future work, these issues can be addressed by incorporating advanced data augmentation techniques such as random occlusion and background blending by employing attention mechanisms or transformer-based modules. This enhances the focus on relevant regions and data expansion with more challenging images to improve the model’s generalization.
[1] Camacho-Guzmán, A., Vila Akerberg, V.D.Ã., Martínez-Soto, J., Rodríguez-Soto, C., Reyes, R.P.R. (2023). Connectedness to nature, well-being and presence of birds. Fronteira: Journal of Social, Technological and Environmental Science, 12(1): 248-264. https://doi.org/10.21664/2238-8869.2023v12i1.p248- 264
[2] Tobias, J.A., Şekercioğlu, Ç.H., Vargas, F.H. (2013). Bird conservation in tropical ecosystems: Challenges and opportunities. Key Topics in Conservation Biology, 2: 258-276. https://doi.org/10.1002/9781118520178.ch15
[3] Fraixedas, S., Lindén, A., Piha, M., Cabeza, M., Gregory, R., Lehikoinen, A. (2020). A state-of-the-art review on birds as indicators of biodiversity: Advances, challenges, and future directions. Ecological Indicators 2020, 118: 1-10. https://doi.org/10.1016/j.ecolind.2020.106728
[4] Wenny, D.G., Devault, T.L., Johnson, M.D., Kelly, D., Sekercioglu, C.H., Tomback, D.F., Whelan, C.J. (2011). The need to quantify ecosystem services provided by birds. The Auk, 128(1): 1-14. https://doi.org/10.1525/auk.2011.10248
[5] Yoshihashi, R., Kawakami, R., Iida, M., Naemura, T. (2015). Construction of a bird image dataset for ecological investigations. In 2015 IEEE International Conference on Image Processing (ICIP), Quebec City, QC, Canada, pp. 4248-4252. https://doi.org/10.1109/ICIP.2015.7351607
[6] Chabot, D., Francis, C.M. (2016). Compute-automated bird detection and counts in high-resolution aerial images: A review. Journal of Field Ornithology, 87(4): 343-359. https://doi.org/10.1111/jofo.12171
[7] Yoshihashi, R., Kawakami, R., Iida, M., Naemura, T. (2017). Bird detection and species classification with time-lapse images around a wind farm: Dataset construction and evaluation. Wind Energy, 20(12): 1983-1995. https://doi.org/10.1002/we.2135
[8] Takeki, A., Trinh, T.T., Yoshihashi, R., Kawakami, R., Iida, M., Naemura, T. (2016). Combining deep features for object detection at various scales: Finding small birds in landscape images. IPSJ Transactions on Computer Vision and Applications, 8: 1-7. https://doi.org/10.1186/s41074-016-0006-z
[9] Sharma, N., Vijayeendra, A., Gopakumar, V., Patni, P., Bhat, A. (2022). Automatic identification of bird species using audio/video processing. In 2022 International Conference for Advancement in Technology (ICONAT), Goa, India, pp. 1-6. https://doi.org/10.1109/ICONAT53423.2022.9725906
[10] Lele, J., Palliwal, N., Rajurkar, S., Tomar, V., Phadke, A.C. (2023). Comparison of image based and audio-based techniques for bird species identification. In Intelligent Systems and Applications in Computer Vision, pp. 105-114. https://doi.org/10.1201/9781003453406-1
[11] Chandra, B., Raja, S.K.S., Gujjar, R.V., Varunkumar, J., Sudharsan, A. (2021). Automated bird species recognition system based on image processing and SVM classifier. Turkish Journal of Computer and Mathematics Education, 12(2): 351-356. https://doi.org/10.17762/turcomat.v12i2.813
[12] Wei, X.S., Song, Y.Z., Mac Aodha, O., Wu, J., et al. (2021). Fine-grained image analysis with deep learning: A survey. IEEE Transactions on Pattern Analysis and Machine Intelligence, 44(12): 8927-8948. https://doi.org/10.1109/TPAMI.2021.3126648
[13] Rai, B.K., Sharma, S., Kumar, G., Kishor, K. (2022). Recognition of different bird category using image processing. International Journal of Online & Biomedical Engineering, 18(7): 101-114. https://doi.org/10.3991/ijoe.v18i07.29639
[14] Lee, S., Lee, M., Jeon, H., Smith, A. (2019). Bird detection in agriculture environment using image processing and neural network. In 2019 6th International Conference on Control, Decision and Information Technologies (CoDIT), Paris, France, pp. 1658-1663. https://doi.org/10.1109/CoDIT.2019.8820331
[15] Niemi, J., Tanttu, J.T. (2018). Deep learning case study for automatic bird identification. Applied Sciences, 8(11): 1-15. https://doi.org/10.3390/app8112089
[16] Ferreira, A.C., Silva, L.R., Renna, F., Brandl, H.B., et al. (2020). Deep learning-based methods for individual recognition in small birds. Methods in Ecology and Evolution, 11(9): 1072-1085. https://doi.org/10.1111/2041-210X.13436
[17] Huang, Y.P., Basanta, H. (2021). Recognition of endemic bird species using deep learning models. IEEE Access, 9: 102975-102984. https://doi.org/10.1109/ACCESS.2021.3098532
[18] Sivaranjani, B., Karpagavalli, S. (2025). Graphs target relations and class attention model for deep bird species detection network. International Journal of Intelligent Engineering & Systems, 18(3): 583-587. https://doi.org/10.22266/ijies2025.0430.40
[19] Anusha, P., ManiSai, K. (2022). Bird species classification using deep learning. In 2022 International Conference on Intelligent Controller and Computing for Smart Power (ICICCSP), Hyderabad, India, pp. 1-5. https://doi.org/10.1109/ICICCSP53532.2022.9862344
[20] Xie, J., Zhu, M., Hu, K. (2022). Improved seabird image classification based on dual transfer learning framework and spatial pyramid pooling. Ecological Informatics, 72: 1-15. https://doi.org/10.1016/j.ecoinf.2022.101832
[21] Hermadi, I., Wulandari, W., Dhira, D. (2022). Development of a protected bird’s identification system using a convolutional neural network. Biodiversitas Journal of Biological Diversity, 23(5): 2561-2569. https://doi.org/10.13057/biodiv/d230537
[22] Sharma, N., Vijayeendra, A., Gopakumar, V., Patni, P., Bhat, A. (2022). Automatic identification of bird species using audio/video processing. In 2022 International Conference for Advancement in Technology (ICONAT), Goa, India, pp. 1-6. https://doi.org/10.1109/ICONAT53423.2022.9725906
[23] Manna, A., Upasani, N., Jadhav, S., Mane, R., Chaudhari, R., Chatre, V. (2023). Bird image classification using convolutional neural network transfer learning architectures. International Journal of Advanced Computer Science and Applications, 14(3): 854-864. https://doi.org/10.14569/IJACSA.2023.0140397
[24] Adhikari, N., Das, B., Roy, B., Bhattacharya, S., Sultana, M. (2022). Bird species identification and classification based on feature analysis using VGG19 framework. In International Conference on Advances in Data Science and Computing Technologies, pp. 677-684. https://doi.org/10.1007/978-981-99-3656-4_69
[25] Wang, K., Yang, F., Chen, Z., Chen, Y., Zhang, Y. (2023). A fine-grained bird classification method based on attention and decoupled knowledge distillation. Animals, 13(2): 1-17. https://doi.org/10.3390/ani13020264
[26] Mochurad, L., Svystovych, S. (2024). A new efficient classifier for bird classification based on transfer learning. Journal of Engineering, 2024(1): 1-13. https://doi.org/10.1155/2024/8254130
[27] Yang, F., Shen, N., Xu, F. (2024). Automatic bird species recognition from images with feature enhancement and contrastive learning. Applied Sciences, 14(10): 1-12. https://doi.org/10.3390/app14104278
[28] Kumar, S.V., Kondaveeti, H.K. (2024). Bird species recognition using transfer learning with a hybrid hyperparameter optimization scheme (HHOS). Ecological Informatics, 80: 1-12. https://doi.org/10.1016/j.ecoinf.2024.102510
[29] Gavali, P., Saira Banu, J. (2024). Deep convolutional neural network for automated bird species classification. Traitement du Signal, 41(1): 261-271. https://doi.org/10.18280/ts.410121
[30] Hu, J., Shen, L., Sun, G. (2018). Squeeze-and-excitation networks. In Proceedings of the IEEE Conference on Computer Vision and Pattern Recognition, pp. 7132-7141. https://doi.org/10.48550/arXiv.1709.01507
[31] Ren, S., He, K., Girshick, R., Sun, J. (2016). Faster R-CNN: Towards real-time object detection with region proposal networks. IEEE Transactions on Pattern Analysis and Machine Intelligence, 39(6): 1137-1149 https://doi.org/10.1109/TPAMI.2016.2577031
[32] Lin, T.Y., Dollár, P., Girshick, R., He, K., Hariharan, B., Belongie, S. (2017). Feature pyramid networks for object detection. In Proceedings of the IEEE Conference on Computer Vision and Pattern Recognition, pp. 2117-2125. https://doi.ieeecomputersociety.org/10.1109/CVPR.2017.106