Abhinav Pathak*![]() | Murali Matcha
| Murali Matcha![]() | Manikanta Gopisetti
| Manikanta Gopisetti![]() | Shubham Joshi
| Shubham Joshi![]()
© 2025 The authors. This article is published by IIETA and is licensed under the CC BY 4.0 license (http://creativecommons.org/licenses/by/4.0/).
OPEN ACCESS
The accurate prediction of student placement outcomes is an important task for academic institutions to improve career support services. One difficulty is that most of the traditional statistical methods are not equipped to handle the interplay between the academics, complex variables and demographics that often combine to produce a niched placement success. In this work, we present a robust Machine Learning (ML) model for predicting outcomes for student placements, based on a large publicly available Kaggle dataset. The pipeline includes the successful prepossessing of all machine learning models with systematic data pre-processing, exploratory data analysis (EDA), encoding of categorical feature and data scaling for better quality of data for input to the models. Several machine learning algorithms, including Decision Trees (DT), Logistic Regression (LR), Voting Classifier (VC), and other classifiers are trained and their performances are compared. The model’s predictive performance is enhanced through hyperparameter optimization and cross validation. The proposed voting classifier outperforms the existing traditional ML models in terms of accuracy, precision, and computational efficiency. Our results show that machine learning models greatly improve predictability of a student placement and could be a valuable tool for data-driven career counselling and institutional planning. This research illustrates the value of artificial intelligence (AI) in the educational landscape and provides a stepping stone for further development such as real-time predictions and integrating a wider range of features.
student placement prediction, ensemble learning, educational data mining
Moving from college level education in academia to work in industry is a turning point in a student’s life. In today’s competitive job market, the problem of being able to predict placements of students in industry has gained increasing importance for educational institutions, students as well as the employers. In the past, placement recommendations were implemented with crude statistical algorithms or heuristic rules that considered only few aspects such academic average or ability test scores. Nevertheless, these traditional methods exempt many complicated and nonlinear interactions between grades, technical skills, internships, certifications, and demographic information which affecting employability.
Earlier research done by Kumar et al. [1] investigates the application of various machine learning algorithms to predict college students' placements based on academic performance. The research concludes that the Random Forest (RF) algorithm outperforms others in terms of accuracy, precision, recall, and F1-score, highlighting the significant impact of academic factors like grades and test scores on placement predictions. In this research, the RF classifier has high variance issue with respect to the performance on the test data, the training accuracy reported is 96% whereas test accuracy is only 64.62%.
Ruparel and Swaminarayan [2] and Maurya et al. [3] develop a predictive model to determine a student's likelihood of securing placement, utilizing machine learning classification algorithms such as K-Nearest Neighbors (KNN), LR and RF. The research aims to analyze historical data to forecast placement opportunities and support efforts to increase successful placements within institutions. The major challenge for both of these researches is that the test dataset is extremely small, which may lead to biased performance of the classifier. Srinivas et al. [4] utilized logistic regression to predict student placements based on academic percentages and technical skills. The model aimed to determine the eligibility of candidates for placement opportunities.
Ruparel and Swaminarayan [5] present a methodology integrating multiple machine learning algorithms to predict student placement outcomes. The ensemble model demonstrates improved accuracy, precision, and F1-score over individual algorithms, offering a robust framework for educational institutions to enhance placement procedures. In this research training time is not considered for evaluating the performance of machine learning models. Byagar et al. [6] explore the application of machine learning algorithms, i.e., Naïve Bayes (NB), RF, and DT, to forecast students campus placements. The study evaluates the accuracy of these classifiers in predicting job placements, emphasizing the benefits and limitations of using machine learning for placement prediction in educational institutions. In the study [7], the researcher utilizes machine learning models, specifically LR and DT, to anticipate the placement status of engineering students in the computer science stream. The study emphasizes the importance of such predictive models in enhancing placement quality. The research paper [8] introduces a smart system for predicting student placements using machine learning techniques. The system aims to assist educational institutions in identifying student’s placement probabilities, thereby facilitating targeted interventions. The major challenge in this research is there is no clear information about the variables considered for prediction purpose.
The study [9] presents a comprehensive framework employing eight machine learning algorithms to predict the placement outcomes of graduates. The model integrates institutional data and placement test records to assess the skill levels of students. Among the algorithms tested, the RF classifier demonstrated superior performance in forecasting placement probabilities. While the study effectively utilizes academic and test data for prediction, it does not incorporate non-academic factors such as soft skills, extracurricular activities, or socio-economic backgrounds, which could also influence placement outcomes. Additionally, the model's applicability across diverse educational institutions remains unexplored.
This research is aimed to address most of the issues mentioned above by building a robust learning model to predict student’s placement outcome. We develop end-to-end data preprocessing, model training and testing pipeline using a publicly available Kaggle dataset. Various machine learning techniques are compared and tested based on their performance and the exploratory data analysis (EDA) is performed to see the effect of target variable on independent variables. The main highlights of this research can be summarized as follows:
•EDA is conducted widely to explore the associations of the target and independent features.
•Data prepossessing steps includes: Checking missing and duplicate records if any, scaling the features and encoding the categorical variables are the data prepossessing operations to maintain quality and consistence in the data.
•Multiple machine learning algorithms including ensemble models are trained and tested. We compare their performance through a series of evaluations to obtain the optimal model with the early placement prediction. The objective is to create an ensemble based voting classifier machine learning framework that combines the strength of base classifiers rather than an individual classifier.
With this work, to bridge the gap between ML models that exist in theory developed in literature, and the actual use of these ML models in practice in educational institutions with the goal of benefiting students through better support services and placement opportunities.
The dataset utilized in this study is a publicly available dataset sourced from Kaggle [10], designed to support predictive modelling of student placement outcomes. The dataset is based on a university on-campus placement record for the engineering courses from 2013 and 2014.It comprises several features that capture academic, demographic, and behavioural attributes of students. There is total 2966 records, each record in the dataset represents an individual student and their corresponding placement status. The dataset includes the following variables:
•Age: A numeric feature which represents the student’s age.
•Gender: Categorical variable with 2 categories: Male and Female.
•Stream: The stream is categorical variable representing the field of education pursuing by the student: Computer Science, Information Technology, Electronics and Communication, etc.
•Internships: A numeric value that represents the number of internships the student has done ranges between 0 to 3.
•CGPA: Cumulative Grade Point Average of student, a numerical value indicating the student's performance.
•Hostel: A binary categorical variable representing that the student is living in some hostel (1 for Yes, 0 for No).
•History of Backlogs: A binary variable indicating whether a student has academic backlogs (1 for Yes, 0 for No).
•Placed or Not: This is the target variable where 1 means the student is successfully placed in through campus recruitment and 0 means not placed.
The dataset captures a balanced combination of categorical and numerical features, making it suitable for training and evaluating machine learning classification models. These features were carefully selected to reflect factors commonly considered influential in campus placement decisions.
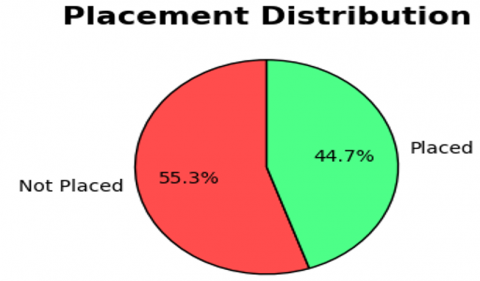
Exploratory data analysis is performed to understand the relationship between binary target variable (Placed or Not) and other independent variables. A pie chart is created, as shown below in Figure 1, which depicts that out of the total students enrolled, only 44.7% are placed, while the remaining 55.3% are not placed an alarming situation for the academic institution.
Figure 1. Pie chart visualization for placement distribution of students
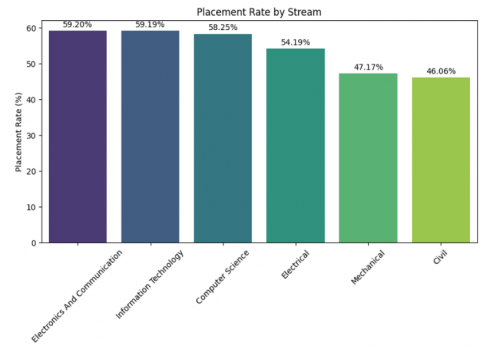
In Figure 2, a bar chart is plotted between the stream in which a student is enrolled and the placement rate. It provides insights into the dataset, showing that the Electronics and Communication stream has the highest placement rate at 59.2%, whereas the Mechanical and Civil streams have placement rates below 50% specifically, 41.7% and 46.06%, respectively. This clearly indicates that graduates of Civil and Mechanical streams may be lacking certain skill sets, making them less industry-ready and, consequently, resulting in a lower placement rate. Even though the Computer Science and Information Technology streams have high market demand, the placement rate of students in these fields is still below 60 percent. This rate can be improved by imparting skill-based training and certifications that make students industry-ready, thereby increasing their chances of being placed.
Figure 2. Bar chart visualization for placement rate versus stream
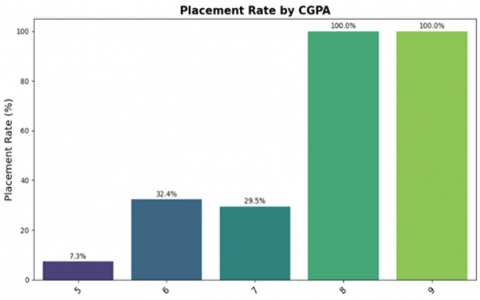
The bar chart in Figure 3 illustrates the relationship between CGPA and student placement rates. Students with a CGPA of 8 or 9 achieve 100% placement, while lower CGPAs see drastically reduced rates, highlighting a strong positive correlation between academic performance and placement outcomes.
Figure 3. Bar chart visualization for placement distribution of students
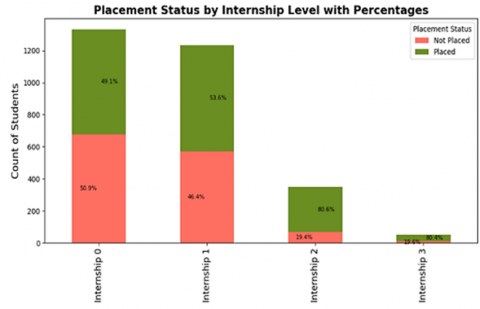
The bar chart in Figure 4 illustrates the relationship between internship and student placement rates. The chart reveals a strong positive impact of internships on placements. Students with two or more internships achieve over 80% placement, while those with none remain below 50%, highlighting the importance of practical industry exposure for employability.
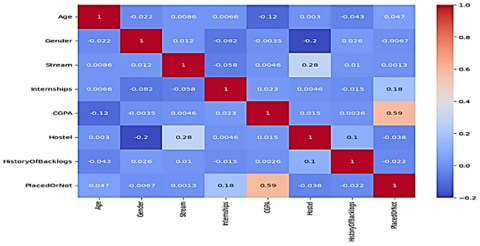
In Figure 5, a correlation heatmap showing the relationships between various student-related features and placement outcomes is plotted. The heatmap shows that CGPA has the strongest positive correlation of 0.59 with placement, indicating academic performance is a key predictor. Internships also show a moderate positive correlation 0.18. Other features like age, gender, stream, hostel status, and backlog history have minimal impact on placement outcomes in this dataset.
Figure 4. Bar chart visualization for placement rate versus number of internships
Figure 5. Correlation heatmap between the variables
This section discusses pre-processing the data before model training and tuning the model's hyperparameters. Initially, the dataset was checked for any missing values in the columns by applying isnull() and sum () functions from pandas. There was no missing data and hence no need for imputation or deletion. The categorical variables-Gender and Stream were encoded with one hot encoding using the pd.get_dummies() to make it compatible for the machine learning algorithms. All numerical variables were standardized so that they had a mean of 0 and standard deviation of 1 to ensure uniform scaling in each feature using StandardScaler. This step is very important for distance-based models like KNN and gradient-based methods like Logistic Regression.
The pre-processed dataset was divided into training and testing sets in the ratio of 80:20, respectively [11]. The train_test_split() function from Scikit-learn was used to shuffle while separating the data such that the two data subsets were equal with respect to the class distribution. Seven types of machine learning models were used to predict the student placement. In this research the previously existing machine learning models performance is compared with the proposed Voting classifier in the below section.
• Logistic Regression (LR): This is one of the simplest classification models that provides the probability of binary outcome by applying a sigmoid function to the linear combination of inputs. This is simple and interpretable model [12, 13].
• Decision Tree (DT): This model recursively splits the data into subsets based on feature values to maximize information gain. Decision tree is capable of handling nonlinear relationship but is many times prone to overfitting if not tuned properly. In this research paper hyper parameter tuning is also performed using GridSearchCV [14].
• K-Nearest Neighbors (KNN): This is an instance-based learning algorithm that classifies data based on the majority label among the nearest neighbors. The number of neighbors is a hyperparameter in this model [15].
• Gaussian Naive Bayes (GNB): It is a probabilistic model based on Bayes theorem, assuming Gaussian distribution and feature independence. It calculates the likelihood of each class using Bayes theorem and predicts the class with the highest probability. It works well for small datasets but struggles with correlated features [16].
• Random Forest (RF): This is an ensemble model which constructs multiple decision trees parallelly and the final output is predicted by majority voting method. This model overcome the problem of overfitting [17].
• XGBoost (XGB): This model predicts by sequentially building decision trees, where each new tree corrects errors from the previous one. It combines predictions using gradient boosting and regularization to enhance accuracy while avoiding overfitting, making it ideal for structured data like academic records and skills [17].
• Voting Classifier (VC): It is an ensemble model that combines predictions from multiple base classifiers (in this research, KNN, Random Forest and Decision tree are base classifiers). The final prediction is obtained by majority voting. The ensemble approach leverages the strengths of multiple algorithms, reducing the chance of overfitting and increasing overall model accuracy. This combination was selected for its diversity in base classifiers, ensuring a robust final model [17, 18].
Table 1. Hyperparameters obtained using GridSearchCV with 10-fold cross validation
|
Classifier |
Optimal Hyperparameter Configuration via 10-Fold Cross Validation |
|
Decision Tree |
Criterion value: Entropy; Maximum Depth value: 10; Minimum Samples per Leaf: value 1; Minimum Samples for Split value: 5 |
|
Random Forest |
Bootstrap value: False; Maximum Depth value: 15; Minimum Samples per Leaf value: 4; Minimum Samples for Split value: 10; Number of Estimators value: 300 |
|
KNN |
Distance Metric value: Manhattan; Number of Neighbors value: 15 |
All above models were trained using the training data, followed by hyperparameter tuning to optimize performance. Hyperparameter tuning was conducted using GridSearchCV with 10-fold cross-validation. This technique exhaustively searches over specified parameter values to identify the combination yielding the best cross-validation performance. The choice of hyperparameter ranges for each model in GridSearchCV was guided by a combination of prior research, common best practices in the literature, and empirical testing. For example, the number of estimators for ensemble models (Random Forest) was varied between 100 and 500 based on typical defaults and performance–computational trade-offs. Maximum depth values were chosen within a practical range (i.e., 5 to 20) to avoid overfitting while allowing for model expressiveness. These ranges ensured a balance between model accuracy and training efficiency, and the exhaustive nature of GridSearchCV ensured optimal combinations were explored within these bounds. The best parameters identified for key models are listed in Table 1.
This section evaluates the performance of the machine learning model using various performance metrics, as given below. We evaluated each trained model on the unseen test set using a set of performance metrics [19-23]. Since the dataset is balanced, all metrics are considered equally valid. To assess model performance on unseen data, several key evaluation metrics were utilized. These metrics are particularly relevant in classification tasks and are derived from the confusion matrix components: TP (True Positives), TN (True Negatives), FP (False Positives), and FN (False Negatives). The metrics used are given below:
Accuracy is a widely used performance metric that measures the overall correctness of a classification model. It is defined as the ratio of the number of correct predictions to the total number of predictions made.
$Accuracy=\frac{T P+T N}{T P+T N+F P+F N}$ (1)
Precision quantifies the model’s ability to correctly identify only the relevant positive cases. It measures the proportion of instances predicted as positive that are actually positive.
$Precision=\frac{T P}{T P+F P}$ (2)
Recall quantifies the model’s ability to identify all relevant positive instances. It is the ratio of correctly predicted positive cases to all actual positive cases.
$Recall=\frac{T P}{T P+F N}$ (3)
The F1 score is the harmonic mean of precision and recall, providing a single metric that balances both. It is especially useful when there is a trade-off between precision and recall, as it captures both false positives and false negatives.
$F1 Score=2 * \frac{\text { Precison } * \text { Recall }}{\text { Precision }+ \text { Recall }}$ (4)
The Receiver Operating Characteristic Curve (ROC curve) represents a graphical representation of the True Positive Rate versus the False Positive Rate across various threshold settings. The area under the Receiver Operating Characteristic Curve (AUC-ROC) determines a model's capacity to distinguish between classes across all possible classification thresholds. The AUC value lies between 0.5 means no discriminative power and 1 means perfect separation, and greater values represent better classification performance.
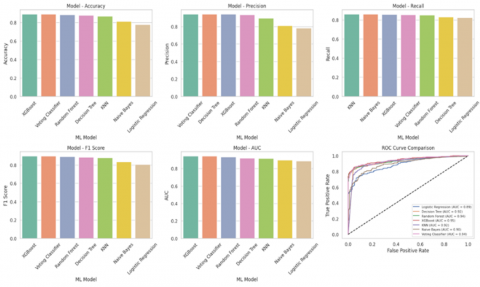
Training time refers to the time taken by each model to complete training. It is measured in seconds and is important for assessing the model's computational efficiency, particularly for time-sensitive or real-time applications. After performing model training and hyper parameter tuning, the model performance for unseen test data is reported in Table 2 below. In a similar context, the performance metrics are also drawn graphically, as shown in Figure 6.
Table 2. Performance evaluation metrics on unseen test data
|
Model |
Accuracy |
Precision |
Recall |
F1 Score |
AUC |
Training Time (s) |
|
Logistic Regression |
0.777778 |
0.783237 |
0.826220 |
0.804154 |
0.886960 |
0.050309 |
|
Decision Tree Classifer |
0.878788 |
0.941379 |
0.832317 |
0.883495 |
0.920881 |
0.004346 |
|
Random Forest |
0.885522 |
0.933333 |
0.853659 |
0.891720 |
0.935087 |
0.620628 |
|
XG Boost |
0.892256 |
0.940000 |
0.859756 |
0.898089 |
0.945254 |
0.973121 |
|
KNN |
0.868687 |
0.895570 |
0.862805 |
0.878882 |
0.916881 |
0.005056 |
|
Naive Bayes |
0.811448 |
0.808571 |
0.862805 |
0.834808 |
0.895808 |
0.001920 |
|
Proposed Voting Classifier |
0.892256 |
0.942953 |
0.856707 |
0.897764 |
0.943294 |
0.707170 |
Figure 6. Visual representation of performance evaluation metrics on unseen test data
LR showed the lowest accuracy (77.78%) and F1 score (80.42%), attributed to its assumption of linearity, which is insufficient to capture complex relationships in student data. Its limited expressiveness renders it suboptimal for this task. DT achieved an accuracy of 87.88% with a high precision (94.13%), but its tendency to overfit, especially on small or imbalanced datasets, limits its generalization capability despite low training time (0.004s). RF improved over single trees with 88.55% accuracy and an F1 score of 89.17%. It effectively reduces overfitting through ensemble learning. However, it showed higher training time (0.621s) and lacks sensitivity to local data variations.
XGB performed best among individual models with the highest AUC (0.945) and F1 score (89.81%). Although highly accurate (89.23%), it required the longest training time (0.973s) and is sensitive to parameter tuning, which may affect reproducibility and scalability. KNN performed reasonably well (accuracy: 86.87%), leveraging local patterns. However, its performance can degrade in high-dimensional spaces and with imbalanced features, affecting reliability. GNB, while computationally efficient (training time: 0.002s), showed moderate performance (accuracy: 81.14%) due to its strong independence assumptions, which are often violated in real-world student datasets.
The proposed Voting Classifier (VC), composed of KNN, DT, and RF as base learners, achieved the highest overall performance among all evaluated classifiers. It attained an accuracy of 89.23%, a precision of 94.29% (highest), an F1-score of 89.77%, and an AUC of 0.9433, indicating excellent discriminatory power. The model also demonstrated a reasonable training time of 0.707 seconds, making it both effective and computationally feasible. Although the proposed Voting Classifier exhibits a relatively higher training time (0.7071s) compared to individual models like Naive Bayes (0.0019s) and Decision Tree (0.0043s), this increase is justifiable due to the improved predictive performance and robustness achieved by combining multiple classifiers. Voting ensembles generally involve training multiple base models which naturally increases computational time. However, this trade-off is acceptable due to the classifier's ability to reduce variance, handle overfitting, and provide more stable and generalized predictions, especially in complex or imbalanced datasets. The foundation of the VC lies in soft voting, where the predicted probabilities of base classifiers are averaged to make the final prediction. Soft voting aggregates their probabilistic outputs, yielding a robust ensemble that balances bias and variance, improves generalization, and mitigates the individual weaknesses of its base classifiers. As a result, the proposed model offers an optimal solution for student placement prediction in both accuracy and reliability.
The dataset used is domain-specific and limited to engineering students, which may restrict the generalizability of the model to other academic disciplines or broader educational contexts. The model's performance might vary when applied to datasets from non-engineering fields, different geographic regions, or institutions with distinct placement criteria. Future research could address these gaps by incorporating more diverse datasets, cross-domain validation, and alternative modeling techniques to further assess the robustness and transferability of the proposed approach.
This research presented a comprehensive approach to predictive modelling, beginning with exploratory data analysis (EDA) to understand the underlying patterns in the dataset. Data preprocessing steps were rigorously implemented, including checking for missing values (none found), encoding categorical variables using one-hot encoding, and standardizing numerical features with Standard Scaler to ensure uniform scaling across attributes. Multiple classification models including ensemble techniques were developed and evaluated. Each model was subjected to hyperparameter tuning using GridSearch CV to enhance performance. The evaluation was conducted on unseen test data using key performance metrics.
All models were evaluated on unseen test data using key performance metrics such as accuracy, precision, recall, F1 score, and AUC. While several models including Random Forest and XGBoost exhibited strong performance, the proposed Voting Classifier outperformed all others, achieving the highest precision (94.29%), a competitive accuracy (89.23%), and a robust F1 score (0.898) with an AUC of 0.943, indicating excellent class separation capability.
The success of the Voting Classifier lies in its ensemble architecture, which effectively combines the strengths of its base learners: K-Nearest Neighbors, Decision Tree, and Random Forest. This combination reduces model variance, balances bias, and enhances generalization, making it particularly suitable for the heterogeneous and nonlinear nature of student placement data.
In contrast, simpler models like Naive Bayes, while computationally efficient, suffered from lower predictive accuracy due to restrictive assumptions. This study demonstrates that ensemble learning, particularly with well-chosen and complementary base classifiers, significantly enhances classification performance. The findings underscore the importance of algorithm selection, proper preprocessing, and model evaluation in developing reliable predictive solutions for educational data mining applications.
[1] Kumar, M., Walia, N., Bansal, S., Kumar, G., Cengiz, K. (2023). Predicting college students placements based on academic performance using machine learning approaches. International Journal of Modern Education and Computer Science, 15(6): 1-13. https://doi.org/10.5815/ijmecs.2023.06.01
[2] Ruparel, M., Swaminarayan, P. (2024). Student placement prediction using various machine learning techniques. International Journal of Intelligent Systems and Applications in Engineering, 12(3): 2107-2113. https://www.ijisae.org/index.php/IJISAE/article/view/5678.
[3] Maurya, L.S., Hussain, M.S., Singh, S. (2022). Machine learning classification models for student placement prediction based on skills. International Journal of Artificial Intelligence and Soft Computing, 7(3): 194-207. https://doi.org/10.1504/IJAISC.2022.126337
[4] Srinivas, C.K., Ydav, N.S., Pushkar, A.S., Somashekar, R., Sundeep, K.R. (2020). Students placement prediction using machine learning. International Journal for Research in Applied Science and Engineering Technology, 8(5): 2771-2774. https://doi.org/10.22214/ijraset.2020.5466
[5] Ruparel, M., Swaminarayan, P. (2025). Enhancing student placement predictions with advanced machine learning techniques. Journal of Information Systems Engineering and Management, 10(1s): 275-288. https://doi.org/10.52783/jisem.v10i1s.121
[6] Byagar, S., Patil, R., Pawar, J. (2023). Maximizing campus placement through machine learning. Journal of Advanced Zoology, 45(S4): 6-12. https://doi.org/10.53555/jaz.v45iS4.4141
[7] Rai, K., Kumar, P., Sood, S. (2023). Anticipating Placement status of engineering students using machine learning based prediction models - A case study of computer science stream. In 2023 International Conference on Innovative Data Communication Technologies and Application (ICIDCA), Uttarakhand, India, pp. 181-185. https://doi.org/10.1109/ICIDCA56705.2023.10100042
[8] Kavya, G., Pranitha, Y., Sanjana, A., Sirisha, D.G., Mamatha, A. (2021). Smart system for student placement prediction. International Journal of Advance Research, Ideas and Innovations in Technology, 7(4): 452-355.
[9] Jena, A.R., Pati, S., Chakraborty, S., Sarkar, S., Guin, S., Mallick, S., Sen, S.K. (2021). A framework for predicting placement of a graduate using machine learning techniques. In Proceedings of International Conference on Innovations in Software Architecture and Computational Systems. Studies in Autonomic, Data-driven and Industrial Computing. Springer, Singapore, pp. 197-206. https://doi.org/10.1007/978-981-16-4301-9_15
[10] Kaggle. (2021). Student placement dataset. https://www.kaggle.com/datasets/tejashvi14/engineering-placements-prediction.
[11] Viscanti, L. (2023). Training data: The milestone of machine learning. https://mapendo.co/blog/training-data-the-milestone-of-machine-learning.
[12] Dangeti, P. (2017). Statistics for Machine Learning. Packt Publishing Ltd.
[13] Hosmer, D.W., Lemeshow, S., Sturdivant, R.X. (2013). Applied Logistic Regression, 3rd ed. Wiley, Hoboken, NJ. https://doi.org/10.1002/9781118548387
[14] Yadav, D.C., Pal, S. (2020). Prediction of thyroid disease using decision tree ensemble method. Human-Intelligent Systems Integration, 2: 89-95. https://doi.org/10.1007/s42454-020-00006-y
[15] Sharif, M., Burn, D.H. (2006). Simulating climate change scenarios using an improved K-nearest neighbor model. Journal of Hydrology, 325(1-4): 179-196. https://doi.org/10.1016/j.jhydrol.2005.10.015
[16] Singh, G., Kumar, B., Gaur, L., Tyagi, A. (2019). Comparison between multinomial and Bernoulli Naïve Bayes for text classification. In 2019 International Conference on Automation, Computational and Technology Management (ICACTM), London, UK, pp. 593-596. https://doi.org/10.1109/ICACTM.2019.8776800
[17] Rokach, L. (2010). Ensemble-based classifiers. Artificial Intelligence Review, 33: 1-39. https://doi.org/10.1007/s10462-009-9124-7
[18] Pathak, A., Gupta, R. (2022). A hybrid technique for analysis of low-frequency oscillation in power system. Pertanika Journal of Science and Technology, 30(3): 2033-2052. https://doi.org/10.47836/pjst.30.3.15
[19] Nagisetti, L., Chintapalli, M., Kanugula, N., Abhishek, V.V., Iwin, T.J.S., Bindu, G. (2025). Prediction of depression levels in girl students using machine learning algorithms. Ingénierie des Systèmes d’Information, 30(1): 257-266. https://doi.org/10.18280/isi.300122
[20] Islam, M.R., Kabir, M.A., Ahmed, A., Kamal, A.R.M., Wang, H., Ulhaq, A. (2018). Depression detection from social network data using machine learning techniques. Health Information Science and Systems, 6: 8. https://doi.org/10.1007/s13755-018-0046-0
[21] Matcha, M., Rani, C., Basha, C.H. (2022). Design and performance analysis of multilayer neural network-based battery energy storage system for enhancing demand side management. SSRG International Journal of Electrical and Electronics Engineering, 9(10): 7-13. https://doi.org/10.14445/23488379/IJEEE-V9I10P102
[22] Singh, D., Chandiramani, J., Sekhar, R. (2025). Predictive modelling of personal remittances received in India using machine learning. Ingénierie des Systèmes d’Information, 30(4): 901-911. https://doi.org/10.18280/isi.300407
[23] Vetrithangam, D., Palit, S., Mehta, A., Saranya, G., Joseph, D., Pathak, A. (2025). Machine fault diagnosis using random forest with recursive feature elimination and cross-validation. Journal of Machine and Computing, 5(3): 1700-1711. https://doi.org/10.53759/7669/jmc202505134