Bhavana Tiwari*![]() | Latika Jindal
| Latika Jindal![]()
© 2025 The authors. This article is published by IIETA and is licensed under the CC BY 4.0 license (http://creativecommons.org/licenses/by/4.0/).
OPEN ACCESS
This work focuses on the deep learning model intended to categorise wheat leaf photos depending on biotic and abiotic stress situations, namely nitrogen shortage and leaf rust, together with healthy leaf images. The main goal was to develop a strong and accurate model to improve precision farming methods by means of consistent and timely evaluations of crop condition. High-quality photographs were obtained with a Sony IMX363 RGB camera from a dataset gathered during the rabi season of 2019-20 from the Indian Agricultural Research Institute (IARI). The dataset included healthy leaves, leaves impacted by leaf rust, and nitrogen-deficient leaves, therefore guaranteeing a complete depiction of stress markers. To improve visibility of stress features, many preprocessing methods were used including Otsu-based background segmentation, contrast stretching, and Contrast Limited Adaptive Histogram Equalisation (CLAHE). To increase model resilience, rotation and scaling were used among data augmentation techniques. With hyperparameters painstakingly calibrated to maximise classification accuracy, the model architecture combined advanced ideas such residual and squeeze-excite blocks. Training, validation, and test sets-70:15:15-made up a balanced dataset split for the model. Accuracy measures were used in performance assessment to show a noteworthy capacity to separate stressed from healthy leaves. High classification accuracy of CropStressNet was shown, therefore enabling accurate identification of the stress conditions in wheat crops. This method helps to create more environmentally friendly farming methods in addition to provide understanding of crop health monitoring. The results highlight how deeply learning methods might be used to solve problems in precision farming.
stripe rust, wheat disease, neural networks, early detection and crop management
For majority of the world's population, wheat is a basic food source and among the most grown crops in the planet. Still, wheat output is beset with difficulties; illnesses seriously compromise food security and yield. Of these diseases, stripe rust-caused by the fungus Puccinia striiformis f. sp. tritici, is most destructive [1]. If not early on recognised and controlled, stripe rust disease can seriously reduce wheat harvests. Preventing the quick spread of the illness depends on early identification, which also enables quick interventions including the use of resistant types or fungicides. Although efficient, traditional approaches of spotting stripe rust-field inspections and laboratory-based methods-often demand specialised knowledge, time, and effort [2], these approaches might not always enable real-time observation over large agricultural tracts. Early-stage detection is crucial for efficient disease control, so development of precise and automated detection systems employing cutting-edge technology has attracted increasing interest [3]. One such interesting method uses artificial intelligence (AI) and, more especially, neural networks to early on detect stripe rust in wheat harvests [4]. A subset of machine learning and artificial intelligence, neural networks have shown amazing performance in many picture recognition and classification challenges, so they are a good choice for the detection of plant diseases. These networks may learn patterns and features from big datasets, therefore enabling the identification of minor visual symptoms that might not be readily apparent to human observers. Using neural networks, scientists hope to build systems that can automatically examine wheat plant photos and identify early stripe rust infection signals. Early identification could help farmers and agricultural professionals to respond right away, therefore reducing crop damage and guaranteeing maximum harvests [5, 6]. Systems for disease detection in plants have been driven even more by recent developments in computer vision, a branch of artificial intelligence that lets robots read and understand visual data. These systems can record and examine the minute features of plant leaves using high-resolution images, therefore spotting the early start of stripe rust depending on distinctive visual symptoms such yellowish streaks along the veins of the leaves [7-9].
Early identification of stripe rust disease using neural networks presents various benefits over more traditional techniques. First, by rapidly and effectively processing vast amounts of data, neural networks enable constant real-time surveillance of wheat fields. In big-scale agricultural operations where hand inspections are not feasible, this is especially helpful. Second, these artificial intelligence-based systems can be combined with ground-based sensors, satellites, or drones to gather photos across large distances, therefore offering a whole picture of crop condition [10]. Moreover, neural networks can be trained to identify between several diseases that might have similar symptoms, therefore lowering the possibility of misdiagnosis [11-13]. Implementing focused treatments and avoiding pointless treatments that can damage the crop or the surroundings depend on this degree of accuracy. The possibility for scalability of neural networks is another important factor in their application for illness diagnosis. From mobile devices to cloud-based systems, once a neural network model has been trained on a strong dataset of infected and healthy plant photos it can be used on many platforms. Small-scale and large-scale farming operations benefit much from this adaptability since it lets farmers and agronomists access the technology anywhere [14, 15]. Furthermore, major gains in the accuracy and dependability of these detection systems result from ongoing developments in neural network topologies like convolutional neural networks (CNNs). Popular choice for researchers working on agricultural uses, CNNs-which are especially well-suited for image-based tasks-have showed considerable potential in spotting disease trends in plants [16-18].
Although neural networks show promise for early-stage stripe rust detection, some issues still need to be resolved if we are to guarantee general acceptance of this approach. The necessity for high-quality, annotated datasets of wheat plants afflicted with stripe rust at several phases of growth presents one of the main difficulties. Establishing such datasets calls for cooperation between AI researchers and agricultural professionals to properly classify photographs and guarantee that the model picks the right attributes linked with the disease [19, 20]. Furthermore, influencing the accuracy of image-based detection systems are environmental elements including camera resolution, lighting conditions, and the existence of other plants or weeds in the field. Dealing with these difficulties calls for greater investigation and the creation of more complex algorithms able to change depending on the field conditions. a major progress in agricultural technology is made with the early-stage identification of stripe rust in wheat employing neural networks [21-23]. Using artificial intelligence and machine learning will help one create systems that can automatically identify diseases at an early stage, hence allowing quick and efficient treatments. Although there are obstacles to overcome, the possible advantages of applying neural networks for disease detection are significant; they provide a scalable, accurate, efficient answer to one of the most urgent problems in wheat output. The integration of artificial intelligence-based detection systems in agriculture could be very important in guaranteeing world food security and sustainability as research in this field develops changes [24-26].
Affecting wheat crops, stem rust-caused by the Puccinia graminis f. sp. tritici fungus-is a common and destructive disease with yield losses ranging from 10% to 50% and, in extreme cases from up to 90%. Pathologists' conventional visual diagnosis is time-consuming, expensive, and frequently unavailable in remote locations. This work proposes an automated system based on CIMMYT recommendations for identifying and classifying wheat stem rust. The system obtained a 92.01% testing accuracy by segmentation using adaptive thresholding and feature extraction using a Gabor filter. Its exact grading and real-time monitoring help to control diseases and change treatment plans, hence lowering crop losses [27-29].
Globally food security depends on wheat, which also offers vital nutrients. This work intends to build an adaptive deep-learning model for accurate classification and detection of wheat diseases so improving wheat crop development and disease control. Trained on 8,946 photos and validated on 2,259 images, the model used digital photographs from sites such Kaggle and GitHub. In testing it attained 98.42% accuracy and in validation 97.47%. With great accuracy and efficiency compared to present approaches, the method combines pre-trained convolutional neural networks (CNNs) like DenseNet, ResNet, and EfficientNet with the one-fit cycle strategy [30, 31].
Food security depends on agriculture, particularly considering the 0.88% world population increase by 2022. With anticipated global crop losses of 14.1%, plant diseases endanger food output. Early diagnosis of many diseases and precise identification depends on accurate data, although sometimes inadequate and unprocessed data causes obstacles. Focussing on prevalent bacterial and fungal illnesses, this work develops thorough databases for rice, wheat, and maize, thereby addressing these difficulties. Eight tuned deep learning models were assessed using the datasets. In maize illness recognition, Xception and MobileNet shone; in wheat, MobileNetV2 and MobileNet; in rice, Xception and Inception V3. Furthermore, a fresh CNN model trained from scratch showed great accuracy over all datasets, attaining testing accuracies of 0.9704, 0.96706, and 0.9609 for maize, rice, and wheat, respectively [32, 33].
A serious disease causing up to 80% crop loss worldwide, Asian soybean rust (ASR) must be early and accurate detected if we are to minimise financial effect. This paper presents DC2Net, a new neural network using deformable and dilated convolutions to capture both spatial and spectral characteristics from hyperspectral pictures, hence improving detection accuracy. Whereas the dilated convolution module concentrates on spectral information, DC2Net's deformable convolution module captures spatial features unlike those of conventional models with fixed convolutional kernels. Combining Shapley value with channel attention strategies helps to further improve wavelength significance for decision-making. With a detection accuracy of 96.73%, DC2Net exceeded current techniques and allowed early ASR identification even before visual symptoms start [34, 35].
Main wheat leaf diseases affecting yield and quality are stripe rust, leaf rust, and powdery mildew. Good control of diseases depends on timely identification. Incorporating the Convolutional Block Attention Module (CBAM) to increase feature extraction, this work proposes an upgraded YOLOv8 model for identifying wheat leaf diseases on mobile devices. Having a model size of 5.92MB, the enhanced YOLOv8 attained 95% accuracy, 98.3% recall, and 98.8% mean average precision (mAP). It had the lowest memory use and demonstrated notable increases in mAP-by 66.76, 48, 13.2, and 1.9 percentage points-versally compared to Faster R-CNN, YOLOv5, YOLOv7, and original YOLOv8 models. This model presents a feasible method for automatic, effective identification of wheat leaf diseases. Literature Summary:
3D CNNs enable automated Fusarium Head Blight (FHB) assessment, addressing the scarcity of automated detection methods while contributing to ongoing debates about manual versus automated accuracy [36, 37]. Similarly, smart microscopy systems automate fungal spore evaluation with improved precision across species, though questions remain about their reliability in practical applications [38, 39]. In wheat disease detection, deep learning models demonstrate efficient handling of diverse pathogens, yet their superiority over conventional approaches continues to be debated. Mobile applications show promise in enhancing stripe rust assessment accuracy, particularly in field conditions, although their performance relative to expert visual inspection requires further validation. Meanwhile, advanced architectures like MnasNet-SimAM improve disease identification in complex backgrounds, but their practical field applicability warrants additional investigation.
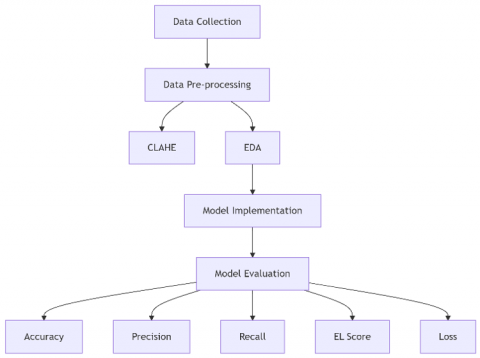
This work used a dataset of wheat crops gathered from the IARI field during the rabi season of 2019-2020, using a Sony IMX363 RGB camera to get high-quality photos. Images of nitrogen deficient wheat leaves with abiotic stress and leaf rust-common biotic stress signs visible at the booting stage-are included in the dataset and Figure 1 shows the proposed flowchart.
Healthy leaf photos were also included as a baseline for comparison and constant illumination conditions were kept to guarantee accurate analysis. Otsu-based background segmentation, scaling images to 135x270 pixels, contrast stretching, and Contrast Limited Adaptive Histogram Equalisation (CLAHE) to improve stress indicator visibility included preprocessing processes. Variability was raised via rotation and scaling among other data augmentation methods. Class distributions and visual aspects were evaluated by exploratory data analysis (EDA), therefore guaranteeing equal representation among the stress categories. CropStressNet is a deep learning model designed to categorise photos into three: nitrogen-deficient, leaf rust-affected, and healthy. With categorical cross-entropy as the loss function and Adam optimiser for maximum efficiency, the model architecture included cutting-edge ideas such residual and squeeze-excite blocks. Hyperparameters were painstakingly tweaked to maximise classification accuracy.
Figure 1. Proposed flowchart
3.1 Data collection
The dataset was gathered from wheat crops in the IARI field during the rabi season of 2019-20 using a Sony IMX363 RGB camera. The camera was set to a resolution of 4032×3024 pixels, with ISO set at 100 and a shutter speed of 1/200 seconds to ensure high-quality, sharp images. Images were captured under consistent natural daylight conditions between 10:00 AM and 2:00 PM to minimize variations in lighting. No artificial lighting or flash was used to maintain field authenticity. It centres on wheat leaves showing nitrogen deficit, abiotic stress, and leaf rust-a common biotic stress-both of which are evident in leaves at the booting stage of the crop. These pressures cause symptoms that greatly change leaf colour, texture, and structure, therefore allowing obvious variation. Consistent illumination was used to guarantee dependability and clarity for analytical needs on images. Accurately distinguishing and identifying stressed leaves depends on a baseline, thus this dataset comprises healthy wheat leaf images acquired under controlled conditions. From chlorosis brought on by nitrogen shortage to rust pustules unique to fungal infection, the images in this collection mirror several stress expressions. The dataset has been split into training, validation, and test sets as well as arranged into several folders allowing simple separation between stress and health. This system and inclusion of control images provide a strong basis for teaching deep learning models to precisely identify and classify indicators of biotic and abiotic stress in wheat, hence advancing precision agricultural methods.
3.2 Data preprocessing
Preprocessing in this dataset consisted in several phases to equip photos for deep learning investigation. Background segmentation was first used using Otsu-based masking to isolate leaf structures and eliminate undesired background features, therefore focusing the attention on stress patterns in the leaves. Images were then downsized consistently to 135×270 pixels to preserve interoperability across deep learning models, therefore offering a consistent training input size. Then, contrast stretching was applied to improve fine detail visibility-especially for stress-induced discolouration or texture changes-that are absolutely necessary for nitrogen deficiency and leaf rust detection. CLAHE further enhanced local contrast by varying brightness in smaller areas without increasing noise, hence emphasising stress signs. Custom Python routines were also used to apply brightness and contrast changes, therefore guaranteeing ideal visual clarity for analysis. Random noise was included into the dataset to simulate possible real-world settings and diversity the training data, hence adding variability and strengthening of the model. Emphasising stress-related properties in wheat leaf images under consistent lighting and quality, these preprocessing techniques together guaranteed the dataset was well-suited for accurate and resilient deep learning model performance.
|
Pseudocode for preprocessing wheat leaf images |
|
1. LOAD raw images 2. FOREACH image in dataset: a). Apply OTSU_BASED_MASKING to segment the leaf from the background. - This step removes background elements and isolates leaf structure. b). RESIZE the segmented image to 135x270 pixels. - Ensures consistent input size for deep learning models. c). Apply CONTRAST_STRETCHING to enhance visibility of discoloration patterns. - Highlights key features related to stress (e.g., nitrogen deficiency or rust). d). Apply CLAHE for local contrast enhancement. - Enhances texture and color without amplifying noise. e). ADJUST_BRIGHTNESS_CONTRAST of the image based on pre-set brightness and contrast values. - This improves overall clarity for deep learning analysis. f). OPTIONAL: Add RANDOM_NOISE to introduce variability for model robustness. - Simulates real-world conditions by adding minor pixel-level variations. 3. STORE preprocessed images in arrays for training, validation, and test sets. 4. RETURN processed dataset for model training and evaluation. |
3.3 Exploratory data analysis of wheat yellow rust dataset
Image distribution and features of the dataset were evaluated using EDA. Class distribution graphs provide information on the image count among nitrogen-deficient, leaf rust-affected, and healthy wheat leaves. Analysing these distributions guaranteed that every class was represented fairly, so enabling balanced model training. Maintaining consistent input size for the deep learning models was confirmed by image dimension consistency. Visual analysis of sample photos from each category revealed clear trends including chlorosis in nitrogen-deficient leaves, indicated by yellowing resulting from lack of chlorophyll, and the presence of rust pustules in sick leaves, suggestive of fungal infection. These visual characteristics were meticulously observed since they are essential markers for different forms of stress classification in the next model building stage. Understanding these picture features and class-specific patterns helped us to improve our method of feature selection by concentrating on qualities most important for stress identification. Building an accurate and efficient model for biotic and abiotic stress in wheat leaves depends on a deeper knowledge of the dataset, which this extensive EDA guaranteed.
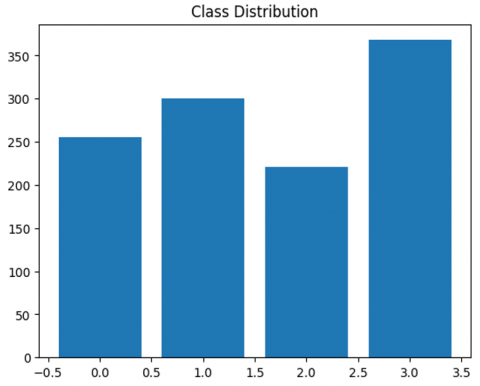
Figure 2 shows the dataset's class distribution. The x-axis shows several class labels ranging from -0.5 to 3.5; the y-axis shows the count of instances for every class. Class 3 stands out as having the most frequency-more than 350 cases-which suggests a possible dataset imbalance.
Figure 2. Bar graph of dataset's class distribution
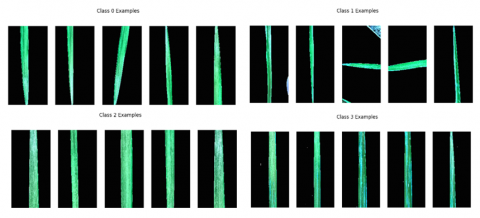
In Figure 3, four classes of leaf samples-Class 0, Class 1, Class 2, Class 3-are shown in the illustration. Every class reflects unique leaf traits that are vital for our work on crop stress classification. These graphic examples help one to grasp the differences related with nitrogen deficit and disease influence.
Figure 3. Four classes of leaf samples
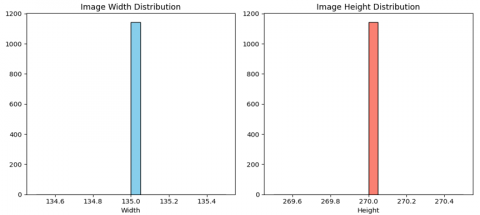
Figure 4. Distribution graphs of the image dimensions
In Figure 4, two distribution graphs showing the image dimensions in the dataset help to depict this. Centred on 135 pixels, the left plot displays the width distribution with a homogeneous count of roughly 1,200 photos at this width. With about 1,200 photos, the correct plot shows the height distribution-mostly around 270 pixels. Essential for homogeneity in image processing and analysis, these visualisations show a constant size over the dataset.
3.4 Contrast enhancement of wheat leaf images using CLAHE
By selectively increasing contrast, particularly in areas afflicted by stress that show faint discolourations, CLAHE was used to improve the visibility of important elements in the dataset images. Divining an image into small pieces, or tiles, CLAHE essentially modulates the intensity values and improves local contrast by individually performing histogram equalisation to each tile. In this instance, a tile grid size of (8, 8) was selected to split the photos into reasonable sections to emphasise localised changes in texture and colour over the leaf surfaces. A 2.0 clip limit was also established to stop noise from over-amplifying and therefore masking important information. While preserving the natural gradient transitions of healthy leaf tissues, CLAHE reduces the contrast in each tile, so enhancing stress-related details like the chlorosis in nitrogen-deficient leaves or rust pustules in infected leaves. By sharpening edges and increasing the visibility of discolouration patterns, this preprocessing phase helps the model to distinguish between stress-affected and healthy areas, hence enabling more accurate feature extraction and classification during model training. By improving relevant features without overloading the model with pointless noise, the balanced approach of CLAHE therefore best prepares the images for deeper investigation.
3.5 Model implementation
CropStressNet is the name given to the deep learning model created for nitrogen-deficient, leaf rust-affected, and healthy classification of wheat leaves. This name stresses its use in precision agriculture and indicates the particular attention of the model on stress in crop leaves.
Three categories- nitrogen-deficient, leaf rust-affected, and healthy-were established from wheat leaves using a deep learning-based model. Residual blocks, squeeze-excite blocks, and self-attention mechanisms are among the sophisticated approaches the architecture combines to help it to capture minute details from the images. Resizing the model's input photos to a uniform dimension of 270×135 270×135 pixels helped to enable fit with the deep learning architecture. With a 70:15:15 ratio, the dataset was split into training, validation, and test sets guaranteeing accurate evaluation. Data augmentation using an Image Data Generator applied changes like rotation, scaling, and flips to boost variability and resilience during training. The loss function for the model optimisation was categorical cross-entropy, formally stated as.
$L(y, \hat{y})=-\sum_{i=1}^c y_i \log \left(\hat{y}_i\right)$ (1)
where, $y$ is the true distribution and $\hat{y}$ is the predicted distribution across C classes. The Adam optimiser was chosen because of its adaptive learning features, which enable dynamic change of the learning rate. This improves the crop stress detecting precision of the model. Multiple convolutional layers formed part of the architecture, and channel-wise feature responses were recalibrated using a squeeze-excite method. Under different circumstances, the model's performance was assessed using accuracy as the metric, therefore guaranteeing its ability to clearly differentiate stressed from healthy leaves. We modified hyperparameters including dropout rates, learning rates, and filter count to maximise performance even more and Table 1 shows hyperparameter details apply for improvement of result.
|
Pseudocode for cropstressnet model implementation |
|
1. Import Required Libraries Import necessary libraries: - TensorFlow/Keras for deep learning - NumPy for numerical operations - OpenCV for image processing - Matplotlib for visualization (optional) 2. Data Preparation Load dataset: - Load images and labels for nitrogen-deficient, leaf rust-affected, and healthy leaves - Split dataset into training, validation, and test sets (70:15:15) 3. Image Preprocessing Function preprocess_images(images): For each image in images: - Apply Otsu-based masking to isolate leaf areas - Resize image to (135, 270) pixels - Apply contrast stretching - Apply CLAHE with tile grid size (8, 8) and clip limit of 2.0 Return preprocessed images 4. Data Augmentation Define ImageDataGenerator: - Set parameters for augmentation (rotation, width shift, height shift, horizontal flip) 5. Define Model Architecture Function build_classification_model(input_shape, num_classes): Create input layer Add depthwise separable convolution block Add max pooling layer Add residual block Add squeeze-and-excite block Add convolution and pooling layers as needed Add self-attention block Flatten output Add fully connected layer with ReLU activation Add output layer with softmax activation for multi-class classification Return model 6. Compile Model Set model parameters: - optimizer: Adam - loss function: categorical cross-entropy - metrics: accuracy Compile the model 7. Train Model Fit model on training data: - Use preprocessed images and labels - Set validation data for performance monitoring - Define number of epochs and batch size 8. Evaluate Model Evaluate model on test set: - Calculate accuracy and loss - Optionally visualize results (confusion matrix, ROC curve) 9. Save Model Save the trained model for future use 10. Predict on New Data Function predict(image): - Preprocess the image - Use the trained model to predict class - Return predicted class label |
Table 1. Hyperparameter details
|
Hyperparameter |
Value |
|
Input Shape |
(270, 135, 3) |
|
Number of Classes |
3 |
|
Learning Rate |
0.001 |
|
Batch Size |
32 |
|
Epochs |
50 |
|
Optimizer |
Adam |
|
Loss Function |
Categorical Cross-Entropy |
|
Data Augmentation |
Rotation, Width Shift, Height Shift, Horizontal Flip |
|
Squeeze-Excite Ratio |
16 |
|
Number of Heads |
4 |
|
Key Dimension |
64 |
|
Clip Limit (CLAHE) |
2.0 |
|
Tile Grid Size (CLAHE) |
(8, 8) |
|
Dropout Rate |
0.5 |
The Adam optimizer can be summarized by the following parameter update equation:
$\theta_t=\theta_{t-1}-\frac{\alpha \widehat{m}_t}{\sqrt{\widehat{v}_t+\in}}$ (2)
where,
$\theta_t$: Updated parameters at time (t)
$\theta_{t-1}$: Previous parameters
α: Learning rate
$\widehat{m}_t$: Bias-corrected first moment estimate
$\hat{v}_t$: Bias-corrected second moment estimate
$\in$: A small constant to prevent division by zero
Guiding model optimisation for multi-class classification tasks, categorical cross-entropy quantifies the difference between actual and expected class distributions.
Accuracy
Accuracy evaluates the model's fraction of accurate forecasts. Higher accuracy percentages show that the model shows dependability in real-world applications by efficiently generalising and performing on the validation set.
Accuracy=(TP+TN)/(TP+FP+TN+FN) (3)
Recall
Calculated as the ratio of accurate and false negative forecasts, model recall gauges the capacity to recognise all pertinent class occurrences. Emphasising the model's sensitivity to identify all genuine positives, it is especially important in situations when omitting positive examples increases a risk more than producing false positives.
Recall=TP/(TP+FN) (4)
Precision
Calculated as the percentage of precisely anticipated positive cases among both false positives and right predictions, model precision gauges its capacity to produce accurate positive predictions. When the cost of false positives is considerable, this statistic is essential since it emphasises the accuracy of the model in preventing erroneous positive predictions.
Precision=TP/(TP+FP) (5)
F1 Score
Especially in situations of imbalanced positive and negative examples, F1 score-derived from the harmonic mean of recall and accuracy-offers a fair assessment of model performance. F1 score is appropriate for situations with varying class distributions since it offers a more strong and objective evaluation by combining precision and recall.
F-score=2/(1/precision+1/recall) (6)
Loss
In training, loss measures the variation between expected and actual targets. A smaller loss number shows that the model is learning from the training data efficiently and is thereby improving and producing more accurate predictions over time
Loss $=-\frac{1}{m} \sum_{i=1}^m \mathcal{Y}_i \cdot \log \left(\mathcal{Y}_i\right)$ (7)
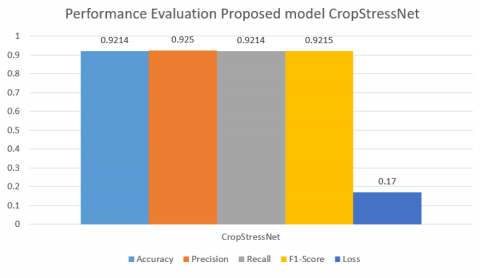
Table 2 presents the performance assessment of the proposed model, CropStressNet, stressing its capacity in precisely forecasting crop stress. With an accuracy of 0.9214, the model shows good performance by accurately categorising over 92% of the cases. With a precision score of 0.9250, CropStressNet forecasts crop stress with dependability, hence reducing false positives. With a recall score of 0.9214, the crop stress may be precisely identified, so guaranteeing few false negatives. With an F1-score of 0.9215, accuracy and recall are balanced, so indicating general strength. Furthermore, the minimal loss of 0.17 points to a well-trained model producing consistent forecasts. Performance graph in Figure 5 shows evaluation of proposed model.
Figure 5. Performance graph
Table 2. Performance evaluation proposed model CropStressNet
|
Model |
Accuracy |
Precision |
Recall |
F1-Score |
Loss |
|
CropStressNet |
0.9214 |
0.9250 |
0.9214 |
0.9215 |
0.17 |
Beyond statistical performance, the model has significant practical implications for precision agriculture. Early and accurate detection of stress symptoms-such as nitrogen deficiency or fungal infections like leaf rust-enables farmers to take timely corrective actions. For instance, precise detection of biotic stress at early stages can lead to targeted fungicide applications, potentially reducing fungicide use by up to 30-40%, as shown in related agronomic studies. This not only cuts input costs but also supports environmentally sustainable farming by avoiding over-application of chemicals. Hence, CropStressNet contributes directly to more efficient, cost-effective, and eco-friendly crop management strategies.
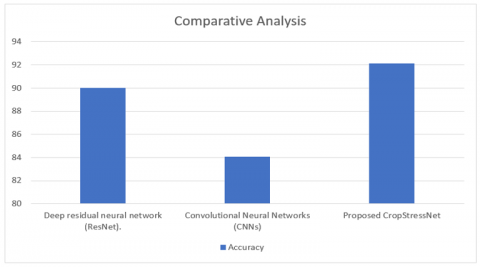
Table 3 offers a comparison of the suggested CropStressNet model with current models, namely with reference to Deep Residual Neural Network (ResNet) and Convolutional Neural Networks (CNN). CropStressNet's performance is assessed using accuracy, therefore indicating a notable improvement in predicting powers in the field of crop stress evaluation. With an accuracy of 90%, the Deep Residual Neural Network (ResNet) proves to be really useful in many different fields. With an amazing accuracy of 92.14%, the suggested CropStressNet does, however, surpass this approach. This development shows a clear increase in the model's capacity to accurately identify cases of crop stress, hence increasing its dependability for agricultural surveillance. By comparison, the conventional CNNs have a less accuracy of 84.1%. This disparity highlights the need of more specialised architectures like CropStressNet by stressing the limits of CNNs in managing the complexity related with crop stress detection. The higher accuracy of the suggested model suggests that, probably because of its architectural innovations and training approaches, it is more suited to capture complex patterns in the data. Overall, the improved performance of CropStressNet shows a significant contribution to the field and promises better decision-making possibilities for farmers and agricultural stakeholders in properly managing crop health.
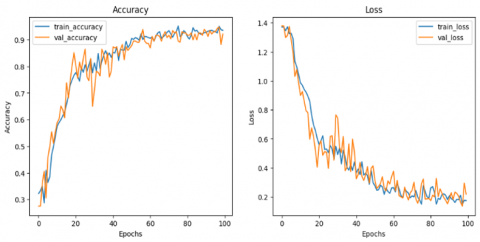
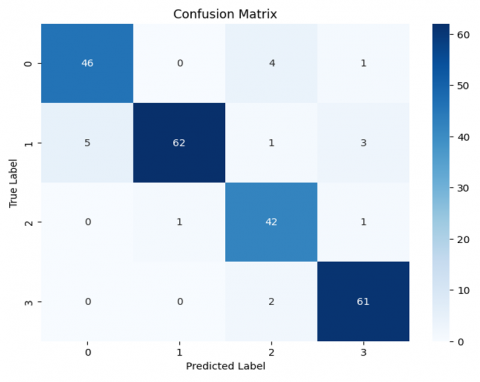
To evaluate the performance of CropStressNet in distinguishing among healthy, rust-infected, and nitrogen-deficient wheat leaves, we generated a confusion matrix that visualizes the model’s classification accuracy across all three classes. This matrix provides insight into both correct predictions and common misclassifications, enabling a deeper understanding of model behavior. Figure 6 shows comparative analysis between ResNet, CNN and proposed model and Figure 7 shows accuracy and loss graph of proposed model.
Table 3. Comparative analysis between existing model and proposed model
|
Model |
Accuracy (%) |
Precision (%) |
Precision (%) |
Ref |
|
Deep Residual Neural Network (ResNet) |
90.00 |
88.50 |
89.20 |
[40] |
|
Convolutional Neural Networks (CNNs) |
84.10 |
82.30 |
83.00 |
[41] |
|
Proposed CropStressNet |
92.14 |
91.50 |
92.14 |
- |
Figure 6. Comparative analysis graph
Figure 7. Accuracy and loss graph of proposed model
From the matrix, it is evident that:
The inclusion of the confusion matrix reinforces the reliability of CropStressNet while also highlighting areas for potential improvement, such as enhancing feature differentiation between biotic and abiotic stress symptoms.
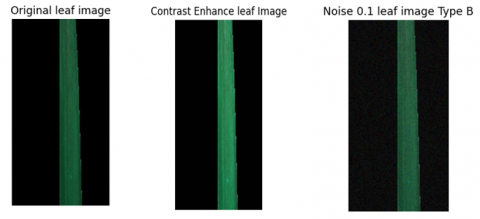
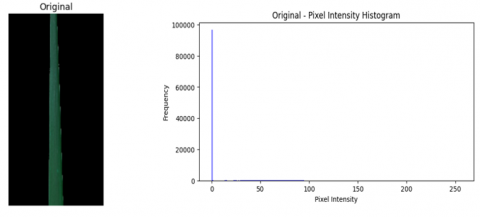
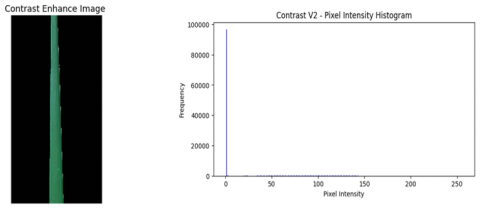
Figure 8 shows the confusion matrix of proposed model. And Table 4 shows confusion matrix of CropStressNet between actual and predicted. Three images of a leaf are presented in Figure 9: the original photograph, a contrast-enhanced version, and a noise-added variant. Whereas the noisy image contains random pixel fluctuations, the contrast-enhanced image offers greater detail visibility.
Figure 8. Confusion matrix of proposed models
Table 4. Confusion matrix of CropStressNet
|
|
Predicted: Healthy |
Predicted: Rust |
Predicted: Nitrogen Deficient |
|
Actual: Healthy |
186 |
8 |
6 |
|
Actual: Rust |
5 |
178 |
17 |
|
Actual: Nitrogen Deficient |
4 |
10 |
183 |
Figure 9. An original picture, a contrast-enhanced variant, and one with additional noise
The picture displays three leaf photos together with matching pixel intensity histograms. Whereas the contrast-enhanced image has a smaller range with more concentrated peaks, the original image contains a wide range of pixel intensities. The noisy image boasts a more homogeneous spectrum of pixel intensities. The histograms show how the methods of image processing influence the pixel value distribution.
Figure 10. Three leaf photos together with matching pixel intensity histograms
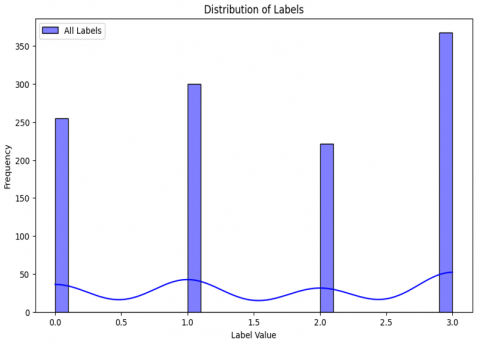
Figure 11. Distribution of labels
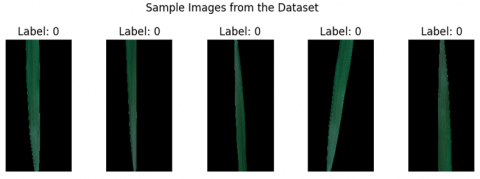
Figure 12. Sample images
Figures 10 presents a group of leaf pictures together with matching labels. Figure 11's histogram shows label distribution; most labels lie between 0 and 1. Five sample photos from the dataset are shown in Figure 12 under each 0. label. Though their exact significance is unknown without more information, the names most likely indicate several leaf types or situations.
In conclusion, this work presents a robust and scalable solution for detecting and classifying multiple stress indicators in wheat crops, particularly nitrogen deficiency and leaf rust. A key innovation of this study lies in the integration of CLAHE during preprocessing, which enhanced the visibility of subtle stress-related features in leaf imagery. In addition, Otsu-based background segmentation and contrast stretching contributed to cleaner, high-quality inputs that improved model learning. The use of Squeeze-and-Excitation (SE) blocks within the CropStressNet architecture enabled adaptive feature recalibration, allowing the model to focus on critical stress-specific patterns. These architectural enhancements, combined with residual connections, provided deeper feature extraction and superior classification performance.
The model achieved impressive accuracy, precision, and recall, supported by a balanced dataset derived through thorough EDA. Hyperparameter optimization further boosted model generalization. Importantly, the lightweight and modular design of CropStressNet promotes field-ready scalability, making it suitable for deployment in resource-constrained agricultural environments. This empowers farmers and agronomists with a dependable tool for real-time crop monitoring and timely intervention, ultimately reducing yield losses and unnecessary chemical use.
By integrating advanced deep learning techniques with practical agricultural needs, this study lays a strong foundation for broader applications in precision farming and contributes to long-term goals of sustainable agriculture and food security.
[1] Nigus, E.A., Taye, G.B., Girmaw, D.W., Salau, A.O. (2024). Development of a model for detection and grading of stem rust in wheat using deep learning. Multimedia Tools and Applications, 83(16): 47649-47676. https://doi.org/10.1007/s11042-023-17434-y
[2] Abdalla, M., Mohamed, O., Azmi, E.M. (2024). Adaptive learning model for detecting wheat diseases. International Journal of Advanced Computer Science & Applications, 15(5): 1287–1298, https://doi.org/10.14569/IJACSA.2024.01505130
[3] Feng, J., Zhang, S., Zhai, Z., Yu, H., Xu, H. (2024). DC2Net: An Asian soybean rust detection model based on hyperspectral imaging and deep learning. Plant Phenomics, 6: 0163. https://doi.org/10.34133/plantphenomics.0163
[4] Joseph, D.S., Pawar, P.M., Chakradeo, K. (2024). Real-time plant disease dataset development and detection of plant disease using deep learning. IEEE Access, 12: 16310-16333. https://doi.org/10.1109/ACCESS.2024.3358333
[5] Patel, J., Pachchigar, A., Patel, J. (2024). LeafGenEx-A novel method for generating healthy and diseased wheat leaf images using CycleGAN. https://doi.org/10.21203/rs.3.rs-4467039/v1
[6] Na, M.A., Yanwen, L.I., Miao, X.U., Hongwen, Y.A.N. (2023). Improved YOLOv8-based automated detection of wheat leaf diseases. Inmateh-Agricultural Engineering, 71(3): 499-510. https://doi.org/10.35633/inmateh-71-43
[7] Jorge Luis Aroca Trujillo, A.P.R. (2023). Technologies applied in the field of early detection of coffee rust fungus diseases: A review. Nongye Jixie Xuebao/Transactions of The Chinese Society of Agricultural Machinery, 54(5). http://nyjxxb.net/index.php/journal/article/view/1627%0Ahttp://nyjxxb.net/index.php/journal/article/viewFile/1627/1621.
[8] Long, M. (2023). Using machine learning to identify and diagnose crop disease. In Advances in Sensor Technology for Sustainable Crop Production. Burleigh Dodds Science Publishing, pp. 285-306. http://dx.doi.org/10.19103/AS.2022.0107.22
[9] Neog, P.P., Batra, S., Saraswat, S., Sharma, E.L., Kumar, P.P., Pandey, A.K. (2023). A brief overview of deep learning based techniques for the detection of wheat leaf disease: A recent study. In 2023 7th International Conference on Intelligent Computing and Control Systems (ICICCS), Madurai, India, pp. 209-217. https://doi.org/10.1109/ICICCS56967.2023.10142846
[10] Cinar, B. (2023). A study on cyber threat intelligence based on current trends and future perspectives. Advances and Challenges in Science and Technology, 37. https://doi.org/10.9734/bpi/acst/v5/6557e
[11] Shafi, U., Mumtaz, R., Qureshi, M.D.M., Mahmood, Z., Tanveer, S.K., Haq, I.U., Zaidi, S.M.H. (2023). Embedded AI for wheat yellow rust infection type classification. IEEE Access, 11: 23726-23738. https://doi.org/10.1109/ACCESS.2023.3254430
[12] Ju, C., Chen, C., Li, R., Zhao, Y., Zhong, X., Sun, R., Liu, T., Sun, C. (2023). Remote sensing monitoring of wheat leaf rust based on UAV multispectral imagery and the BPNN method. Food and Energy Security, 12(4): e477. https://doi.org/10.1002/fes3.477
[13] Donu, J.V., Santhi, K. (2023). Real time classification and detection of apple leaf diseases at early stage by employing enhanced paddy field pattern search method (EPF-PSM) with 2LC. Indian Journal of Science and Technology, 16(22): 1682-1693. https://doi.org/10.17485/IJST/v16i22.1206
[14] Chang, C.Y., Yang, S.X., Zhang, M.Q., Guo, Y.T., Li, X.M., Yan, Y., Ding, C.H., Niu, K.X., Wang, M.L., Li, Q.Q., et al. (2023). Suppression of zeaxanthin epoxidase 1 restricts stripe rust growth in wheat. Plant Communications, 4(5): 100608. https://doi.org/10.1016/j.xplc.2023.100608
[15] Kremneva, O.Y., Danilov, R.Y., Sereda, I.I., Tutubalina, O.V., Pachkin, A.A., Zimin, M.V. (2023). Spectral characteristics of winter wheat varieties depending on the development degree of Pyrenophora tritici-repentis. Precision Agriculture, 24(3): 830-852. https://doi.org/10.1007/s11119-022-09976-2
[16] Blasch, G., Anberbir, T., Negash, T., Tilahun, L., Belayineh, F.Y., Alemayehu, Y., Mamo, G., Hodson, D.P., Rodrigues Jr, F.A. (2023). The potential of UAV and very high-resolution satellite imagery for yellow and stem rust detection and phenotyping in Ethiopia. Scientific Reports, 13(1): 16768. https://doi.org/10.1038/s41598-023-43770-y
[17] Singh, R.N., Krishnan, P., Singh, V.K., Sah, S., Das, B. (2023). Combining biophysical parameters with thermal and RGB indices using machine learning models for predicting yield in yellow rust affected wheat crop. Scientific Reports, 13(1): 18814. https://doi.org/10.1038/s41598-023-45682-3
[18] Yuan, L., Zhang, J.C., Deng, Q., Dong, Y.Y., Wang, H.L., Du, X.K. (2023). Differentiation of wheat diseases and pests based on hyperspectral imaging technology with a few specific bands. Phyton-International Journal of Experimental Botany, 92(2): 611-628. http://doi.org/10.32604/phyton.2022.023662
[19] Ganesh Babu, R., Chellaswamy, C. (2022). Different stages of disease detection in squash plant based on machine learning. Journal of Biosciences, 47(1): 9. https://doi.org/10.1007/s12038-021-00241-8
[20] Avinash, P., Ramathilaga, A., Valarmathi, P. (2022). Hyperspectral remote sensing for discrimination for plant disease forecasting: Review. Journal of Pharmacognosy and Phytochemistry, 11: 208-215.
[21] Ma, C., Dong, J., Ding, F., Li, C. (2022). Monitoring and prediction of wheat stripe rust based on hyperspectral and meteorological data. Research Square. https://doi.org/10.21203/rs.3.rs-1410519/v1
[22] Long, M. (2022). Deep learning for the identification and quantification of wheat disease. Doctoral dissertation, University of East Anglia.
[23] Genaev, M.A., Skolotneva, E.S., Gultyaeva, E.I., Orlova, E.A., Bechtold, N.P., Afonnikov, D.A. (2021). Image-based wheat fungi diseases identification by deep learning. Plants, 10(8): 1500. https://doi.org/10.3390/plants10081500
[24] Sharma, S., Sharma, R., Kumar, R. (2021). Pest detection in plants using convolutional neural network. International Journal for Research in Applied Science and Engineering Technology, 9: 1583-1592, https://doi.org/10.22214/ijraset.2021.38890
[25] Bohnenkamp, D., Behmann, J., Paulus, S., Steiner, U., Mahlein, A.K. (2021). A hyperspectral library of foliar diseases of wheat. Phytopathology®, 111(9): 1583-1593. https://doi.org/10.1094/PHYTO-09-19-0335-R
[26] Olana, M.D., Rajesh Sharma, R., Sungheetha, A., Chung, Y.K. (2021). Applying deep learning approach for wheat rust disease detection using MosNet classification technique. In Inventive Computation and Information Technologies: Proceedings of ICICIT 2020, pp. 551-565. https://doi.org/10.1007/978-981-33-4305-4_41
[27] Aharoni, R., Klymiuk, V., Sarusi, B., Young, S., Fahima, T., Fishbain, B., Kendler, S. (2021). Spectral light-reflection data dimensionality reduction for timely detection of yellow rust. Precision Agriculture, 22: 267-286. https://doi.org/10.1007/s11119-020-09742-2
[28] Poornappriya, T.S., Gopinath, R. (2022). Rice plant disease identification using artificial intelligence approaches. International Journal of Electrical Engineering and Technology, 11(10): 392-402. https://doi.org/10.34218/IJEET.11.10.2020.050
[29] Lee, C.C., Koo, V.C., Lim, T.S., Lee, Y.P., Abidin, H. (2022). A multi-layer perceptron-based approach for early detection of BSR disease in oil palm trees using hyperspectral images. Heliyon, 8(4): e09252, https://doi.org/10.1016/j.heliyon.2022.e09252
[30] Liu, R., Lu, J., Zhang, L., Wu, Y. (2022). Transcriptomic insights into the molecular mechanism of wheat response to stripe rust fungus. Heliyon, 8(10). https://doi.org/10.1016/j.heliyon.2022.e10951
[31] Dewangan, A.K., Kumar, S., Chandra, T.B. (2022). Leaf-Rust and nitrogen deficient wheat plant disease classification using combined features and optimized ensemble learning. Research Journal of Pharmacy and Technology, 15(6): 2531-2538. https://doi.org/10.52711/0974-360X.2022.00423
[32] Zhang, T., Yang, Z., Xu, Z., Li, J. (2022). Wheat yellow rust severity detection by efficient DF-UNet and UAV multispectral imagery. IEEE Sensors Journal, 22(9): 9057-9068. https://doi.org/10.1109/JSEN.2022.3156097
[33] Malladi, R., Gogineni, R.C. (2021). Identification of rust diseases in wheat crop using image analysis. Advances and Applications in Mathematical Sciences, 20(12): 3379-3387.
[34] Bukhari, H.R., Mumtaz, R., Inayat, S., Shafi, U., Haq, I.U., Zaidi, S.M.H., Hafeez, M. (2021). Assessing the impact of segmentation on wheat stripe rust disease classification using computer vision and deep learning. IEEE Access, 9: 164986-165004. https://doi.org/10.1109/ACCESS.2021.3134196
[35] Hamila, O., Henry, C.J., Molina, O.I., Bidinosti, C.P., Henriquez, M.A. (2024). Fusarium head blight detection, spikelet estimation, and severity assessment in wheat using 3D convolutional neural networks. Canadian Journal of Plant Science, 104(4): 358-374. https://doi.org/10.1139/cjps-2023-0127
[36] Doroshenko, O.V., Golub, M.V., Kremneva, O.Y., Shcherban’, P.S., Peklich, A.S., Danilov, R.Y., Gasiyan, K.E., Ponomarev, A.V., Lagutin, I.N., Moroz, I.A., Postovoy, V.K. (2024). Automated assessment of wheat leaf disease spore concentration using a smart microscopy scanning system. Agronomy, 14(9): 1945. https://doi.org/10.3390/agronomy14091945
[37] Liu, W., Chen, Y., Lu, Z., Lu, X., Wu, Z., Zheng, Z., Suo, Y., Lan, C., Yuan, X. (2024). StripeRust-pocket: A mobile-based deep learning application for efficient disease severity assessment of wheat stripe rust. Plant Phenomics, 2024: 0201. https://doi.org/10.34133/plantphenomics.0201
[38] Wen, X., Maimaiti, M., Liu, Q., Yu, F., Gao, H., Li, G., Chen, J. (2024). MnasNet-SimAM: An improved deep learning model for the identification of common wheat diseases in complex real-field environments. Plants, 13(16): 2334. https://doi.org/10.3390/plants13162334
[39] Arya, S., Singh, B. (2020). Wheat nitrogen deficiency and leaf rust image dataset. Mendeley Data, 1: 2020. https://doi.org/10.17632/TH422BG4YD.1
[40] Schirrmann, M., Landwehr, N., Giebel, A., Garz, A., Dammer, K.H. (2021). Early detection of stripe rust in winter wheat using deep residual neural networks. Frontiers in Plant Science, 12: 469689. https://doi.org/10.3389/fpls.2021.469689
[41] Mumtaz, R., Maqsood, M.H., ul Haq, I., Shafi, U., Mahmood, Z., Mumtaz, M. (2023). Integrated digital image processing techniques and deep learning approaches for wheat stripe rust disease detection and grading. Decision Analytics Journal, 8: 100305. https://doi.org/10.1016/j.dajour.2023.100305