Hymavathi Thottathyl*![]() | Karteeka Pavan Kanadam
| Karteeka Pavan Kanadam![]()
© 2025 The authors. This article is published by IIETA and is licensed under the CC BY 4.0 license (http://creativecommons.org/licenses/by/4.0/).
OPEN ACCESS
Breast cancer is a type of cancer that originates from breast cells and therefore it is called so. Among women breast cancer is the most frequently diagnosed type followed by the skin cancer as the second most common type. While men are little more likely to be diagnosed with breast cancer, women statistically have higher probability of getting the disease. This is since clinical behaviors are not static and can assume many forms and hence getting clinical predictions and diagnoses right using clinical data is quite complicated. Researchers look at the genome in its entirety to determine a better way of making some of these predictions early in life. The data utilized for creating this article’s dataset was obtained from The Cancer Genome Atlas (TCGA) and the METABRIC dataset. In this work, we attempted to predict the breast cancer gene with the assistance of the deep learning differential evaluation based long short term model (DE-LSTM). The DE-based clusters were at the beginning used to determine which gene is the most significant, while the LSTM model as deep learning was applied later. LSTM is especially helpful when it comes to identifying gene patterns which are likely to contribute to the growth of breast cancer.
cancer, gene data, deep learning, long short term model (LSTM)
Breast cancer is the second most leading cause of death, the first being lung cancer followed by breast cancer mostly affecting women. Further, the heritable BRCA1 and BRCA2 genes were implicated in most of the 5-10% of cancer incidences, which stemmed from genetic factors. It is not an easy task to diagnose the early stage but as indicated, it is very crucial. The probability of surviving an uncontrolled form of cancer also increases based on the period elapsed between the manifestation of the disease and identification of the same. More than ninety percent of the time, the lumps that are felt are not cancerous tumors but simple swellings. The approach that is taken to diagnosed cancer is done using a standard pattern of diagnostic tests [1, 2].
The first and a primary step is to perform a patients’ history assessment, beginning with the overall medical history. That is why a mother should undertake a physical examination to check for any perceptible cryptograms including viscosity and faintness of the breast tissue as well as the likelihood of the presence of lumps and to find out whether any family member possesses the altered genes in vital breast cancer genes. This can be done by searching for any detectible indicates like breadth and malleability of the skin together with size of lumps. Despite the steps talked about above, there are some situations where medical personnel are in doubt as to whether the patient has breast cancer, or if yes, what stage of the disease the patient is at. As a direct consequence of them, medical experts must act in biopsies. Besides, other necessary investigations corresponding bloodline tests, urine test, any other molecular/ genetic tests and other imaging like X-ray, PET/CT scans, MRI, and so on can be conducted. The classification algorithms then use these data to place the samples into three categories: In this category we find people with low risk, people with high risk, and those with several stages of the disease. Based on the details of diagnosis given by the physician, there are many kinds of data where in some cases, there is more than one type of data existing. They may look like you could not find any relation between some of them briefly. The actuality in identifying patient data that requires maximum effort to read accurately is the probability that a person may develop cancer based on his/her genetic make-up. This is attributed to the fact that thousand genes of a body have an intertwined relationship and function to cause this phenomenon.
On the other hand, there are genes such as the BRCA1 gene, the BRCA2 gene and the Abraxas gene among others. These genes are associated with breast and / or ovary cancer. This is in light that mutations in the genes discussed above have been considered the cause of breast cancer. Reduced or absent function of these proteins increases sensitivity to DNA damaging agents and impairs the ability of cells to maintain genomic stability through homologous recombination repair. The risk of getting breast cancer varies depending on the specific gene mutation; however, the lifetime risk reaches 45 to 65% for individuals with BRCA1 and 40-57% for BRCA2.
The most obvious use of computers as a valuable tool in addressing physicians and a cancer diagnosis is the prediction of cancer stages depending on the changes in genes for body cells. This is the most unexplored but promising area of research, especially in the field of cancer genomics. In addition to the accuracy of prediction, there is another problem: Many genes and interactions between genes and diseases, which have not been revealed yet are involved. Depending on the genetic diagnosis utilization, the diagnosis will include expertise, where genes are picked by hand if not automated with machine learning algorithms. To overcome this challenge which was earlier labeled as the “Curse of Dimensionality,” the techniques of dimensionality reduction are employed. As we have earlier explained while using an automated system, a higher level of diagnosis is achieved without the high false positive cancer detentions which lead to a lot of cancer operations that are not necessary. Besides, it does not allow unnecessary cancer treatment to be used with a patient. This can be regarded as the strongest or basic argument that can be put forward in support of using such a system. The study conducted in the laboratory in MIT is an example of geared research that shows how it is imperative to update to offer accurate results and forecasts. These groups collaborated to create an algorithm that can differentiate between lymphoma in real-time. To train the computer model, they used many pathology data sets which were in their hundreds. As evidenced by the results of the implementation test, it was possible to conclude that the algorithm had great potential which had not been fully realized [2].
Thus, the purpose of this article is to determine the most important gene underlying breast cancer. The first one is the DE-based clusters for identification of the most important gene and the second one is the LSTM model which belongs to the deep learning model. According to the results, LSTM is very accurate when it comes to predicting what gene patterns are likely to influence the development of breast cancer. The rest of the article is organized as follows: In Section 2, we will review prior research that has been conducted regarding the diagnosis of cancer using a host of diverse high-dimensional data sets. This has been done in the past in a bid to make the study more meaningful. In Section 3, a set of recommendations that, in the author’s opinion should be followed, are presented. In Section 4 that also contains additional information about the data analyzed concerning DNA methylation and some of the conclusions derived from the analysis of the DNA data, there is an extended discussion of the results obtained within the studies. The fourth segment of this paper will give some brief recommendations and the last, the fifth segment, will conclude this paper.
Over the last two decades a noticeable trend has emerged to utilize the tools of artificial intelligence in cancer prediction. Most of the data set include the thousands of information fields. Inaccurate prediction of event occurrence is contributed by extra attributes, which are noise and irrelevant data. Thus, all the benefits derived from ELM were utilized in the research discussed in several studies [3-7]. Still, the fact is the existence of many dimensions acts as the main limitation which hinders such investigations from revealing their full potential (the one which categorizes genes based on their expression and groups people).
Writing in the article, Pashaei et al. [1] developed a Nov classifying system that analyzed brain tumors into three different groups: meningioma, glioma, and pituitary tumor. This was attained using CNNs for the feature extraction operation. The CNN was constructed using five layers: There is one fully connected layer, four pooling layers and four convolution layers. That is followed by KERNEL BASED ELM to classify these features as being relevant or not. CNN-KELM was shown to achieve good performance compared to other classifiers as represented by SVM as well as Radial Base Function classifiers.
Yousefi et al. [2] compared Bayesian optimal model with the GBMLGG, BRCA, and KIPAN diseases and the datasets associated with them, the predictive accuracy of these methods was assessed. These feature sets were considered jointly with and without all the others involved. These two feature sets were consolidated and made into a single package. It is possible to predict the risk of the development of breast cancer recurrence using a combination of the presented data mining tools.
Yuvaraj and Vivekanandan [3] have done dimensionality reduction by using NMF technique effectively. It means the normal size of a dataset is on the scale of more than one thousand individual dimensions. Some of the problems that could make it even more difficult to make predictions are the many features that are redundant available data noisy data and irrelevant data. Furthermore, it can also be claimed that competition remains in the sphere of the split in precise classification.
According to Liu et al. [4], to tackle the problem of addressing the imbalanced datasets, cost-sensitive parameters should be adopted in the process of categorization. This is important because most of the data sets that have been employed in analyzing gene expression are biased.
For reducing the dimensionality, Si et al. [5] have put forward a dimensionality reduction strategy which employs the technology of DNNs. The RBM, which is characterized by binary input and output units, complies with the bounded bearings characteristic of DNA methylation data; more to the point, their independent learning capability permits the acquisition of low-dimensional features successfully and autonomously. The proposed DNN satisfies the bounded support attribute of the DNA methylation data since the RBM used has input and output units, both of which are binary. The error rate achieved for the experiments is 2 percent, which shows the ability of the low dimensionality of the DNN to distinguish between normal and cancerous samples. 7%. While the demonstrated probabilistic mixture model-based approaches have their limitations that do not make them as advantageous as the DNN-based approach described here:
Using the existence or the absence of cell nuclei, George et al. have classified breast cancer. They have started using probabilistic neural networks and SVM for achieving this end (SVM). In the experiments, the images of the breast cytology were used, and the assessment and comparison of the results were made by using a few prominent measurements such as the percentage of false positive results, the true positive rate, the sensitivity, and the specificity. Cytology images of breast cancer were incorporated into the process of diagnosing breast cancer. They argue that their methods produce outcomes, which are substantially more reliable and that can be applied to different datasets [6].
Both, the so-called ‘classic’ machine learning, or ML for short, and deep understanding were employed by Sharma and Mehra [7] in the extensive investigation into breast cancer classification they published, known as DL. They developed picture features by the colour histogram and the Haralick textures and used the features to differentiate the tumours to benign and the malignant. The performance of the findings by using the proposed method was 93 percent accurate. 25 and 93. 97 percent. Chugh et al. [8] published a comprehensive meta-analysis about the role of employing ML as well as DL in the diagnosis of breast cancer. The investigations into breast cancer categorization and literature other parts of the evaluation were considered comprehensively extensively. Not only did they draw attention to the methods themselves, but they also drew attention to the characteristics of the methods, positive aspects of the plans and the flaws of the plans. Other authors of this study that sought to determine the suitability of deep learning algorithms as applied to breast cancer photo categorization concluded that deep learning algorithms are considerably more suitable when the data sets are larger. It was one of the findings when they compiled the results of several different works: In this case they found the following. In the same study, Houssein et al. [9] gave details of how deep learning and machine learning algorithms can be applied to detect and categorize breast cancer based on images acquired from medical scans. They also showcased today’s most advanced DL tool instances for diagnostics and emphasized the rising importance of artificial intelligence and deep learning in medicine.
In their work, Hamed et al. [10] have made suggestions that classification of breast cancer can best be done by machine learning-based models [11]. Tiwari et al. [12] classified breast cancer pictures with the use of Wisconsin Breast Cancer Dataset. The researchers state that the medical practitioners can diagnose and classify breast cancer at an accuracy of approximately 79% as stated by the authors while the author’s proposed method has accuracy of approximately 91%. Thus, 30 characteristics were assessed, and the number of samples reaches 569. After it has been worked on, the dataset was uploaded to the Kaggle repository to the right category. We used a ratio of the sample to the outlined problems as the measure for their work’s quality. Their attack methods it utilized were logistic regression, SVM as well as a K Nearest Neighbour simulated neural network. They have utilized each of them individually in as much as they have sought to derive the intended effects from them. By so doing, they would be able to classify photos of breast cancer with a maximum of 99% accuracy. 3 percent on average.
We have a four-deep CNN presented by Ragab et al for the purpose of breast cancer classification. They were able to tell what features were included in each photo from the deep neural networks which had been built by them earlier. SVM classifier proceeded working with the preceding feature while researching new kernels at the same time. During this inquiry, the use of principal component analysis was made to reduce the size of the feature vector. They claimed that the kind of results that their state of art CAD system yielded were far better than those of other state-of-the-art CAD systems [13]. Ashraf et al. [14] employed deep learning in the study they conducted to develop an effective approach for skin cancer classification. For this purpose, a real-time dataset was obtained from the DHQ of Faisalabad which is in Pakistan. They were also able to classify photos of skin cancer including melanoma and non-melanoma based on the parameters mentioned above. The data they gave positively pointed to the fact that the classification was right in ninety three percent correct. The driver was found to be stressed 29 percent of the time.
Speaking of the research done by Aneta et al. [15], there is one strategy that combines the older model of information management and the newer one. Specifically, in this combination technique, the categorization is performed by using the outcomes obtained from the molecular data sets thus bringing into consideration a larger number of clinically pertinent features [16-19] as may be deemed relevant. For this reason, there are changes for a better diagnosis to be made. Subsequently, these findings are considered as new artificial variables, and the pre-mentioned steps are performed iteratively as many a times until a conclusive result is obtained. To perform other investigations, both datasets were combined.
In particular, Islam et al. [20] and others argued that the integration of multi-omics profiles to classify breast cancer subtypes is unsteady as the data sets are large and linked. DNN learning is also known as deep neural network learning and is known to be much more effective than other methods. As a self-contained learning technique, DNN learning can provide an analysis of high-dimensional and interconnected data from raw form. This capability does not depend on any built-in feature that exists from the operating system from which it originated.
El-Nabawy and Belal [21] have also brought up five different classifications of breast cancer. Heterogeneity inside the tumour is also evident because every type of breast cancer has its own specific traits. Through this kind of analysis, the two SVM classifiers namely Linear-SVM and E-SVM were applied to classify the subtype in relation to the o gene. Multiple kinds of data descriptions are accompanied by attributes that are extracted from histopathology pictures. Therefore, our study advances knowledge on breast cancer classification because the use of feature fusion from different METABRIC datasets leads to better subtypes classification accuracy. This brings value to the area since it established another approach through which this performance could be enhanced. In the current study, Hou et al. [22] used CNN as the technique in categorizing the whole slide imaging dataset of lung and brain cancer subtypes. The recall of the CNN model for diagnosing brain cancer is 83.3 percent, while the accuracy for lung cancer diagnosis using the CNN approach is 79.8 percent.
The deep learning and machine learning [23, 24] other related models, though very effective, have been shown to be less useful in gene data analysis due to the huge dimensionality and sparsity associated with gene datasets which causes the models to over-fit the analysis to the available datasets. These models also need large-scale labeled training sets, which can be difficult to come by in genetic studies. Furthermore, as they are black box algorithms, it is challenging to understand the biological meaning of such outputs. In addition to this, computational cost and necessity of many hyperparameters to be optimized make them even more difficult to apply in gene data analysis especially when there are many domains specific adjustments to make.
Clustering aids in the process of understanding genes and what these genes provide fulfilment, gene regulation, cellular functions, and cellular subtypes. When genes are co-expressed this reveals that the genes are expressed in same pattern thus making it easy to associate genes with similar biological functions. This approach may help to understand the purpose of different genes which may affect the development of cancer. This suggests that there is common regulatory control of the above stated genes because they have similar patterns of expression. Also, HR genes of the co-expressed genes to the same cluster show high probability of having standard biological role. It helps to explore genes since genes with similar patterns of expression and different conditions or time points are grouped to determine if they may be coregulated or functionally affiliated. This process assists in finger printing of gene networks, studying biological processes and deducing gene functions. For instance, hierarchical clustering builds a tree-like structure from the genes and also presents the relationships at multilevel, whereas k-means clustering categorizes the genes into different clusters, best suited to their expression pattern. Such insights are vital to decode other associated biological patterns on system level like genomics of cancer.
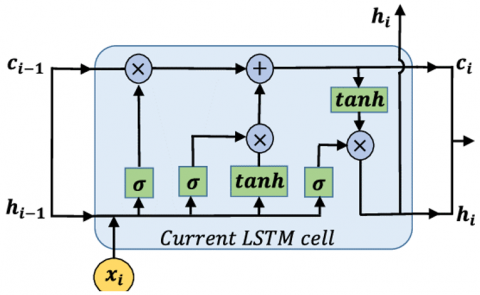
Figure 1. LSTM model
The identification of the similar DNA sequences of the promoter region of genes, which belongs to the same group, makes it possible to identify specific regulatory motives among the genes that are grouped and to make hypotheses about cis-regulatory elements that are unique among the genes in a particular group [9]. Some assumptions about the transcriptional regulatory network mechanism can also be derived from the inference of regulation from the analysis of microarray gene expression clusters [16]. To look at each of the named presumptions more thoroughly, here’s what we will do below. Finally, it must be noted that sub-cell types that cannot be characterised by undergoing conventional morphological analysis of the different samples may be revealed when the samples are categorised based on their expressed patterns. Breast cancer genes expression data are then analyzed using the DE method. By using DE model, the gene expression data is revived and then ranked into groups of two to ten to identify the groups that are closest to a true value. And use the deep learning-based LSTM model to train with the model to develop the most influencing gene on Brest cancer, the structure is shown in Figure 1.
Those genes performing similar biological functions can be linked to the other genes that display similar expressions patterns which are known as co-expressed genes. Possibly this approach may allow a greater insight into activities of a vast number of genes for which data has not been available earlier. The high positive correlation test that connects the expression details of those gens shows that the gens control each other. Also, it is postulated that when genes are in the same cluster, the amount of expression of these genes is more likely to be involved in the same functional activities. Due to the identification and the subsequent definition of the regulatory motifs specific for the gene clusters, and the suggestion of the cis-regulatory elements specific for the gene clusters [9], the similarities of the DNA sequences in the promoter regions of the genes that compose the gene clusters are sought. The inference of regulation from the analysis of the gene expression data also generates assumptions regarding the nature of the transcriptional regulation network [16]. It is these assumptions that will be discussed in this section in more detail with a view of establishing how they affect the value, risks, costs and time of the project. In other words, grouping separate samples by the similar expression patterns of mRNAs could help to determine the existence of sub-cell types, which cannot be revealed by conventional methods based on morphology.
|
Algorithm-1: DE for Brest cancer gene clustering |
|
Data: PS: population size, M: mutation factor, COP: crossover probability, Max MFS: maximum number of functions evaluations INITIALIZATION H=0; Initialize all PS individuals with random positions in the search space. While MFS < MAX MFS Do for I ← 1 to PS Do GENERATE Three individuals $x_{p 1}, x_{p 1}, x_{p 1}$ from the present population arbitrarily. The elements in question must be distinguishable not just from one another but also from the individuals $x_k$ i.e., $p 1 \neq p 2 \neq p 3 \neq k$ MUTATION To create the donor vector, fill in the given equations: $W_k=x_{p 1}+F\left(x_{p 2}-x_{p 3}\right)$ CROSSOVER The experimental vector might be constructed using the target vector's constituent parts or from scratch $x_k$ or the components of the donor vector $W_k$ as observes: $\begin{gathered}W_{k, l}=\left\{Z_{k, l}, \text { if } p_{k, l} \leq C R \text { or } l={ lrand }\right. \\ P_{k, l~{ othervie }}\end{gathered}$ where k= {1, ..., PS}, l= {1, ..., D}, $P_{k, l} \sim$ W (0, 1) is a randomized integer with the same probability assigned to each l and lk, and Î {1, ..., D} is an arbitrary number used to guarantee $W_k \neq x_k$ in all cases EVALUATE If $f\left(W_k\right) \leq f\left(x_k\right)$ then substitute the distinct $x_k$ in the population with the trial vector $W_k$ MFS=MFS+ PS end H=H+1; End |
For the RES data it employs the DE algorithm (algorithm-1) wherein data on the expression of the breast cancer genes have been used. Start with the dataset of gene expression, employ the pre-process DE model to the gene expression dataset and then continue to make clustering’s from as far as 2-10 clusters to identify cluster that has greatest convergence.
From the algorithm-1, we can develop most influenced gene by focusing on the cluster convergence Then the result is given to the LSTM algorithm illustrated in algorithm-2. And furthermore, we used the LSTM model to train and predict for the new gene data.
|
Algorithm-2: LSTM for Brest cancer most influenced gene |
|
Input: Genomic data Output: A prediction model Begin Step 1: Initialize input data weight: Wa, Wb, Wc, Wd Step 2: Initialize Intermittent data Weight: Ta, Tb, Tc, Td Step 3: Initialize aperture weight: V ∈TN Step 4: Initialize Equalizer: Pa, Pb, Pc, Pd ∈ TN Step 5: At moment s, xs is the response, and ys is the yield of the node Step 6: bs= $\sigma$ (Wbxs+ Tshs-1+ Pb) is the result of the forget gate being activated at time s Step 7: it= $\sigma$ (Waxs+ Rahs-1+ Pa) is the signal that comes out of the input gate now s Step 8: Ćs, Cs is indeed the input as well as the cell size of a base station at time s, that are in both conveyed as Ć = tanh (Wcxs+ Rchs-1+ Ps) C = as⊙Ćs+ fs⊙cs-1 Step 9: Os = $\sigma$ (Wdxs+ Rdhs-1+ Pd) is the result of the output gate being activated Step 10: The finishing output hs of the node is communicated: h = Os ⊙ tanh (Cs) End |
DE-LSTM optimizes the classification of breast cancer genomic data by integrating the capability of LSTMs in sequential learning and the optimization probability of DE. DE optimizes hyperparameters for better LSTM’s performance and generalization at the same time being able to better learn intricate features in genomic sequences. This is because the synergy between the ensemble of such models yields in higher reliability than models used singularly.
4.1 Dataset
As a part of the large-scale TCGA national effort, which aimed at providing molecular characterization of adult cancer samples, 33 kinds of cancer were molecularly characterized using 20,000 fresh original cancer samples and matched standard samples for 11,595 patients. This research was initiated in 2006, and it has been coordinated through the former National Cancer Institute and National Human Genome Research Institute and involved many experts from different fields of specialization and many universities. The data from TCGA was accumulated to be about 2. over ten years such genomic, epigenomic, transcriptomic and proteomic data that would amount to 5 terabytes of information. The knowledge has already improved the ability to diagnose, treat, and prevent cancer and will remain accessible so that anyone in the scientific field wishes to do so can. The dataset analyzed in this work includes 1108 breast cancer and 113 normal tissue samples with comprehensive genomic and transcriptomic data.
The METABRIC database has been created with the help of sequenced targeted data collected from about 1980 primary breast cancer samples in collaboration between Canada and United Kingdom. It should be noted that the initiation and progression of breast cancer are partly genomic, partly transcriptomic, as well as partly epigenomic. They employ the BRCA from TCGA; it included transcript gene expression and physical mutation. BRCA gene stainers collection contains 1228 samples and over 57063 genes in The Gene Expression Omnibus database. In total there are 1109 samples of tumor and 113 samples of normal tissue. Next, we used edge R for the purpose of eliminating the genes that were barely expressed in most cases, and we used edge R for the purpose of the data transformation.: In the end, our study’s results were summarized. The genes whose expression level was low or moderate in most sample were filtered out which means the total subjects’ gene expression profile decreased from 57,063 to 34,465. These data consist of 2,509 breast cancers with clinical information for use in comparative and survival analysis.
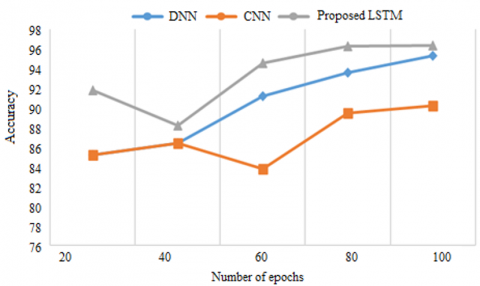
Figure 2. Accuracy of METABRIC
Figure 2 also shows the accuracy comparison between existent DNN, CNN and proposed LSTM models for the forecast of the most influenced gene. The figure depicts that the d developed LSTM models yield better performance in the case of forecasting the most influenced gene in METABRIC dataset since the LSTM memory unit assists in tracing the influence of gene sequence in making breast cancer. While existing CNN and DNN also give accuracy of nearly 90%, the present model is not given better than LSTM because the latter cannot store sequence.
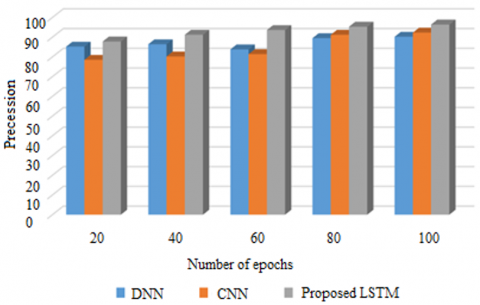
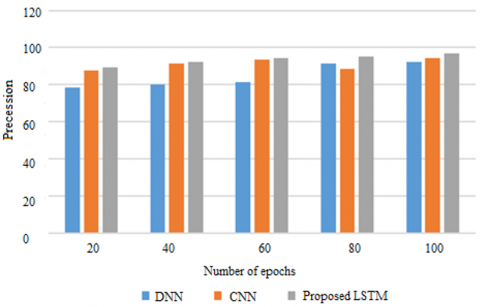
Figure 3. Precession on METABRIC
Among statistical measures, the effectiveness of a model to accurately assign a sample as positive or negative is characterized as precision. The precession of the proposed LSTM model and the current CNN and DNN models is shown here in Figure 3 on METABRIC dataset. As to the parameters presented at the chart: the x-axis is given to the epochs, and the y-axis is given to precession. Check on the model for a hundred different time period. The proposed model is convenient for the handling of genetic data and prognosticates at an accuracy of 97% into the memory unit. Previous models acquired more than 90% of information since they did not learn the sequential genetic influences which predisposes a woman to breast cancer.
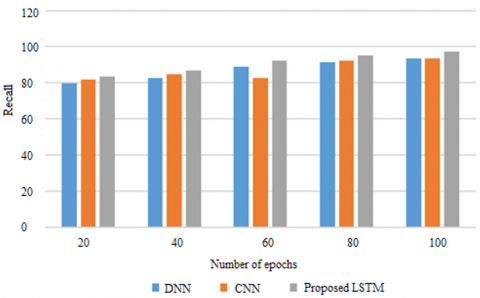
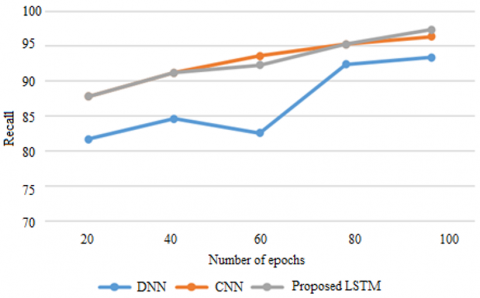
Figure 4. Recall on METABRIC
Recalling the positive samples ratio to the total of Positive samples to the Positive samples which were classified as such. Recalling a model gives an insight into how efficient it can be to recognize positive samples. As the recall rate rises, the number of positive samples discovered rises as well. The recall comparison of the suggested LSTM with existing CNN and DNN models are presented in Figure 4 based on METABRIC data. Recall is displayed on the y axis while the epochs are on the x axis. To assess the model, use 100 epochs. The proposed approach achieves its proposed goal of 2 to 5% better recall as compared to the existing models which do not improve the recall while handling genetic data.
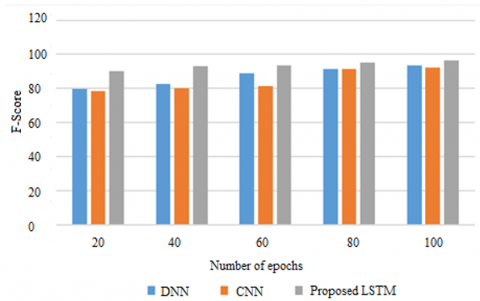
Figure 5. F-score on METABRIC
Recall as well as accuracy is doubled and the results are then divided by both, to arrive at the F1 Score. Depending on the geographical location, one might become familiar with the term ‘F Score’ but if not then perhaps ‘F Measure’ will ring a bell. The F1 Score on the other hand presents in a way for the better or the worse, the perfect balance of the precision and the recall under a given condition. From Figure 5, it is clear about the F1 Score of the METABRIC dataset as compared to the current CNN and DNN models and the LSTM model which has newly introduced here. On horizontal axis are epochs and on the vertical axis is the F1-score. Let’s test a thousand different periods, as an example of how the model works. Predicting the most affected gene in aggressiveness of breast cancer, the proposed model gives higher F-score compared to current CNN and DNN models.
Explained in Figure 6 is a comparison of the predictive accuracy of three different types of neural network models: existing DNNs, CNNs as well as a proposed LSTM model. On the picture the proposed LSTM model successfully defines the gene in the TCGA set, which is most affected by other genes. While LSTM memory unit helps to remember the gene sequences that are involved in the genesis of breast cancer, other existing CNN and DNN models improve the accuracy at altered numbers of epochs. But even in this case they are not as good as LSTM because they cannot remember the sequence.
Figure 6. Accuracy of TCGA
Figure 7. Precession on TCGA
The ability of a selected percentage of samples tested with favorable results out of the total analyzed samples appropriately categorized as positive (whether accurately or inaccurately so classified) is known as the “positive samples of adequate classification”. The accuracy of a given model depends on its ability to either identify whether a given sample is positive or negative. In Figure 7 we present the procession of the proposed LSTM model on the TCGA dataset with the existing CNN and DNN models. The epochs are marked at the horizontal axis while the precession is marked on the vertical axis of the graph. Try it out in a hundred different years, and you’ll likely be dissatisfied with the results. The recommended model has a memory unit which enhanced its working with genetic data and gave a success rate of 96%. The current models collected approximately 90% of the information but failed to capture the genetic effects at the sequence level involved in breast cancer.
In case of calculating recall, it is essential to consider the proportion of the genuine Positive samples among the total number of Positive specimens. Recall is the measure of the ability of a model in identifying positive samples as explained in the following section. The list of representatives that will be tested will simply increase and, in the process, more positive samples will be observed. The recall comparison between the proposed LSTM model and the already discovered CNN and DNN models and was achieved using the TCGA dataset in Figure 8. While the epoch numbers occupy the x-axis, recall value occupies y-axis of the graph plotted below. While assessing the model, employ a total of, 100 generations. The following suggested method provides a recall of 2% to 5% while dealing with genetic data and the existing models do not have a better recall.
Figure 8. Recall on TCGA
Figure 9. F-score on TCGA
This combined with accuracy equals F1 Score equal to two times recall multiplied by accuracy divided with recall and the accuracy figure. Some will perceive it as the F Score while others will consider it as the F Measure depending on the place one is from. This formula gives a representation of the F1 Score of the situation of better or the worse of the accuracy and the recall necessary for a specific situation. The F1-score of the newly proposed LSTM model on the TCGA dataset is compared with that of the already developed CNN and DNN model in Figure 9. The x-axis identifies epochs while the y-axis identifies F1-score. Use different epochs and complete one thousand epochs to evaluate the model. The proposed model is appropriate for genomic data, and it gives a higher F-score of the quantity CNN and DNN models predict to be the most impacted gene in the development of breast cancer.
A breast cancer diagnosis remains a significant challenge in modern healthcare due to its complex nature and potential for rapid progression. Accurate and timely diagnosis is crucial for effective treatment and improved patient outcomes. This thesis focused on developing novel computational methods to help in the identification of influential genes associated with breast cancer. By employing a deep learning-based LSTM model, we have successfully predicted the most affected gene in breast cancer development. The proposed approach involved two key steps: (1) clustering the data using DE-based methods to identify influential genes and (2) utilizing an LSTM network to forecast the gene patterns associated with breast cancer progression. The experimental results demonstrate the superior performance of the LSTM model in predicting the most influential gene compared to existing methods. This advancement has significant implications for both researchers and clinicians. By accurately identifying the most affected gene, researchers can gain valuable insights into the underlying molecular mechanisms of breast cancer, leading to the development of targeted therapies. Clinicians can also benefit from these findings by using the predicted gene information to guide treatment decisions and improve patient care. In conclusion, this article has presented a novel and effective approach for predicting the most influential gene in breast cancer development using a deep learning-based LSTM model. The proposed method offers a valuable tool for researchers and clinicians in the fight against breast cancer, potentially leading to improved diagnosis, prognosis, and treatment outcomes.
[1] Pashaei, A., Sajedi, H., Jazayeri, N. (2018). Brain tumor classification via convolutional neural network and extreme learning machines. In 2018 8th International Conference on Computer and Knowledge Engineering (ICCKE), Mashhad, Iran, pp. 314-319. https://doi.org/10.1109/ICCKE.2018.8566571
[2] Yousefi, S., Amrollahi, F., Amgad, M., Dong, C., Lewis, J.E., Song, C., Cooper, L.A. (2017). Predicting clinical outcomes from large scale cancer genomic profiles with deep survival models. Scientific Reports, 7(1): 1-11. https://doi.org/10.1038/s41598-017-11817-6
[3] Yuvaraj, N., Vivekanandan, P. (2013). An efficient SVM based tumor classification with symmetry non-negative matrix factorization using gene expression data. In 2013 International Conference on Information Communication and Embedded Systems (ICICES), Chennai, India, pp. 761-768. https://doi.org/10.1109/ICICES.2013.6508193
[4] Liu, Y., Lu, H., Yan, K., Xia, H., An, C. (2016). Applying cost-sensitive extreme learning machine and dissimilarity integration to gene expression data classification. Computational Intelligence and Neuroscience, 2016(1): 8056253. https://doi.org/10.1155/2016/8056253
[5] Si, Z., Yu, H., Ma, Z. (2016). Learning deep features for DNA methylation data analysis. IEEE Access, 4: 2732-2737. https://doi.org/10.1109/ACCESS.2016.2576598
[6] George, Y.M., Zayed, H.H., Roushdy, M.I., Elbagoury, B.M. (2013). Remote computer-aided breast cancer detection and diagnosis system based on cytological images. IEEE Systems Journal, 8(3): 949-964. https://doi.org/10.1109/JSYST.2013.2279415
[7] Sharma, S., Mehra, R. (2020). Conventional machine learning and deep learning approach for multi-classification of breast cancer histopathology images-A comparative insight. Journal of Digital Imaging, 33(3): 632-654. https://doi.org/10.1007/s10278-019-00307-y
[8] Chugh, G., Kumar, S., Singh, N. (2021). Survey on machine learning and deep learning applications in breast cancer diagnosis. Cognitive Computation, 13(6): 1451-1470. https://doi.org/10.1007/s12559-020-09813-6
[9] Houssein, E.H., Emam, M.M., Ali, A.A., Suganthan, P.N. (2021). Deep and machine learning techniques for medical imaging-based breast cancer: A comprehensive review. Expert Systems with Applications, 167: 114161. https://doi.org/10.1016/j.eswa.2020.114161
[10] Hamed, G., Marey, M.A.E.R., Amin, S.E.S., Tolba, M.F. (2020). Deep learning in breast cancer detection and classification. In Proceedings of the International Conference on Artificial Intelligence and Computer Vision (AICV2020), pp. 322-333. https://doi.org/10.1007/978-3-030-44289-7_30
[11] Butt, A.U.R., Ahmad, W., Ashraf, R., Asif, M., Cheema, S.A. (2019). Computer aided diagnosis (CAD) for segmentation and classification of burnt human skin. In 2019 International Conference on Electrical, Communication, and Computer Engineering (ICECCE), Swat, Pakistan, pp. 1-5. https://doi.org/10.1109/ICECCE47252.2019.8940758
[12] Tiwari, M., Bharuka, R., Shah, P., Lokare, R. (2020). Breast cancer prediction using deep learning and machine learning techniques. Available at SSRN 3558786. https://doi.org/10.2139/ssrn.3558786
[13] Ragab, D.A., Attallah, O., Sharkas, M., Ren, J., Marshall, S. (2021). A framework for breast cancer classification using multi-DCNNs. Computers in Biology and Medicine, 131: 104245. https://doi.org/10.1016/j.compbiomed.2021.104245
[14] Ashraf, R., Kiran, I., Mahmood, T., Butt, A.U.R., Razzaq, N., Farooq, Z. (2020). An efficient technique for skin cancer classification using deep learning. In 2020 IEEE 23rd International Multitopic Conference (INMIC), Bahawalpur, Pakistan, pp. 1-5. https://doi.org/10.1109/INMIC50486.2020.9318164
[15] Aneta, P.K., Krzysztof, M., Rudnicki, W.R. (2021). Robust data integration method for classification of biomedical data. Journal of Medical Systems, 45(4): 45. https://doi.org/10.1007/s10916-021-01718-7
[16] Arepalli, P.G., Naik, K.J. (2024). Water contamination analysis in IoT enabled aquaculture using deep learning based AODEGRU. Ecological Informatics, 79: 102405. https://doi.org/10.1016/j.ecoinf.2023.102405
[17] Arepalli, P.G., Naik, K.J. (2024). A deep learning-enabled IoT framework for early hypoxia detection in aqua water using light weight spatially shared attention-LSTM network. The Journal of Supercomputing, 80(2): 2718-2747. https://doi.org/10.1007/s11227-023-05580-x
[18] Arepalli, P.G., Naik, K.J. (2023). An IoT-based water contamination analysis for aquaculture using lightweight multi-headed GRU model. Environmental Monitoring and Assessment, 195(12): 1516. https://doi.org/10.1007/s10661-023-12126-4
[19] Quinlan, P.R., Figeuredo, G., Mongan, N., Jordan, L.B., Bray, S.E., Sreseli, R., Quinlan, R.A. (2022). Cluster analyses of the TCGA and a TMA dataset using the coexpression of HSP27 and CRYAB improves alignment with clinical-pathological parameters of breast cancer and suggests different epichaperome influences for each sHSP. Cell Stress and Chaperones, 27(2): 177-188. https://doi.org/10.1007/s12192-022-01258-0
[20] Islam, M.M., Huang, S., Ajwad, R., Chi, C., Wang, Y., Hu, P. (2020). An integrative deep learning framework for classifying molecular subtypes of breast cancer. Computational and Structural Biotechnology Journal, 18: 2185-2199. https://doi.org/10.1016/j.csbj.2020.08.005
[21] El-Bendary, N., Belal, N.A. (2020). A feature-fusion framework of clinical, genomics, and histopathological data for METABRIC breast cancer subtype classification. Applied Soft Computing, 91: 106238. https://doi.org/10.1016/j.asoc.2020.106238
[22] Hou, L., Samaras, D., Kurc, T.M., Gao, Y., Davis, J.E., Saltz, J.H. (2016). Patch-based convolutional neural network for whole slide tissue image classification. In Proceedings of the IEEE Conference on Computer Vision and Pattern Recognition, pp. 2424-2433. https://doi.org/10.1109/CVPR.2016.266
[23] Arepalli, P.G., Naik, K.J., Amgoth, J. (2024). An IoT based water quality classification framework for aqua-ponds through water and environmental variables using CGTFN model. International Journal of Environmental Research, 18(4): 73. https://doi.org/10.1007/s41742-024-00625-2
[24] Narayana, V.L., Patibandla, R.L., Rao, B.T., Gopi, A.P. (2022). Use of machine learning in healthcare. Advanced Healthcare Systems: Empowering Physicians with IoT-Enabled Technologies, 275-293. https://doi.org/10.1002/9781119769293.ch13