Laalithya Nagisetti*![]() | Meenakshi Chintapalli
| Meenakshi Chintapalli![]() | Navya Kanugula
| Navya Kanugula![]() | Varma V. Abhishek
| Varma V. Abhishek![]() | Thanakumar Joseph S. Iwin
| Thanakumar Joseph S. Iwin![]() | Garikipati Bindu
| Garikipati Bindu![]()
© 2025 The authors. This article is published by IIETA and is licensed under the CC BY 4.0 license (http://creativecommons.org/licenses/by/4.0/).
OPEN ACCESS
A prevalent mental illness that impacts millions of individuals globally is depression. In order to manage depression and enhance patient outcomes, early diagnosis and detection are essential. An overview of the approaches being used currently to identify depression is provides in this article. This study uses the data that is collected using survey and uses it as a dataset for identifying depression among girl students using machine learning approaches. Improved patient outcomes and quality of life can result from early detection and treatment of depression. It is also feasible to diagnose depression by using data from social media networks. For younger Internet users, well-known social networking sites like Facebook, Instagram, and Twitter have emerged as the most trustworthy sources to express their opinions and critiques. We can extract the text-based data by extracting the tweets and posts in these social media platforms to classify the data. As we know that psychological analysis helps in classifying the positive and negative statements, we can make use of the same to detect depression. We can apply the same method for any kind of data. Most often, depression is seen in students who pursue graduation. So, to categorize the depression among those people, we gathered the dataset that has the necessary information. We classify the data collected in the survey and classify them into the levels of depression. There are many other methods which help in detecting depression. To classify the dataset into different levels we use machine learning techniques.
depression, detection, prediction, sentiment analysis
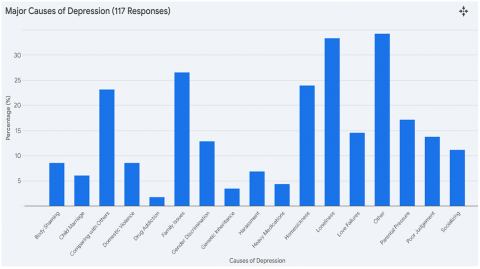
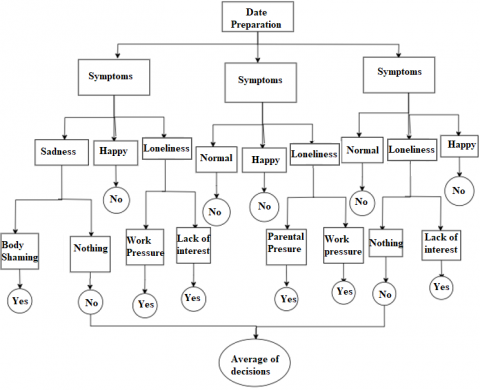
Depression is the common mental health disease in today’s world where they face feelings like sadness, hopelessness, lack of interest in any kind of activities. It can even impact people’s well-being and lifestyle. Its effects on people's lifestyles and well-being are especially concerning since the generation of today is particularly vulnerable to its hold because of their growing stress and frustration. People can overcome depression with the aid of early detection. We hope to emphasize the value of early detection and intervention in effectively addressing mental health difficulties by exploring the statistical prevalence of depression among female students and placing the study's significance within this demographic. By doing this research, we are hoping to advance the development of focused approaches to female students' mental health support, which will in turn promote a more robust and healthier academic environment. Many machine learning and deep learning approaches have been used to identify depression in its early stages. Many methods and algorithms, such as sentiment analysis and machine learning models like logistic regression, Random Forest, gradient boosting, and support vector machines, can be used to predict depression levels from text data. We have other models like RNN and CNN. A text's sentiment or emotional tone can be determined through sentiment analysis. It's a natural language processing task that can help you understand whether a given text has a good, bad, or neutral sentiment. Data show that depression is extremely common among female students, a trend that calls for immediate attention and successful intervention techniques. It is critical to comprehend the statistical prevalence of depression in this population to fully appreciate the importance of this study. Studies reveal a significant proportion of female students experiencing depression, highlighting the need for customized methods of identification and assistance. We chose a group of female students who are graduating and are struggling with depression. We gathered information regarding their causes of depression in Figure 1.
In the above survey, 88% of people were facing form depression while the remaining 12% were not facing any kind of depression. We concluded that text data can be used to identify depression. To determine how depressed people are, we used sentiment analysis. This would be more useful for the people for getting proper medication according to their level of depression. Although sentiment analysis is typically used to determine whether text contains positive, negative, or neutral attitudes, it might offer insightful information that help identify depression. People who are depressed frequently express bad feelings and ideas. Texts with continuously negative sentiment can be found using sentiment analysis, which may point to a higher risk of depression. Negative emotions are a common aspect of human experience, therefore it's vital to remember that not all of them indicate depression. Figure 2 shows the causes of depression.
Figure 1. Responses of the girl students
Figure 2. Causes of depression [1]
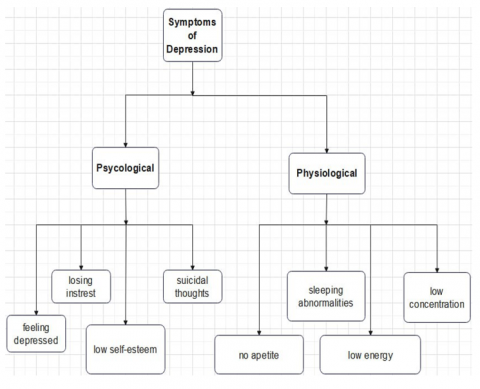
Figure 3. Symptoms of depression
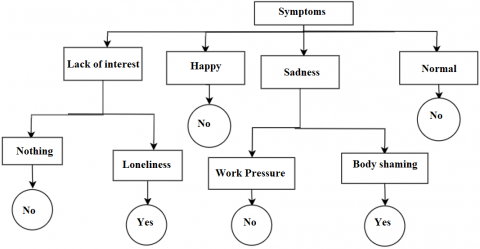
Sentiment analysis can be used alongside other types of information, such as behavior patterns, linguistic usage, and context, to develop a more thorough knowledge of a person's mental health. There will be many causes for depression and at the same time we can address some common symptoms to detect depression. In this article we mainly focus on detection of depression using machine learning algorithms like logistic regression, SVM, Random Forest, Decision Tree. This paper examines the accuracy of the mechanisms for identifying depression. In this study, we used a dataset that includes text data shown in Figure 3.
In light of this, the purpose of this study is to investigate the possibility of early depression diagnosis among female students through the application of machine learning and deep learning techniques. This study looks at a dataset that contains textual data to assess how well different algorithms such as logistic regression, support vector machines, Random Forests, and Decision Trees predict depression levels. Furthermore, it is critical to understand that depression can have a variety of causes and symptoms, making a multimodal approach to its detection and treatment necessary. A range of machine learning algorithms based on text data can be used to categorize depression into three categories: normal, mild, and extreme. The quantity of the dataset, the challenge's difficulty, and the ease with which the results should be understood all influence which algorithm should be used. These are a few techniques for machine learning based depression diagnosis. Figure 4 shows the basic classification for depression.
Logistic regression: For binary classification tasks, logistic regression is a straightforward and understandable approach. It frequently serves as a baseline model and predicts the probability that a sample will belong to a given class.
Support vector machines (SVMs): SVMs are capable of handling both linear and non-linear decision boundaries, making it effective for binary classification applications. They look for the hyperplane that best separates the classes while maximizing the margin between them.
Figure 4. Classification of depression
Random Forest: Multiple Decision Trees make up the ensemble learning method known as Random Forest. It is strong, effectively manages non-linear interactions, and can aid in avoiding overfitting.
Naïve Bayes: The probabilistic algorithm Naive Bayes uses Bayes theorem. It performs well when there are many features and is especially helpful for text categorization tasks.
LSTM: In order to effectively highlight and emphasize the significance of the text's key elements, networks and attention processes are essential.
Sentiment Analysis: This straightforward method is examining the sentiment or emotion communicated in the text. A persistently negative tone in the text may point to an increased risk of depression without precisely predicting depression levels. The use of lexicons comprising positive and negative words as well as a few techniques such as Naïve Bayes, SVM in machine learning, or more sophisticated DL techniques are common methods. This paper discusses the use of these kinds of algorithms to predict depression is ongoing, and it has the potential to be a useful tool for identifying those who may be at risk of becoming depressed. This paper will compare several ML algorithms, including SVM, Logistic-Regression, KNN, Random Forest, and Decision Trees.
LSTM (Long-Short-Term-Memory) was used by Uddin et al. [2] to identify depression in Bangla text. They took the twitter data as their dataset. Authors prepared their own dataset as there is no existing dataset in Bangla.
Community-based cross-sectional research was done at Northwest Ethiopia in 2015, by Molla et al. [3]. According to their study people are said to have less depression if there PHQ score is greater than or equal to 5 and noticeable depression if their score is between 10 to 14, moderately high depression if their score is between 15 to 19, high depression if their score is from 20-27.
To predict an individual's depression level, He and Cao [4] merged DL characteristics with manually created attributes. They used Spectrogram-DCNN and Raw-DCNN to gauge the depth of depression. Stochastic gradient descent, a feature of architecture, was used by the authors to train the networks.
By using computerized cognitive therapy as a part of the depression awareness program, Arensman et al. [5] developed a tool called iFightDepression tool. Ella Arensman et al explained how the tool is built on CBT and handles topics including behavioural activation, sleep management, mood monitoring, and good lifestyle behaviours.
Gaikar et al. [6] suggested a method that will remove the tweets from Twitter classify them by using SVM and Naive Bayes while accounting for emoticons, and then produced a graph of the classified tweets over time. It helps in categorizing depression into major and bipolar depression. The author also mentioned symptoms of the major and bipolar depression.
Islam et al. [7] started to gather information from the social networking sites like Facebook and decided to recognize the emotion form the texts extracted from the Facebook. The authors used NCapture to gather information from the facebook. For classification KNN techniques are used. The author even represented the accuracies of the classifiers they used.
Using supervised machine learning, Islam et al. [8] investigated a variety of variables, including linguistic style, emotional process, and temporal process. The classification techniques are thought to be applicable for each factor. Since social media is where most people share their opinions, the writers used these platforms to collect their information. The dataset was processed by the authors using LIWC.
The dataset was created by Cacheda et al. [9] utilising comments and posts on social media. Data was obtained from Reddit. Postings with specific self-reports of diagnosed depression can be found in the depression subreddit, which can be useful in identifying people who are depressed. They are not presumed to be depressed merely because they have made posts or comments about depression; rather, Reddit's evidence supports this theory.
Wang and Pal [10] proposed an approach called constraint optimization approach to identify feelings in user posts on social media. Authors have concentrated on finding essential characteristics that could act as signals for emotion identification, like phrases that express various emotions and smiles. These characteristics have been successfully utilised as auxiliary data for creating more complicated models. According to authors a more reasonable way to derive a document’s emotion is to get each feature’s emotion and average over them according to the frequency of their appearance.
Yang et at. [11] introduced a methodology for predicting emotions by analyzing individuals' social media interests. They suggested a straightforward but effective weight learning system where the weights are derived from user behavior. To verify the efficiency of our strategy, they carried out a series of extensive trials. The results showed the interest of using social media and is useful for detecting the emotions using social media.
Social media emotion prediction can be useful in the diagnosis of depression [12]. With the growing use of social media, authors can now more accurately predict readers' emotions by analyzing posts on these platforms. To ascertain the feeling, we employ the rapid miner model. The SVM and Naïve Bayes classifiers are tested using different methods in this model.
Table 1 shows various methods followed for detecting depression. Body language, gestures, and head movements have all been employed extensively in the evaluation of depression, and they may be just as important as the conventional symptoms themselves [13]. To effectively record body movements for a range of disease detection applications, Kinect might be a good option for research because to its advantages of high performance, mobility, and affordability. The low cost and powerful computational model capabilities of the Kinect V2 device are utilized to identify the kinematic skeletal characteristics of the subject, and it is simple to retrieve the original sequential data. Confusion matrix is shown for visualization purposes.
Table 1. List of various methods, evaluation metrics used in prediction of depression
|
Reference |
Title |
Methodology |
Evaluation Parameters |
Dataset |
|
[1] |
“Depression Analysis from Social Media Data in Bangla Language using Long Short Term Memory (LSTM) Recurrent Neural Network Technique” |
LSTM |
precision, recall, F1 score |
Took the twitter data as dataset |
|
[2] |
“Depression among Ethiopian Adults: Cross-Sectional Study” |
Machine Learning |
PHQ Score |
A examined organised interviewer administered a questionnaire to gather data |
|
[3] |
“Automated depression analysis using convolutional neural networks from speech” |
Raw-DCNN, Spectrogram DCNN, Stochastic gradient descent |
- |
Nil |
|
[4] |
“Depression Awareness and Self-Management Through the Internet: Protocol for an Internationally Standardized Approach” |
iFightDepression tool |
PREDI-NU |
Nil |
|
[5] |
“Depression detection and prevention system by analysing tweets” |
SVM and Naive Bayes |
precision, recall, F1 score |
Suggested a method that will remove the tweets from Twitter |
|
[6] |
“Detecting Depression Using K-Nearest Neighbors (KNN) Classification Technique” |
KNN LIWC tool |
precision, recall, F1 score, and accuracy |
Texts extracted from the Facebook |
|
[7] |
“Depression detection from social network data using machine learning techniques” |
Decision Tree, KNN, SVM |
precision, recall, F1 score |
Applied LIWC to the dataset processing |
|
[8] |
“Early Detection of Depression: Social Network Analysis and Random Forest Techniques” |
Machine Learning |
LSA scores precision, recall, and F |
Formed the dataset using the posts and comments in social media |
|
[9] |
“Detecting emotions in social media: A constrained optimization approach” |
Constraint optimization approach |
precision (P), recall (R), and F-score (F) |
Characteristics have been successfully utilised as auxiliary data |
|
[10] |
“User interest and social influence based emotion prediction for individuals” |
Suggested a technique for predicting people's feelings based on their social media interests. |
precision, recall and F1-Measure |
Carried out a series of extensive trials |
|
[11] |
“Predicting Depression Levels Using Social Media Posts” |
SVM, Naïve Bayes Theorem, Performance Metrics |
accuracy, precision, recall |
Two types of datasets are used |
A user's emotional state might change at different times based on her environment. For example, one can use social networks to observe how her behavior reflects her emotional state [14]. They proposed a method called MoodCast to build the model for predicting people's emotional states and framed the emotion prediction problem as a dynamic graph problem. The mood prediction performance across all studies was evaluated by the authors using precision, recall score, and F1 score.
Depression is not caused by one reason. Many factors contribute to an increased risk of developing the illness. Women experience depression at a higher rate than men which scientists believe is caused due to hormonal factors [15].
We performed a survey for female students, which included a collection of questions that would help us train the machine learning models appropriately. We created and distributed a Google form to collect the information. The form inquiries their age, the type of stress they are experiencing, the sources of that stress, the symptoms, and a variety of solutions. We phrased the question offering numerous options, allowing the person to select the most appropriate options. We categorized the responses as causes of depression, kind of depression, Symptoms.
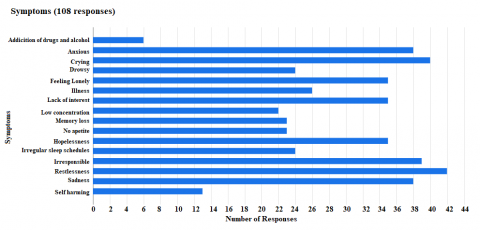
Figures 5-7 show the results of the survey. We used SVM for predicting the depression. Here are the steps that are involved while using SVM. To gather related information, we conducted the above survey and took the responses as dataset. As the obtained data should be cleaned and prepared, we cleaned the unwanted data and grouped the relevant data together. This entails resolving missing values, scaling numerical features, encoding categorical variables, and perhaps feature engineering to produce new useful features. Choose the aspects that are the most important or take important features from the data. This stage aids in noise reduction and concentrates the algorithm's attention on the crucial data for prediction. We have chosen SVM for the depression prediction [16]. Divide your dataset into training and validation sets. The training set should be used to improve the hyperparameters of the algorithms you have selected to use. You can estimate your model's potential generalization to new data using cross-validation. Block diagram for SVM is shown in Figure 8.
Figure 5. Age of the corresponding respondents
Figure 6. Kind of stress as per the survey
Figure 7. Symptoms of respondents
Figure 8. Block diagram for SVM
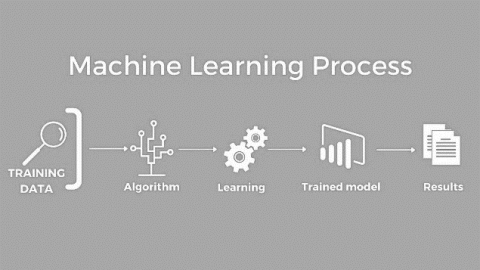
To evaluate the effectiveness of the trained models, use suitable evaluation metrics such as recall_score, F1-score, ROC-AUC, accuracy, and precision. Based on these metrics, choose the model that performs the best. Assessing behavioural attributes associated with interaction with others, feelings, words and linguistics styles, ego networks, and references to antidepressant medications can aid in the identification of depression [17]. It's crucial to have interpretable models for medical applications like depression prediction [18]. Understanding the characteristics that contribute the most to the model's predictions can be done with the aid of techniques like feature importance analysis [19]. Once you have a model that works well, test it on a new dataset to make sure it generalizes well to fresh data. We follow the same approach for all the algorithms in machine learning and will show the precision and accuracy for machine learning algorithms. Process of machine learning is shown in Figure 9 below:
Figure 9. Process of machine learning
Depending upon the circumstances, logistic regression may be used to predict depression most effectively. It is significant to remember that depression cannot be accurately predicted using logistic regression. Logistic regression can only take into consideration some of the various possible depression-causing factors. The nature of the data affects the model's accuracy. The data is carefully collected and cleaned to ensure that it is accurate and representative of the population which we are interested in predicting. To make sure that the model is not overfitting the training data, it should be validated on a different dataset. It is important to interpret the model accurately. The link between the independent factors and the chance of depression can be understood using the model's coefficients. Block diagram of Logistic regression is shown in Figure 10.
Figure 10. Block diagram for logistic regression
The KNN algorithm is a quick, easy, and effective technique that can be used to predict depression. Once the dataset is collected, that dataset needs to train in the KNN algorithm on the training set. This involves choosing the k training set instances that are most like each test set instance and then predicting the test occurrence's label based on the labels of its k closest neighbors. There are many different things that can lead to depression, and the KNN algorithm can only take some of these things into account. It's important to choose k's value carefully. A higher number of k will result in a more cautious algorithm that is less prone to fit the training set too tightly, but it may also result in fewer accurate predictions. The KNN algorithm is validated on a separate dataset to ensure that it is not overfitting the training data. Block diagram for KNN is shown in Figure 11.
Figure 11. Block diagram for KNN
For classification and regression problems, the ensemble learning method Random Forest is used. It functions by building several Decision Trees, combining their predictions, and then making a final prediction. In the collected dataset of instances, we have been labelled as either depressed or not depressed. This dataset is included with features of some factors. The collected dataset needs to train the Random Forest algorithm on training set. For every case in the training set, this includes creating multiple Decision Trees and then combining their predictions. You must select the hyperparameter for the Random Forest's number of Decision Trees. The number of trees will have an impact on how accurate the forecasts are. The algorithm will be more accurate if there are more trees, but it will also require more processing power. The Random Forest method shown in Figure 12 is a strong and adaptable algorithm that can be utilized in a variety of ways to predict depression. The advantages of using Random Forest for predicting depression which is a very accurate algorithm which is relatively robust to overfitting. This can handle many features which can be used to predict depression in a variety of ways.
A Decision Tree predicts the outcome of a new occurrence by creating a tree-like structure of decisions as shown in Figure 13. To predict the depression using Decision Tree, dataset would need to include features that are known to be associated with depression. After collection of datasets will need to train the Decision Tree algorithm on training set. This involves creating a tree-like structure of decisions that can be used to predict the label of a new instance based on its features. The data is carefully collected and cleaned to ensure that it is accurate and representative of the population you are interested in predicting. This algorithm should be validated on a separate dataset to ensure that it is not overfitting the training data. This algorithm should be pruned to remove unnecessary branches. This can help to increase the performance of the predictions.
Above all the four algorithms are helpful in predicting the outputs in an accurate way. These techniques are useful for predicting depression in a variety of ways. Some of the algorithms can handle large amounts of data with many features [20]. All things considered, these algorithms have the potential to be very effective at raising prediction accuracy and robustness [21].
Figure 12. Block diagram for Random Forest
Figure 13. Block diagram for Decision Tree
We performed a poll among female students who have problems with depression and formed the results as the dataset. We divided the feedback into three categories, types of depression, causes of depression, and symptoms. We also included F1_score, recall_score and Precison of all the algorithms. The confusion matrix is used to calculate precision and contains TruePositive: an outcome that establishes the veracity of a claim FalsePsitive: An inference that concludes something is true when it isn't The True Negative is an outcome that indicates something is false even though it is true. False Negative: an outcome that declares something to be false when it is in fact false. Using "train_test_split" and "sklearn.model_ selection," initially, we separated the data into training and testing purposes. in order to use SVM to predict depression. 'TfidfVectorizer' from sklearn.feature_ extraction.text transforms the text data into TF-IDF features.
TF-IDF vectorizer is mostly used to convert categorical data to numerical data. TF-IDF takes into account both the frequency of a phrase in a document and its relevance throughout the entire corpus. This weighting technique gives more weight to phrases that appear frequently in a document but are uncommon in the corpus, thereby capturing terms' discriminative strength in distinguishing between classes. This can result in more accurate class separation and classification performance. Using the precision_score and f1_score functions from sklearn.metrics, the precision and F1-score are determined like shown in Table 2.
Table 2. Precision, recall, F1_score using SVM
|
Level of Depression/ Values |
Normal |
Slight |
Extreme |
|
Precision |
90 |
89 |
82 |
|
Recall |
76 |
89 |
93 |
|
F1-score |
82 |
89 |
87 |
Similar methods are used for prediction when using logistic regression. The data is divided into training and testing sets using the Train_test_split function from sklearn.model_ selection. This allows us to use a subset of the data to train the model and a different subset to test it. The "TfidfVectorizer" from "sklearn.feature_ extraction.text" is used to extract features. Using logistic regression from sklearn.linear_ model, the logistic regression model is initialized. TF-IDF features, and matching labels are used to train the model on the training set. The predict method is used to make predictions. The model's performance can be assessed with the aid of precision and F1_score. The precision of positive predictions is measured. The scores are mentioned below in Table 3.
Table 3. Precision, recall, F1_score using logistic regression
|
Level of Depression/ Values |
Normal |
Slight |
Extreme |
|
Precision |
72 |
84 |
94 |
|
Recall |
80 |
84 |
86 |
|
F1-score |
76 |
84 |
90 |
The procedure for all the machine learning algorithms will be the same except for a few methods which will change for the algorithm we use. After the data splitting and feature extraction, the k-Nearest_Neighbors (KNN) model is initialized using KNeighborsClassifier from sklearn. neighbors. Like the other models, this model is also trained using fit with the TF-IDF features and corresponding labels. Using the prediction method, predictions are made on the testing data using the trained KNN model. Precision, Recall and F1-score are calculated to evaluate the model's performance. Precision measures the accuracy of positive predictions, while F1-score is the harmonic mean of precision and recall as mentioned below in Table 4.
Table 4. Precision, recall, F1_score using KNN
|
Level of Depression/ Values |
Normal |
Slight |
Extreme |
|
Precision |
63 |
79 |
82 |
|
Recall |
70 |
83 |
74 |
|
F1-score |
66 |
81 |
78 |
Train_test_split from sklearn.model_selection divides the data into training and testing sets for Decision Trees to be used in depression prediction. This allows us to use a subset of the data to train the model and a different subset to test it. Text data is vectorized using TF-IDF to create numerical features. The TfidfVectorizer from sklearn.feature_extraction.text is used to achieve this. Using DecisionTreeClassifier from sklearn.tree, the Decision Tree model is initialized. To assess the performance of the model, calculations are made for precision, recall, and F1-score. Positive predictions serve as the gauge for precision. Scores are mentioned in Table 5.
Table 5. Precision, recall, F1_score using Decision Tree
|
Level of Depression/ Values |
Normal |
Slight |
Extreme |
|
Precision |
63 |
94 |
88 |
|
Recall |
78 |
86 |
88 |
|
F1-score |
85 |
90 |
88 |
Using Random Forest, we use Random Forest Classifier from sklearn.ensemble to calculate precision and F1-scores. You can change the 100 estimators (Decision Trees) that are configured, if necessary. For the purpose of splitting the data and extracting features, all machine learning algorithms will use the same methodology. Using the predict method, predictions are made on the testing data using the trained Random Forest model. To assess the performance of the model, calculations are made for precision, recall-score, and F1-score like in Table 6.
Table 6. Precision, recall, F1_score using Random Forest
|
Level of Depression/ Values |
Normal |
Slight |
Extreme |
|
Precision |
72 |
74 |
88 |
|
Recall |
72 |
82 |
83 |
|
F1-score |
72 |
78 |
85 |
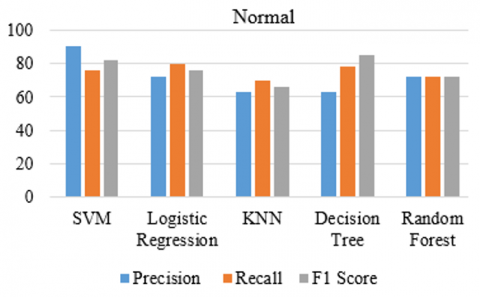
Figure 14. F1_score, recall_score and Precision for normal state
Figure 15. F1_score, recall_score and Precision for slight state
Figure 16. F1_score, recall_score and Precision for extreme state
To visually show the precision, recall-score, and F1-score of all the above-discussed algorithms, a bar chart is made using matplotlib.
Pre: TP / (TP + FP)
Re: TP / (TP + FN)
F1_score: 2 * (Pre * Re) / (Pre + Re)
Figures 14-16 are the visual representation for the scores for Normal, Slight and Extreme depression.
In this study, we showed that it is feasible to track and identify user depression using data gathered from a source. To train a model and acquire more profound understanding, our research entailed a comprehensive examination of various algorithms. After a thorough analysis of several machine learning methods, we were able to identify patterns that corresponded to common behaviors and thought processes among depressed people. In particular, accurate and encouraging findings were obtained when the performance of deep learning methods combined with various algorithms including SVMs, Random Forest Classifier, K Nearest Neighbour Model, and Logistic Regression was assessed. Our results shown the study explores the application of diverse machine learning techniques such as SVMs, Random Forest Classifier, K Nearest Neighbor Model, and Logistic Regression from the sklearn linear model, alongside deep learning methods and sentiment analysis to predict depression. The results obtained from these algorithms, including SVM, Logistic Regression, KNN, Random Forest, and Decision Tree, were found to be accurate and promising. Metrics like F1_score, Recall_score, and Precision were used to assess the accuracy of the predictions. Additionally, a graphical representation of results was created using Random Forest. The findings underscore the potential of employing machine learning algorithms in depression prediction. The research not only validates the accuracy of these algorithms but also emphasizes the significance of using various techniques for better outcomes. Future endeavors will involve exploring different data collection methods to obtain a wider range of information for predicting outcomes. Moreover, extensive datasets will be utilized to enhance the efficiency and effectiveness of the methods employed in this study. This research serves as a foundation for future investigations in the field of depression analysis. It aligns with existing literature that advocates for in-depth studies in this area. To further enhance the performance of algorithms, future work will focus on implementing parallel and pipeline methods, incorporating additional parameters, and utilizing various techniques to improve overall accuracy.
This study's conclusions have important consequences for mental health professionals as they provide insightful information on how machine learning algorithms might be incorporated into treatments to predict depression. Practitioners can enhance their diagnostic abilities and enable early intervention and customized treatment strategies by utilizing these algorithms. Moreover, the application of various methodologies emphasizes the significance of embracing a comprehensive strategy to improve forecast precision and maximize patient results.
[1] Schimelpfening, N. (2023). Causes and Risk Factors of Depression. https://www.verywellmind.com/common-causes-of-depression-1066772.
[2] Uddin, A.H., Bapery, D., Arif, A.S.M. (2019). Depression analysis from social media data in Bangla language using long short term memory (LSTM) recurrent neural network technique. In 2019 International Conference on Computer, Communication, Chemical, Materials and Electronic Engineering (IC4ME2), Rajshahi, Bangladesh, pp. 1-4. https://doi.org/10.1109/IC4ME247184.2019.9036528
[3] Molla, G.L., Sebhat, H.M., Hussen, Z.N., Mekonen, A.B., Mersha, W.F., Yimer, T.M. (2016). Depression among Ethiopian adults: cross-sectional study. Psychiatry Journal, 2016: 1468120. https://doi.org/10.1155/2016/1468120
[4] He, L., Cao, C. (2018). Automated depression analysis using convolutional neural networks from speech. Journal of Biomedical Informatics, 83: 103-111. https://doi.org/10.1016/j.jbi.2018.05.007
[5] Arensman, E., Koburger, N., Larkin, C., et al. (2015). Depression awareness and self-management through the internet: Protocol for an internationally standardized approach. JMIR Research Protocols, 4(3): e4358. https://doi.org/10.2196/resprot.4358
[6] Gaikar, M., Chavan, J., Indore, K., Shedge, R. (2019). Depression detection and prevention system by analysing tweets. In Proceedings 2019: Conference on Technologies for Future Cities (CTFC). https://doi.org/10.2139/SSRN.3358809
[7] Islam, M.R., Kamal, A.R.M., Sultana, N., Islam, R., Moni, M.A. (2018). Detecting depression using k-nearest neighbors (KNN) classification technique. In 2018 International Conference on Computer, Communication, Chemical, Material and Electronic Engineering (IC4ME2), Rajshahi, Bangladesh, pp. 1-4. https://doi.org/10.1109/IC4ME2.2018.8465641
[8] Islam, M.R., Kabir, M.A., Ahmed, A., Kamal, A.R.M., Wang, H., Ulhaq, A. (2018). Depression detection from social network data using machine learning techniques. Health Information Science and Systems, 6: 8. https://doi.org/10.1007/s13755-018-0046-0
[9] Cacheda, F., Fernandez, D., Novoa, F.J., Carneiro, V. (2019). Early detection of depression: Social network analysis and Random Forest techniques. Journal of Medical Internet Research, 21(6): e12554. https://doi.org/10.2196/12554
[10] Wang, Y., Pal, A. (2015). Detecting emotions in social media: A constrained optimization approach. In Twenty-Fourth International Joint Conference on Artificial Intelligence, Buenos Aires, Argentina, pp. 996-1002.
[11] Yang, Y., Cui, P., Zhu, W., Yang, S. (2013). User interest and social influence based emotion prediction for individuals. In Proceedings of the 21st ACM International Conference on Multimedia, Barcelona, Spain, pp. 785-788. https://doi.org/10.1145/2502081.2502204
[12] Aldarwish, M.M., Ahmad, H.F. (2017). Predicting depression levels using social media posts. In 2017 IEEE 13th International Symposium on Autonomous Decentralized System (ISADS), Bangkok, Thailand, pp. 277-280. https://doi.org/10.1109/ISADS.2017.41
[13] Li, W., Wang, Q., Liu, X., Yu, Y. (2021). Simple action for depression detection: using kinect-recorded human kinematic skeletal data. BMC Psychiatry, 21(1): 205. https://doi.org/10.1186/s12888-021-03184-4
[14] Tang, J., Zhang, Y., Sun, J., Rao, J., Yu, W., Chen, Y., Fong, A.C.M. (2011). Quantitative study of individual emotional states in social networks. IEEE Transactions on Affective Computing, 3(2): 132-144. https://doi.org/10.1109/T-AFFC.2011.23
[15] Schimelpfening, N. (2023). Causes and Risk Factors of Depression. https://www.verywellmind.com/common-causes-of-depression-1066772.
[16] Viscanti, L. (2023). Training data: The milestone of machine learning. https://mapendo.co/blog/training-data-the-milestone-of-machine-learning.
[17] De Choudhury, M., Gamon, M., Counts, S., Horvitz, E. (2021). Predicting depression via social media. In Proceedings of the International AAAI Conference on Web and Social Media, 7(1): 128-137. https://doi.org/10.1609/icwsm.v7i1.14432
[18] Wang, X., Zhang, C., Ji, Y., Sun, L., Wu, L., Bao, Z. (2013). A depression detection model based on sentiment analysis in micro-blog social network. In Trends and Applications in Knowledge Discovery and Data Mining, PAKDD 2013, pp. 201-213. https://doi.org/10.1007/978-3-642-40319-4_18
[19] Billings, A.G., Moos, R.H. (1984). Coping, stress, and social resources among adults with unipolar depression. Journal of Personality and Social Psychology, 46(4): 877-891. https://doi.org/10.1037/0022-3514.46.4.877
[20] Riyadh, A.Z., Alvi, N., Talukder, K.H. (2017). Exploring human emotion via Twitter. In 2017 20th International Conference of Computer and Information Technology (ICCIT), Dhaka, Bangladesh, pp. 1-5. https://doi.org/10.1109/ICCITECHN.2017.8281813
[21] Chintapalli, M., Kanugula, N., Nagisetti, L., Varma, A., Bindu, G. (2023). Investigation of intelligent methodologies in prediction of depression. In 2023 Third International Conference on Artificial Intelligence and Smart Energy (ICAIS), Coimbatore, India, pp. 1188-1193. https://doi.org/10.1109/ICAIS56108.2023.10073713