Fauzan Masykur*![]() | Angga Prasetyo
| Angga Prasetyo![]() | Ismail Abdurrozaq
| Ismail Abdurrozaq![]() | Adi Fajaryanto Cobantoro
| Adi Fajaryanto Cobantoro![]() | Arief Rahman Yusuf
| Arief Rahman Yusuf![]() | Mohammad Bhanu Setyawan
| Mohammad Bhanu Setyawan![]()
© 2025 The authors. This article is published by IIETA and is licensed under the CC BY 4.0 license (http://creativecommons.org/licenses/by/4.0/).
OPEN ACCESS
Segmentation is a method of separating colors between the background and foreground of an image with the aim of obtaining the pixel index value of a certain object. Meanwhile, contour segmentation is a technique used in image processing to detect and extract the boundaries of objects in the image. One of the uses of contour segmentation in this study is to detect infected rice plants based on images of rice plants acquired by drone cameras. The dataset image as an input in model training was carried out by flying a drone over a rice plant to capture the rice plant. The results of the evaluation of contour segmentation detection were carried out by comparing with real conditions which produced a value of 97.02% and an error of 2.80%.
contour segmentation, object detection, drone image, rice plant, infected plant
Rice plants are a source of raw materials for rice, which is a staple food consumed by the wider community. The largest rice production in the world is still dominated by China, which is the largest rice producer in the world, followed by India, which is the second largest rice producer. Indonesia is ranked fourth as a rice-producing country globally with 6% of world rice production [1]. Thus, rice production requires special attention because rice is a staple food throughout the world and a touch of technology is needed to maintain rice production, especially during rice planting. Rice plants in the planting process are not free from pests and diseases, both pests and diseases in the category of light or heavy attacks [2]. The development of technology can be used to distinguish between rice plants infected with disease and healthy rice plants based on the image of rice plant leaves. This paper aims to detect infected rice plants based on leaf images acquired with a drone camera. The image of the infected rice plant is detected using digital image processing with the image contour segmentation method. In predicting infected plants, image segmentation aims to separate healthy plant areas and areas that show symptoms of infection.
Image segmentation involves dividing or splitting an image into segments with similar characteristics. The purpose of segmentation is to identify specific objects, boundaries, or features in an image, which will be used for further analysis in image processing. Segmentation begins by identifying the values of pixels that have certain characteristics such as color intensity, texture, and shape. Image segmentation of the contour method involves edge detection, one of which is edge detection canny by combining with some morphological operations and deletion noise [3]. Removal noise is used to process image color spaces and textures in the final classification process as per the selected detection [4]. This process is a technique for finding static threshold values to convert the RGB color space of the cooled image into the Hue, Saturation, Value (HSV) color space. Convert RGB to HSV by adding color features and geometric features to locate objects in the input imagery [5]. Image segmentation has been widely used in the formation of features in object detection in plants, including segmentation in determining the quality of oil palm [3], classification of tomato diseases [4], detection of diseases in apple plants [6], leaf diseases on plants [7, 8], detection of leaf diseases of biofuel plants [9] and also the health sector [10-12].
Segmentation in image processing can also be combined with several other methods in development for the early detection, recognition, and classification of specific objects. Segmentation often encounters obstacles when detecting objects caused by several things, including blurred image boundaries, unclear background colors, varying object sizes, color variations to small object sizes. To overcome this, the research conducted by Zhang and Zhang [13] modified U-Net for segmentation by introducing block residues (Resblock) and residue paths (Respath). Resblocks are inserted on the U-Net to overcome gradient and explosion loss and 2 Respaths are used in place of 2 connections to improve feature transformation.
Accurate and precise segmentation is essential for health especially since the segmented object has various angles, shapes, image brightness, and several factors that disrupt segmentation. There are 2 stages proposed to overcome this ha, namely by segmentation processing involving Convolutional Neural Network (CNN) [14] and secondly by using an attractive segmentation method [15]. Image segmentation can also be applied in determining lung scan images in covid-19 patients. The lungs in covid-19 patients have gray values similar to arteries, veins and bronchi. Each period's COVID-19 lesions vary in size and shape. A crucial first step in identifying and diagnosing COVID-19 is accurate lung segmentation on CT scans. With an average segmentation accuracy rate of 97.4%, the pulmonary parenchyma's segmentation accuracy has increased in both the contrast clarity of CT images and the consistency of the pulmonary parenchyma's regional features [11]. Threshold-based values in order to better understand the green hue of the leaves, the color index is employed to split the foreground and background of plant photos. Two fixed threshold techniques are suggested for the color index to differentiate between the background (soil) and the foreground (greenery). The experimental findings demonstrate that the proposed approach performs better than alternative algorithms when applied to plant images, achieving a classification ratio of 1.93 ± 0.05 and a segmentation error of 6.62 ± 5.85% [8].
The digital image acquisition process is the steps to obtain a digital image from its original source, such as through a digital camera, scanner, or other sensor. One of the simple digital image models is the binary image model or black-and-white imagery. This model uses only two-pixel values, namely 0 (black) and 1 (white). Binary imagery is suitable for describing images that have only two levels of intensity. The sensors in the imaging system are arranged to form a 2-dimensional plane with a magnitude of f(x,y) proportional to the energy emitted by the light source. Consequently, the magnitude f(x,y) cannot be zero and must be finite.
$0<f(x, y)<\infty$ (1)
The function f(x,y) can be separated into 2 parts, namely:
In the context of digital image processing, the neighbors of a pixel are a group of pixels that are around a particular pixel. The term is often used in image processing operations such as spatial filters and edge detection techniques. The neighbors of a pixel are defined by the size of an area that is around that pixel. This area can be square or circular depending on the definition of the desired neighbor. This area size is referred to as the "kernel size" or "window size" (kernel/window size). The use of neighbors in image processing is very important because it allows for operations such as filtering, convolution, edge detection, and more.
Some operations require information from the pixel neighbor to generate Output which is right. A pixel p at coordinates (x,y) has 4 horizontal and vertical neighbors with coordinates (x+1,y), (x-1,y), (x,y+1), (x,y-1). This set of pixels is called the 4-neighbor of p, notated with N4(p). As for the 4 neighbors diagonally from p, ND(p) has coordinates (x+1,y+1), (x+1,y-1), (x-1,y+1), (x-1,y-1). On Picture 2.3 indicated pixel accuracy p. If ND(p) combined with N4(p) hence it is called the 8-neighbor of p, notated N8(p) [16].
Figure 1. Area and perimeter object shapes
A digital image that is composed of pixels to form an object and from these pixels will form an area or Area (A). The area can reflect the size or weight of the actual object on a solid object of almost the same shape, but this is not the case for non-solid or hollow objects. In addition to the term Area which indicates the area of the area, there is also the term Perimeter (P) to find out the length of the object's boundary or it can also be called the circumference (Figure 1). To calculate the perimeter size is calculated by calculating the number of pixels from the object constraint. Then there is one variable, namely compactness (C), which is an object measured through the analysis of dimensionless form factors with Eq. (2).
$\mathrm{C}=\frac{\mathrm{P}^2}{\mathrm{~A}}$ (2)
with:
C= Cohesiveness (Compactness)
P= Perimeter
A= Area
Compactness is used to identify the same shape and size of objects but with the fit of different pixel edges. For an object with flat edges, it will give a value of C of 4π, and if an object with uneven edges, the value of C will be even smaller. Another dimensionless form factor is the roundness of an object R, which is the comparison between the area of an object and the area of a circle that has the same perimeter value. For the calculation of the area of the plantation, use Eq. (3). Figure 1 shows the difference between the area and perimeter of a digital image.
$R=\frac{4 \cdot \pi A}{P^2}$ (3)
with:
R= Roundness (kebundaran)
A= Area
P= Perimeter
Active contours in the image segmentation method are segmentations that apply a closed curve model and then will move wide or narrow according to following the desired object. The beginning of active contour segmentation was discovered by Kass et al. [17]. Active contour segmentation is also called snakes. Widening or narrowing the curve by minimizing the energy of the image using external forces and can be affected by the characteristics of the object in question such as the lines or edges of the object. The external energy in question can be formulated as in Eq. (4).
$E=\int_2^1 E_{\text {int }}(\vec{Y}(s)) d s+\int_2^1 E_{e x t}(\vec{Y}(s)) d s$ (4)
With:
E= energy that affects the active contour segmentation
Eint= external energy is influenced by the shape of the object
Eext= external energy that affects the curve in a widening and narrowing direction towards the desired object.
$\vec{Y}(s)$ = curve in two-dimensional space
Whereas Eq. (5) shows the formula for the internal energy search [18].
$Eint=\left\{\alpha(s)\left|\vec{Y}_{\mathrm{s}}(s)\right| 2+\beta(s)\left|\vec{Y}_{\mathrm{SS}}(s)\right| 2\right\} / 2$ (5)
Value α(s) and β(s)is a function that determines how a curve moves in space. While external energy is presented in Eq. (6).
${Eext}=|\nabla \mathrm{G}(Y(s) 2)|$ (6)
The G variable is the image to be segmented and this contour segmentation is interconnected and sequential points one point to another and controlled by a straight line. The determination of the points must be predictable as the contours of the initials and close to the desired shape of the objects. The contour of the initials will approach the object either wide or narrow due to the influence of external energy until it touches the outline of the object.
As a dataset used in this study, it is the result of the acquisition of drone cameras. Drone technology has often been used as a tool to solve several problems in life. Drone is also called the term unmanned aerial vehicles (UAV), unmanned aerial systems (UAS), unmanned aircrafts (UA) or remotely piloted aircrafts (RPA) [19]. With the advancement of new technologies, UAV platforms have become an ideal tool for monitoring crops with more precision due to their flexibility and low cost [20]. On drones for agriculture, sensors are installed that are usually directed towards rice fields to detect light reflected from the surface leading to the sensor. The intensity of the light captured by the sensor depends on the exposure from the sun to the surface and the efficiency of the light reflecting off the sensor surface [21]. Color sensor Red, Green, Blue (RGB) is the most common type of sensor used in drones. The sensor is able to capture visible light (wavelength 400-700nm) in the channel Red, Green, Blue (RGB) that are stacked on top of each other similar to human vision. Three channels are used to calculate the value of each pixel in the image produced by the sensor. Data from light sensors is often easier to identify qualitatively because hidden information is more familiar.
Images of rice plants produced by drones will be used as a dataset as input in determining the location or points of infected plants. Methods for detecting infected plants using molecular diagnostic methods such as polymerase chain reaction (PCR), rapid fragment length polymorphisms (RFLP), real-time PCR, loop- mediatedisothermal amplification (LAMP), recombinase polymerase amplification (RPA), and point-of-care diagnostic methods [22].
The technology that is developing today is the existence of the term Smart Farming make it possible to integrate information technology communication in traditional agriculture [23]. Technology has penetrated into various fields, including agriculture, for example. Internet of Things (IoT) [24, 25], Big Data analysis Remote Sensing [26], Machine Learning [27] and also Unmanned Aerial Vehicle (UAV) [21, 28, 29]. Use of UAV or drones in agriculture are able to reduce observation time so that they are more efficient [30]. Drones are able to assist farmers in observing plant conditions from the air which includes irrigation systems, soil varieties, pests and fungal attacks [31]. The resulting image of the drone has information in the infrared range and Visual Spectrum and images can be extracted to get certain information that cannot be known by looking with the eye.
This research uses equipment in the form of drones equipped with cameras to acquire rice plant objects. Drones flying over rice farms depend on weather conditions because the stability of the drone when flying will affect the quality of the images produced. The quality of the image will certainly affect both labeling and model training. Therefore, the acquisition of rice plant images is carried out by paying attention to natural conditions such as weather, wind conditions and sunlight intensity [32]. In addition to weather factors, image quality is also determined by the pilot's proficiency when flying the drone [33], because the stability of the drone and also the distance between the camera and the object can also affect the accuracy results when applying segmentation. Figure 2 is shown during the process of acquiring images of rice plants.
Figure 2. The process of acquiring the image of rice plants
2.1 Acquisition aerial image
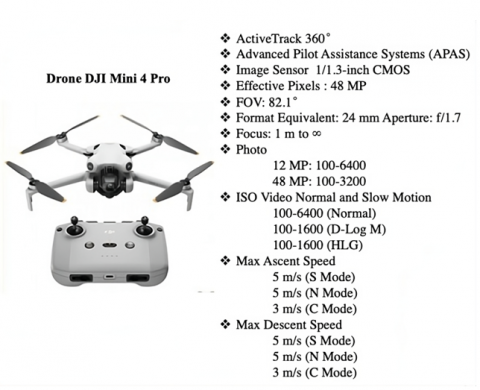
The drone device used at the time of the acquisition of the image of the rice plant uses the DJI Mini 4 Pro 4K/60fps HDR True Vertical Shooting drone. The most difficult part of the process of acquiring the image of rice plants is during the search for infected rice plants due to the behavior of farmers who will cut rice plants when they know that the rice plants are infected and cannot be treated. Therefore, as a researcher, we must make more frequent observations to rice farms to look for infected rice plant objects so that we can capture infected rice plants before they are cut by farmers. Therefore, the agricultural areas that are the objects of research are in different locations because the infected plant area cannot be determined in a particular area. In addition, the rice planting season is also a special concern because the rice planting time between one region and another is not the same, so when acquiring images, the rice planting time in a particular area must be adjusted. After the infected rice field is found, ensure the drone battery is fully charged and the weather conditions allow the drone to fly so that the drone camera can produce good quality rice plant images and the images are not blurry. The quality of the drone acquisition image will later affect the labeling of the dataset. The brightness level of the image will make it easier to determine the label or class of healthy plants or infected plants. The specifications of the DJI Mini 4 Pro drone are presented in Figure 3.
Figure 3. DJI Mini 4 pro drone specifications
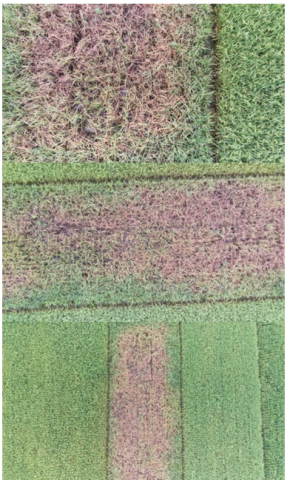
The acquisition of the image of rice plants was carried out around 07.00 to 09.00 because at that time the weather was still stable and the speed of the angin was not too fast. The location of the acquired agricultural land is in the Trenggalek and Magetan regions, Indonesia. The acquisition target here is rice planting land when the planting age is 30 days to 70 days. At that planting age, rice leaves are more clearly visible between healthy leaves and disease-infected leaves. Clear differences can affect segmentation results because segmentation is the process of distinguishing pixels between the foreground and background sides [34]. Figure 4 shows the image of the acquisition of drones on healthy and infected farmland. The acquisition results consist of 3 types, namely the acquired images at a distance of 5 meters, 10 meters and 20 meters. The purpose of the acquisition is different distances to find out the best accuracy of the segmentation results.
Figure 4. Images from the acquisition of drone cameras
2.2 Stages of segmentation
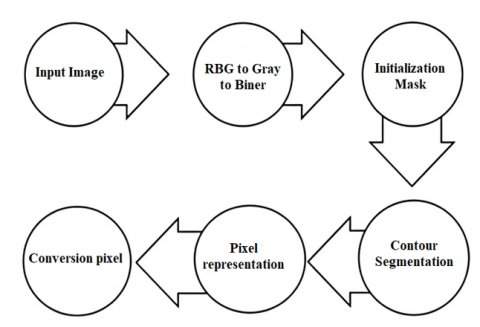
As for the segmentation stage based on segmentation, the contours are shown in Figure 5. The stages start from the image obtained from the drone camera acquisition and then converted into gray images and binary images. In this binary image, the segmentation process is carried out because it will be easier to calculate pixels with binary values of 0 and 1. Contour segmentation is an image processing technique used to determine the boundaries of image objects [3, 35]. The results of this contour segmentation are represented in the form of a matrix to be converted from pixel shape to meters so that the area can be known based on the shape of the object.
Figure 5. Stages of segmentation of contours
In image segmentation, an initialization mask refers to the initial step in the segmentation process where a mask or binary map is created to determine which region of the image to be noticed or further processed. This mask is used to give the segmentation algorithm an initial marker as to which areas of the image should be focused. For example, in contour-based segmentation such as the active contour (snake) algorithm, an initialization mask is used to set the initial contour that will later evolve to find the boundary of the object. By using an initialization mask, the segmentation algorithm's search area can be limited to only the desired region. This can speed up the segmentation process and improve accuracy because the algorithm does not need to process the entire image. This initial mask can also help minimize the effects of noise by focusing the segmentation process only on the relevant areas.
So, initialization masks play an important role in providing initial information and constraints for segmentation algorithms to work more efficiently and accurately.
The stage of calculating the area of infected plants based on contour segmentation starts from the image of the YOLO detection result and then converts it into a gray image and a binary image. In this binary image, the segmentation process is carried out because it will be easier to calculate the pixels with binary values of 0 and 1. Contour segmentation is an image processing technique used to determine the constraints of image objects. The results of this contour segmentation are represented in the form of a matrix to be converted from pixel shape to meters so that the area can be known based on the shape of the object.
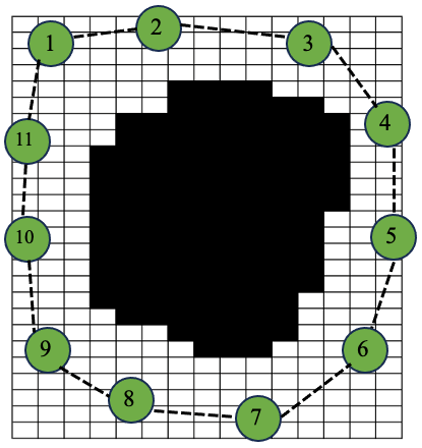
The way contour segmentation works in determining the initial in segmentation process of infected rice plant objects is carried out by randomly generating the initial mask initials. The illustration of the initial calculation in this contour segmentation is to determine the initial mask point at random that surrounds the object. Figure 6 shows an object that has been converted to a binary image with the object represented by a binary color 0 (black). The binary image is an object that will be segmented by contour segmentation. After the initial points of this mask are raised, they will then be shifted closer to the edge of the object so that segmentation will be formed according to the desired object.
Figure 6. Contour mask initials dots
Table 1 shows the recapitulation of the coordinates (x,y) of the initials mask at the beginning of the image to be segmented. The shift of the initial point from the initial determination to the approach of the object to be segmented based on external and internal energy according to Eq. (5). Internal energy is obtained from the elastic energy between the point to be calculated with its adjoining point as well as the energy of the curve. As for external energy, it is obtained from the influence of the image to be segmented [18].
Table 1. Position of the initial point of the mask
|
The initial point to |
Coordinates (x,y) |
|
1 |
1,1 |
|
2 |
0,6 |
|
3 |
12,2 |
|
4 |
15,7 |
|
5 |
15,14 |
|
6 |
14,21 |
|
7 |
10,25 |
|
8 |
5,24 |
|
9 |
2,21 |
|
10 |
0,14 |
|
11 |
0,8 |
In accordance with the energy equation in contour segmentation which states that energy comes from the addition of internal energy and external energy. The calculation of internal energy assuming that the value aof i is 0.1 and constant for all i and also applies to bi, then the internal energy value for the position of the 1st initial point can be known in the following way:
$\begin{aligned} & E_{\text {Int }}=\alpha_i\left(\left|P x_i-P x_i\right|^2+\left|P y_i-P y_{i-1}\right|^2\right)+\beta_i\left|P_{i-1}-P_i+P_{i+1}\right|^2 \\ & =0.1 \times\left(|1-0|^2+|1-8|^2+0.1 \times|0-1+0| 2+|8-1+6| 2\right) \\ & =5.0+17.9=22.9\end{aligned}$
Internal energy is already known, and then external energy is calculated, namely energy that is influenced by the image to be segmented. The search for external energy here is by calculating the distance between the first initial point and the nearest point of the segmented image using the Euclidean equation. In the case of the image in Figure 6, it is known that the initial point of the 1st mask has the 2 closest distances to the image pixel to be segmented, namely pixels (6.4) and (4.6), therefore the calculation of the distance between the 2 pixels is as follows:
$\begin{aligned} & \operatorname{Eeks}(\mathrm{Pl}(6,4))=\sqrt{(0-6)^2+(0-4)^2}=\sqrt{36+16}=\sqrt{52}=7,211 \\ & \operatorname{Eeks}(\mathrm{Pl}(4,6))=\sqrt{(0-4)^2+(0-6)^2}=\sqrt{16+36}=\sqrt{52}=7,211\end{aligned}$
The external energy from the two nearest points will be taken by one of the smallest values (7.211). Once both energies are known, the next step is to sum the internal and external energy values to find out the total energy value.
$E=E_{\text {int }}+E_{e k s t}=22,9+7,211=30,111$
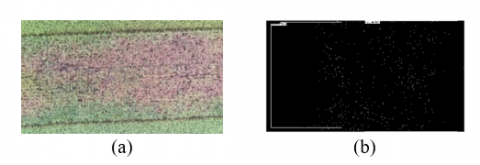
The calculation to find out the energy of other initial points can use the same method, namely calculating the external and internal energy values. Thus, the illustration of the energy calculation method that has been carried out above will be used to calculate the segmentation of the contour in the image of infected rice plants. Figure 7(a) shows the original image of the infected rice plant which is an input dataset as a segmented image. Meanwhile, Figure 7(b) is the initial point of the mask as the basis for determining the energy in the contour segmentation process. Using Matlab 2020a software, the boundaries of the edges of the segmented object image are calculated. Segmentation here is carried out to find out the location of the infected rice plant area, therefore the initial points consist of several points due to the size of the infected rice plant area.
Figure 7. (a) Original image of the rice plant, (b) Image of initial mask
Active contour segmentation is a method in image processing that aims to identify and isolate certain objects in an image using adaptive mathematical curves. This method is also known as "Snake" or "Curve Evolution". Initialization of masks in image segmentation is the first step in determining the initial segmented area or region. Masks serve as a guide or initial clue for segmentation algorithms to begin the process of identifying and isolating the object in question from the background of the image. Once the mask is initialized, the segmentation algorithm can then be applied to improve or refine the results by identifying and isolating objects based on those guidelines. Figure 8(a) is a contour segmentation image in a binary imagery version. Binary color 0 (black) is the area of healthy rice plants while the image of binary color 1 (white) is the area of infected rice plants. Meanwhile, Figure 8(b) is the final result of the image of rice plants that have been segmented into contours. Segmentation images are the result of a merging operation between segmented binary images and native images.
Figure 8. (a) Segmented binary image, (b) Segmented image
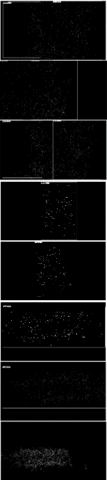
The choice of mask initialization method depends on the characteristics of the image and the purpose of segmentation. The initial mask is combined with the original image to figure out the desired object, be it an RGB image or a binary image, using a subtract operation. The subtract operation itself is an operation to merge 2 images by subtracting or adding pixel values from the two images. Table 2 shows some of the segmentation results in infected plants.
Table 2. Results of segmentation of images of infected rice plants
|
Image |
Initialization Mask |
Binary Image |
Image Segmentation |
Once the limitations of the object are known, the next step is to represent the segmented binary image into a matrix. The binary pixel values of the segmented image are used to calculate the area of the segmented area. The pixel value of a binary image is easier to calculate than a color image. Next, the area and parameters are calculated to find out the circumference and area of the segmented object. However, in this case, the circumference and area of the object are still in pixels and are used as the first step in determining the area of the object in meters. The overall area and circumference results of segmented infected rice plants are shown in Table 3.
Table 3. Calculation of the area of segmentation results
|
File Name |
Area (Pixels) |
Perimeter (Pixels) |
|
0673_5m |
7.735.464 |
12.021 |
|
0674_5m |
7.732.522 |
11.716 |
|
0675_5m |
6.537.647 |
10.365 |
|
0676_5m |
5.951.364 |
10.506 |
|
0677_5m |
5.887.399 |
9.844 |
|
0678_5m |
6.123.781 |
10.036 |
|
0679_5m |
5.791.583 |
9.811 |
|
0680_5m |
5.518.444 |
10.190 |
|
0681_5m |
5.983.582 |
10.288 |
|
0682_5m |
5.967.655 |
9.901 |
|
0683_5m |
5.924.898 |
10.144 |
|
0684_5m |
6.000.126 |
10.212 |
|
0686_5m |
6.001.835 |
9.924 |
|
0730_5m |
6.502.658 |
10.629 |
|
0731_5m |
6.519.987 |
10.346 |
|
0732_5m |
5.308.862 |
9.492 |
|
0733_5m |
5.431.985 |
9.230 |
|
0745_10m |
2.819.441 |
7.198 |
|
0746_10m |
2.883.250 |
7.192 |
|
0747_10m |
2.803.012 |
7.288 |
|
0748_10m |
2.940.235 |
7.849 |
|
0749_10m |
2.940.235 |
7.849 |
|
0750_10m |
2.940.235 |
7.849 |
|
0751_10m |
3.004.073 |
7.772 |
|
0752_10m |
3.159.232 |
7.859 |
|
0753_10m |
3.321.375 |
8.557 |
|
0754_10m |
3.287.788 |
7.774 |
|
0755_10m |
3.246.837 |
7.885 |
|
0824_10m |
5.645.535 |
11.142 |
|
0826_10m |
5.418.900 |
10.857 |
|
0837_10m |
5.636.315 |
10.973 |
|
0851_20m |
3.014.845 |
9.533 |
|
0852_20m |
3.571.316 |
9.752 |
|
0853_20m |
3.106.444 |
9.096 |
|
0854_20m |
3.114.282 |
10.023 |
|
0855_20m |
3.159.139 |
9.818 |
|
0856_20m |
3.126.320 |
10.257 |
|
0857_20m |
2.535.941 |
8.255 |
|
0858_20m |
2.516.728 |
8.151 |
|
0859_20m |
2.526.117 |
7.606 |
|
0860_20m |
2.029.766 |
7.843 |
|
0861_20m |
1.521.023 |
6.889 |
|
0862_20m |
1.658.865 |
6.741 |
|
0863_20m |
1.658.467 |
7.255 |
|
0864_20m |
5.506.910 |
9.923 |
In Figure 9, a graph is shown of an area of the infected plant image. From the graph, it can be known that the value of the infected area from all images of rice plants. The image of infected rice plants can be known by applying contour segmentation, but there are some images of rice plants that produce inappropriate area values or do not have infected areas only. This is because there are restrictions on healthy and infected areas that are not limited by a clear image. Based on the validation of the segmentation results by the agricultural office related to the object of research, the best results were obtained from the segmentation of infected images with a value of 97.02% and an inappropriate value of 2.80%.
Figure 9. Area of infected plant image
In the paper, we propose a new segmentation model called CTFFNet that combines Convolutional Neural Network (CNN) and Transformer for weed segmentation in remote sensing images of rice fields. This is based on a comparison of the contour segmentation results of infected rice plant detection, specifically by comparing it with research conducted by Guo et al. [36] Using Transformer and Residual CNN, we create two feature extraction modules that generate both local visual and global semantic features. In the feature fusion step, we employ an attention mechanism for dynamic feature selection and integration to merge these complementary traits efficiently. This aids in the model's automatic learning of the significance of various features for the adaptive fusion of local and global data. The segmentation performance is improved by the Intersection of Union (IoU) segmentation results, which yield a value of 72.8 [36].
The results of the study on the detection of infected plants using changes in threshold values in contour segmentation obtained a value of 97.02% of the predicted results were the same as the real conditions and 2.80% of the predictions were different from the real conditions. The results of this study have been validated by the relevant Agriculture Service, namely by comparing the segmentation results with the real conditions that occur in rice fields. Thus, the detection results using the drone camera image dataset and applying the contour segmentation method can be used as a reference in detecting infected or healthy rice crops. Suggestions from further research are the use of segmentation combined with the latest version of the object detection algorithm.
Thank you to the Directorate of Research, Technology and Community Service of the Ministry of Education, Culture, Research, and Technology of the Republic of Indonesia for funding this research through the 2024 Regular Fundamental Research scheme. In addition, we also express our gratitude to the Muhammadiyah University of Ponorogo and several parties who have provided assistance and support for the implementation of this research.
[1] FAS USDA. Production-Rice. https://fas.usda.gov/data/production/commodity/0422110/, accessed on Dec.12, 2024.
[2] Liu, L., Xie, Y., Zhu, B., Song, K. (2024). Rice leaf chlorophyll content estimation with different crop coverages based on Sentinel-2. Ecological Informatics, 81: 102622. https://doi.org/10.1016/j.ecoinf.2024.102622
[3] Septiarini, A., Hamdani, H., Hatta, H.R., Anwar, K. (2020). Automatic image segmentation of oil palm fruits by applying the contour-based approach. Scientia Horticulturae, 261: 108939. https://doi.org/10.1016/j.scienta.2019.108939
[4] Badiger, M., Mathew, J.A. (2023). Tomato plant leaf disease segmentation and multiclass disease detection using hybrid optimization enabled deep learning. Journal of Biotechnology, 374: 101-113. https://doi.org/10.1016/j.jbiotec.2023.07.011
[5] Gutierrez, A., Ansuategi, A., Susperregi, L., Tubío, C., Rankić, I., Lenža, L. (2019). A benchmarking of learning strategies for pest detection and identification on tomato plants for autonomous scouting robots using internal databases. Journal of Sensors, 2019(1): 5219471. https://doi.org/10.1155/2019/5219471
[6] Hasan, S., Jahan, S., Islam, M.I. (2022). Disease detection of apple leaf with combination of color segmentation and modified DWT. Journal of King Saud University-Computer and Information Sciences, 34(9): 7212-7224. https://doi.org/10.1016/j.jksuci.2022.07.004
[7] Chaudhari, V., Patil, M.P. (2023). Detection and classification of banana leaf disease using novel segmentation and ensemble machine learning approach. Applied Computer Systems, 28(1): 92-99. https://doi.org/10.2478/acss-2023-0009
[8] Castillo-Martínez, M.Á., Gallegos-Funes, F.J., Carvajal-Gámez, B.E., Urriolagoitia-Sosa, G., Rosales-Silva, A.J. (2020). Color index based thresholding method for background and foreground segmentation of plant images. Computers and Electronics in Agriculture, 178: 105783. https://doi.org/10.1016/j.compag.2020.105783
[9] Chouhan, S.S., Singh, U.P., Sharma, U., Jain, S. (2021). Leaf disease segmentation and classification of Jatropha Curcas L. and Pongamia Pinnata L. biofuel plants using computer vision based approaches. Measurement, 171: 108796. https://doi.org/10.1016/j.measurement.2020.108796
[10] Al-Zyoud, W., Erekat, D., Saraiji, R. (2023). COVID-19 chest X-ray image analysis by threshold-based segmentation. Heliyon, 9(3): e14453. https://doi.org/10.1016/j.heliyon.2023.e14453
[11] Wang, G., Guo, S., Han, L., Cekderi, A.B. (2022). Two-dimensional reciprocal cross entropy multi-threshold combined with improved firefly algorithm for lung parenchyma segmentation of COVID-19 CT image. Biomedical Signal Processing and Control, 78: 103933. https://doi.org/10.1016/j.bspc.2022.103933
[12] Wang, N., Hu, L., Walsh, A.J. (2024). Evaluation of Cellpose segmentation with sequential thresholding for instance segmentation of cytoplasms within autofluorescence images. Computers in Biology and Medicine, 179: 108846. https://doi.org/10.1016/j.compbiomed.2024.108846
[13] Zhang, S., Zhang, C. (2023). Modified U-Net for plant diseased leaf image segmentation. Computers and Electronics in Agriculture, 204: 107511. https://doi.org/10.1016/j.compag.2022.107511
[14] Masykur, F., Adi, K., Nurhayati, O.D. (2022). Classification of paddy leaf disease using MobileNet model. In 2022 IEEE 8th International Conference on Computing, Engineering and Design (ICCED), Sukabumi, Indonesia, pp. 1-4. https://doi.org/10.1109/ICCED56140.2022.10010535
[15] Van Do, Q., Hoang, H.T., Van Vu, N., De Jesus, D.A., Brea, L.S., Nguyen, H.X., Nguyen, A.T.L., Le, T.N., Dinh, D.T.M., Nguyen, M.T.B., Nguyen, H.C., Bui, A.T.V., Le, H.V., Gillen, K., Vu, T.T., Luu, H.M. (2024). Segmentation of hard exudate lesions in color fundus image using two-stage CNN-based methods. Expert Systems with Applications, 241: 122742. https://doi.org/10.1016/j.eswa.2023.122742
[16] Gonzalez, R.C., Woods, R.E. (2002). Digital Image Processing (2nd Edition). Prentice Hall.
[17] Kass, M.L., Van Soest, P.J., Pond, W.G., Lewis, B., McDowell, R.E. (1980). Utilization of dietary fiber from alfalfa by growing swine. I. Apparent digestibility of diet components in specific segments of the gastrointestinal tract. Journal of Animal Science, 50(1): 175-191. https://doi.org/10.2527/jas1980.501175x
[18] Setyansyah, R., Siregar, Y.S., Khairani, M. (2021). Noise removal pada citra digital dengan menggunakan metode active contour. Algoritma Journal Ilmu Komputer dan Informatika., 5(1): 978-979. http://dx.doi.org/10.30829/algoritma.v5i2.10700
[19] Tang, L., Shao, G.F. (2015). Drone remote sensing for forestry research and practices. Journal of Forestry Research, 26(4): 791-797. https://doi.org/10.1007/s11676-015-0088-y
[20] Yang, Q., Shi, L.S., Han, J.Y., Zha, Y.Y., Zhu, P.H. (2019). Deep convolutional neural networks for rice grain yield estimation at the ripening stage using UAV-based remotely sensed images. Field Crops Research, 235: 142-153. https://doi.org/10.1016/j.fcr.2019.02.022
[21] Van der Merwe, D., Burchfield, D.R., Witt, T.D., Price, K.P., Sharda, A. (2020). Chapter One-Drones in Agriculture. Advances in Agronomy, 162: 1-30. https://doi.org/10.1016/bs.agron.2020.03.001
[22] Wu, D., Lv, S., Jiang, M., Song, H. (2020). Using channel pruning-based YOLO v4 deep learning algorithm for the real-time and accurate detection of apple flowers in natural environments. Computers and Electronics in Agriculture, 178: 105742. https://doi.org/10.1016/j.compag.2020.105742
[23] Al-Rami, B., Alheeti, K.M.A., Aldosari, W.M., Alshahrani, S.M., Al-Abrez, S.M. (2022). A new classification method for drone-based crops in smart farming. International Journal of Interactive Mobile Technologies, 16(9): 164-174, 2022. https://doi.org/10.3991/ijim.v16i09.30037
[24] Chen, W.L., Lin, Y.B., Ng, F.L., Liu, C.Y., Lin, Y.W. (2019). RiceTalk: Rice blast detection using Internet of Things and artificial intelligence technologies. IEEE Internet of Things Journal, 7(2): 1001-1010. https://doi.org/10.1109/JIOT.2019.2947624
[25] Masykur, F., Prasetyo, A., Widaningrum, I., Cobantoro, A.F., Setyawan, M.B. (2020). Application of message queuing telemetry transport (MQTT) protocol in the internet of things to monitor mushroom cultivation. In 2020 7th International Conference on Information Technology, Computer, and Electrical Engineering (ICITACEE), Semarang, Indonesia, pp. 135-139. https://doi.org/10.1109/ICITACEE50144.2020.9239118
[26] Wahab, I., Hall, O., Jirström, M. (2018). Remote sensing of yields: Application of UAV imagery-derived NDVI for estimating maize vigor and yields in complex farming systems in sub-saharan africa. Drones, 2(3): 28. https://doi.org/10.3390/drones2030028
[27] Jasim, W.N., Almola, S.A.S., Alabiech, M.H.H., Harfash, E.J. (2022). Citrus diseases recognition by using CNN. Informatica, 46(7): 85-94. https://doi.org/10.31449/inf.v46i7.4284
[28] Junos, M.H., Mohd Khairuddin, A.S., Thannirmalai, S., Dahari, M. (2022). Automatic detection of oil palm fruits from UAV images using an improved YOLO model. The visual computer, 38(7): 2341-2355. https://doi.org/10.1007/s00371-021-02116-3
[29] Inoue,Y., Yokoyama, M. (2019). Spectral and 3D measurement by drone-based remote sensing of farmland-geo-lnformation for smart farming. Journal of the Japan Society for Precision Engineering, 85(3): 236-242. https://doi.org/10.2493/jjspe.85.236
[30] Puri, V., Nayyar, A., Raja, L. (2017). Agriculture drones: A modern breakthrough in precision agriculture. Journal of Statistics and Management Systems, 20(4): 507-518. https://doi.org/10.1080/09720510.2017.1395171
[31] Wang, Q., Liu, Q., Zhang, S. (2020). Implementation of drone system in survey for tomato chlorotic spot virus. The Journal of Extension, 58(2): 20. https://doi.org/10.34068/joe.58.02.20
[32] Masykur, F., Adi, K., Nurhayati, O.D. (2023). Approach and analysis of Yolov4 algorithm for rice diseases detection at different drone image acquisition distances. TEM Journal, 12(2): 928-935. https://doi.org/10.18421/TEM122-39
[33] VV, S.V., Sowmya, V., Sivanpillai, R., Brown, G.K. (2024). Significance of AI-assisted techniques for epiphyte plant monitoring and identification from drone images. Journal of Environmental Management, 367: 121996. https://doi.org/10.1016/j.jenvman.2024.121996
[34] Rajagopal, M., Kayikci, S., Abbas, M., Sivasakthivel, R. (2024). A novel technique for leaf disease classification using Legion Kernels with parallel support vector machine (LK-PSVM) and fuzzy C means image segmentation. Heliyon, 10(12): e32707. https://doi.org/10.1016/j.heliyon.2024.e32707
[35] Dong, B., Weng, G.R., Bu, Q.Q., Zhu, Z.C., Ni, J. (2024). An active contour model based on shadow image and reflection edge for image segmentation. Expert Systems with Applications, 238(Part F): 122330. https://doi.org/10.1016/j.eswa.2023.122330
[36] Guo, Z.H., Cai, D.D., Jin, Z.Y., Xu, T.Y., Yu, F.H. (2025). Research on unmanned aerial vehicle (UAV) rice field weed sensing image segmentation method based on CNN-transformer. Computers and Electronics in Agriculture, 229: 109719. https://doi.org/10.1016/j.compag.2024.109719