Akkala Yugandhara Reddy*![]() | Tarakeswara Rao Balaga
| Tarakeswara Rao Balaga![]()
© 2025 The authors. This article is published by IIETA and is licensed under the CC BY 4.0 license (http://creativecommons.org/licenses/by/4.0/).
OPEN ACCESS
Rice (Oryza sativa) is a linchpin of global food security, feeding most of the world’s population, especially in Asia and Africa. Nitrogen (N), Phosphorus (P), and Potassium (K) must be held in precise equilibrium for rice to grow right and produce well. A lack of these nutrients can put plant health at risk, causing poor yields that result in huge economic losses to farmers. This means it is important to have an accurate diagnosis done on time so that corrective measures can be taken to ensure the sustainability of rice cultivation. Conventional techniques used to detect nutrient deficiencies in rice plants like manual inspection and biochemical testing are frequently inadequate. Manual inspection may be effective, but it is laborious, subjective, and unworkable when working on a large-scale farm. On the other hand, the accuracy of biochemical tests does not compensate for their time-consuming nature, their cost as well as the need for specialized equipment and expertise; this makes them inaccessible to many smallholder farmers. This research proposes Attention SqueezeNet-a streamlined deep learning model aimed at overcoming such limitations. Attention SqueezeNet leverages the Kaggle “Nutrient Deficiency Symptoms in Rice” dataset by including an attention mechanism that focuses on significant visual features associated with N P K deficiency on rice leaves. Compared with traditional methods, therefore, these focused areas enable more accurate diagnostic results from the model as opposed to conventional methods which diagnose diseases broadly rather than focusing on specific symptoms. In this context, we propose: i) developing a robust Attention SqueezeNet model specifically aimed at categorizing nutrient deficiencies in rice plants; ii) making the model more robust against unseen data variations through pre-processing and augmenting existing dataset; iii) comparing the performance of Attention SqueezeNet with existing deep learning models in terms of accuracy and efficiency per computational unit utilized (CU). The results show that Attention SqueezeNet has better classification accuracy compared to state-of-the-art models and is more computationally efficient than them. This has resulted in the transformation of agriculture through automation and objectivity in diagnosis of nutrient deficiency which ensures sustainable crop management practices towards global food security.
deep learning, SqueezeNet, agriculture, rice plant, leaf images
The global food security is dependent on the presence of rice (Oryza sativa), a crop that feeds over 50% of the world’s population with its main consumption in places like Asia, and Africa. Proper growth of rice has to do with ensuring that critical nutrients including Nitrogen (N), Phosphorus(P), and Potassium(K) [1] are well balanced in the soil. Any deficiency in any of these elements is disastrous for the health of rice plants [2], resulting in low yields, as well as high losses to farmers. Therefore, there is a need to promptly diagnose nutrient deficiencies to apply appropriate remedial measures and ensure sustainable rice production. Traditional methods [3-8] for diagnosis of nutritional disorders in rice plants are mainly based on manual observation by agronomists and some biochemical tests. Although manual observation may be successful; however, it is labor intensive, subjective, and limited in terms of scale. On the other hand, while biochemical tests have been proven to be accurate, they are often expensive, time-consuming and require specialized laboratory facilities that are not available to small-scale farmers [9-11]. Therefore, there is a need for new diagnostic techniques that are automated, objective, cost-effective, and adaptable across different farming environments.
Recently developed deep learning techniques can solve this problem by enabling automatic detection of plant nutrient deficiencies at high accuracy rates. Convolutional Neural Networks (CNNs) [12-16] have widely demonstrated their effectiveness in plant pathology applications [17-25]. Nevertheless, these models continuously face several challenges such as being computationally burdensome [26-29] requiring huge computational abilities [20-35] that are not readily available an inability to classify subtle changes seen in symptoms caused by nutrient deficiency [36-38]. This paper discusses Attention SqueezeNet as a deep learning model customized for identifying nutritional disorders through leaf images captured from rice plants. Attention SqueezeNet provides several advantages compared to conventional CNN architectures including its lightweight nature which takes less processor power and memory. Also, it includes an attention mechanism that guides the model to focus on the most important parts in the rice leaves images, hence capturing minute visual dissimilarities caused by specific nutrient deficiencies.
The objectives of this research are:
1. Develop a strong variation of the Attention SqueezeNet model, for the identification and categorization of nutrient deficiencies in the leaves of rice plants regarding nitrogen (N), phosphorus (P), and potassium (K) nutrients with a classification threshold of precisely 95 percent on the “Nutrient-Deficiency-Symptoms-in-Rice” dataset.
2. Further, augment the Kaggle dataset on “Nutrient-Deficiency-Symptoms-in-Rice” and select advanced techniques to augment the dataset so that the drop in the performance of the model on unseen data is less than 2%.
3. Compare the performance of the proposed model in accuracy, computational complexity, and resource requirements of the proposed Attention SqueezeNet model with other advanced deep learning models such as ResNet and MobileNet. The proposed model of comparison should be not only acceptable in its accuracy but also at least 10% more efficient than the other models.
4. To understand how effective the attention mechanism is in improving feature extraction and the final classification, additional experiments should be made that measure the contribution of this mechanism to the overall classification accuracy, at least a 5% increase compared with a model without an attention mechanism.
5. Perform an error analysis of the proposed model’s predictions, get specific examples of failure cases (e.g., misclassification of nutrient deficiencies), and evaluate the model’s performance for different categories of deficiencies to ensure equal performance without NOM class that has less than 5 % class imbalance.
The organization of this article is in the following order: a literature survey discussed in section 2, which provides an overview of existing approaches and their limitations. The proposed work is explained in section 3, where Attention SqueezeNet architecture and experimental setup are discussed. Results and discussions are presented in Section 4, which puts more emphasis on the performance of the proposed model vis-vis other deep learning models. Finally, section five summarizes the findings in this paper and suggests further research directions”.
The automated system that Asraf et al. [15] developed for the purpose of detecting deficiencies in oil palm plants was focused on nitrogen, phosphorus, and magnesium. This was done by applying an SVM with various kernels such as linear and polynomial along with hard and soft margins, which reached 95% accuracy classification rate using polynomial kernel functions. The findings illustrate that the geographical production region is an important factor in predicting nutritional deficiencies based on their study. Sethy et al. [16] formulated a technique that can be used to diagnose mineral shortages in rice crops. In this way, they employed K-Means and fuzzy C-Means clustering techniques for feature extraction and combined it with an SVM classifier. They were 85% accurate at diagnosing the deficiency of these mineral elements from the soil samples given.
Despite showing some promising results, supervised machine learning has been less effective than ANN or CNN when it comes to image classification tasks. Tomatoes suffering from deficiencies of nitrogen, phosphate, or potassium were diagnosed via a CNN model as an example by Cevallos et al. [17]. This model attained an accuracy rate of 86.57% since it had applied a data augmentation process to increase the number of training samples available for this approach as well as tweaking hyper-parameters until optimal results could be achieved. However, transfer learning can help to solve issues related to the lack of large datasets in agricultural settings. In recent research carried out by Han and Watchareeruetai [18], pre-trained ResNet50 using transfer learning was adopted to determine nutrient imbalances among black gram varieties. On a test dataset containing six types represented by 4088 images, the model returned a testing accuracy value equaling 65.44 percent.
When it comes to analyzing vast quantities of features from unstructured data, deep learning is very effective. In the study by Sethy et al. [19], six different DL architectures were used in conjunction with SVM to detect nitrogen insufficiency. ResNet50+SVM achieved the highest level of accuracy, which was 99.84%. A similar approach was used by Bahtiar et al. [20], who identified nutritional deficits in chili plants by using an R-CNN Inception v2 mask model and achieved an accuracy rate of 82.6%. Wulandhari et al. [5] proved that fine-tuning further increases the accuracy of deep learning models.
Recent studies on deep learning have investigated a variety of CNN models that have already been pre-trained for image processing. According to recommendation [21], InceptionV3, ResNet50, NasNet-Large, and DenseNet121 models were used in conjunction with transfer learning and fine-tuning to identify eleven distinct nutritional deficits in rice. DenseNet121 achieved an accurate rate of 97.44%. Using SegNet (segmentation) and InceptionV3 (classifier) on 3000 pictures, Taha et al. [22] compared a DCNN model against standard machine learning for the purpose of determining the nutritional quality of lettuce grown in aquaponics. They were able to achieve 96.5% accuracy in their identification of the classification.
In addition, the combination of CNN and LSTM models has shown results that are encouraging. An example of this would be a CNN-LSTM combo that categorized oilseed rape crops according to their nutritional status, with InceptionV3-LSTM attaining an accuracy rate of 95% [23]. Additionally, to identify shortages in nitrogen, phosphorus, potassium, and calcium in sugar beet plants, six transfer learning models were used in conjunction with data augmentation. These models were AlexNet, VGG16, ResNet101, DenseNet161, and SqueezeNet [24].
Overall, different machine learning and deep learning models have been successfully used to estimate nutrient deficiency in plants with certain merits as follows, though there also are certain drawbacks. In image-based tasks, especially in complex agriculture scenario, conventional supervised machine learning like SVM and mainly clustering methodology have issues related to scalability and generalization. CNNs are deep learning models that work very well when there is sufficient data for training and validation with variation in the dataset which is not always available in agriculture, which at times results in overfitting. This problem has been somewhat reduced by transfer learning and fine-tuning, yet even models such as ResNet50 and DenseNet121 depend on the quantity and quality of the input data, as well as accompanying data augmentation. Moreover, the incorporation of architectures including CNN-LSTM or other variants includes higher computational demands and resources which may be hard to suit in resource challenged agricultural systems. In addition, most research is crop or region-specific and there is limited evidence for their versatility across different regions and crops thereby restricting their usage of such systems across different geographic and agricultural domains.
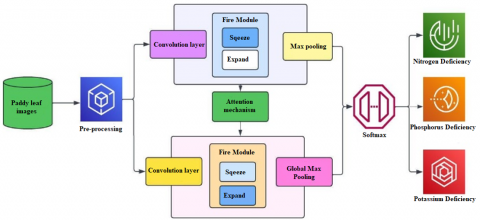
This research proposes an Attention SqueezeNet model for classifying nutrient deficiencies in rice plant leaves. The model leverages the efficiency of SqueezeNet architecture while incorporating an attention mechanism to focus on critical visual features associated with deficiencies (Figure 1).
Figure 1. Proposed Attention SqueezeNet
3.1 Input layer
$inpu{{t}_{data}}~$which represents an image of a rice plant, to the variable x. This image will be processed by the network to predict the presence or absence of nutrient deficiencies.
$x=inpu{{t}_{data}}$
3.2 Squeeze layer
The squeeze layer aims to reduce the number of channels in the input data.
It performs a convolution operation with the input x using the squeeze layer weights ${{W}_{s}}~$and adds the squeeze layer bias ${{b}_{s}}$. This convolution process extracts features from the input.
The resulting output $ou{{t}_{c}}$ is then passed through an activation function (e.g., ReLU) to introduce non-linearity and improve model performance.
$ou{{t}_{c}}={{W}_{s}}*x+{{b}_{s}}$
$ou{{t}_{c}}~=~activation\left( ou{{t}_{c}} \right)$ # ReLU or other activation function
$ou{{t}_{c}}$: Output channels
${{W}_{s}}:~$Squeeze layer weights
${{b}_{s}}$: Squeeze layer bias
activation: Activation function ReLU
3.3 Expand layer (without attention)
The expand layer aims to increase the number of channels in the data processed by the squeeze layer.
It performs another convolution operation with the previous output $ou{{t}_{c}}~$using the expand layer weights ${{W}_{e}}$ and adds the expand layer bias ${{b}_{e}}$.
Like the squeeze layer, an activation function is applied to introduce non-linearity.
$ou{{t}_{c}}={{W}_{e}}*ou{{t}_{c}}+{{b}_{e}}$
$ou{{t}_{c}}=activation\left( ou{{t}_{c}} \right)$
$ou{{t}_{c}}$: Output channels
${{W}_{e}}$: Expand layer weights
${{b}_{e}}$: Expand layer bias
3.4 Expand layer (with attention)
This version of the expand layer incorporates an attention mechanism to focus on relevant features.
It first computes attention weights using a separate convolution operation with $ou{{t}_{c}}$, weights ${{W}_{a}}$, and bias ${{b}_{a}}$.
The sigmoid activation function normalizes these attention weights between 0 and 1, indicating the importance of each channel.
Subsequently, the informative features are intensified by the attention weights that are multiplied elementwise with $ou{{t}_{c}}$.
Lastly, a standard convolution which is activated with ${{W}_{e}}$, bias ${{b}_{e}}$ and is applied to the weighted output.
$ou{{t}_{c}}={{W}_{e}}*\left( ou{{t}_{c}}*attention \right)+{{b}_{e}}$
$attention=sigmoid\left( {{W}_{a}}*ou{{t}_{c}}+{{b}_{a}} \right)$
$ou{{t}_{c}}=activation\left( ou{{t}_{c}} \right)$
${{W}_{a}}$: Attention layer weights
${{b}_{a}}$: Attention layer bias
3.5 Average pooling
There is an alternative method for reducing the spatial dimensions of $ou{{t}_{c}}$ (height and width).
Average pooling computes the mean of values in over a specified window size ($poo{{l}_{size}})$ in $ou{{t}_{c}}$.
This minimizes overfitting by allowing the model to adjust better even with minor shifts between images.
$poole{{d}_{out}}=av{{g}_{pool}}\left( ou{{t}_{c}},poo{{l}_{size}} \right)$
3.6 Concatenation
This is another possible choice that joins the initial output $ou{{t}_{c}},~$with pooled output $poole{{d}_{out}}~$by joining them across one axis (usually the channel dimension). In this way, the model can learn from both original feature maps and reduced spatial information captured during pooling.
$combine{{d}_{out}}=concatenate\left( \left[ ou{{t}_{c}},poole{{d}_{out}} \right] \right)$
3.7 Dense layer
The dense layer is the final layer before the output layer. It aims to map the extracted features in $ou{{t}_{c}}$ to a set of logits, one for each possible nutrient deficiency class (C).
This is achieved by a fully connected operation with the output from the previous layer ($ou{{t}_{c}}$) and weights specific to the dense layer.
$logits=dense\left( ou{{t}_{c}},C \right)$
C: Number of output classes
3.8 SoftMax function
The SoftMax function takes the logits from the dense layer and converts them into class probabilities.
These probabilities represent the likelihood of each possible nutrient deficiency class, ensuring they sum to 1.
The class with the highest probability is predicted as the deficiency present in the rice plant image.
$probabilities~=~softmax\left( \text{log}its \right)$
3.9 Loss function
$loss=cros{{s}_{entropy}}\left( probabilities,tru{{e}_{lable}} \right)$
Algorithm 1 illustrates the Attention SqueezeNet model. The model takes pre-processed rice leaf images as input. These images are typically resized to a standard size of 224×224 pixels with three channels representing RGB color information. Conv1: The first convolutional layer extracts initial features from the input image. It uses a 7×7 filter with 96 output channels and a stride of 2. This means the filter scans the image with a stride of 2 pixels in both width and height, reducing the spatial resolution of the feature maps. A ReLU (Rectified Linear Unit) activation function is then applied to introduce non-linearity and improve model learning. Finally, a 3×3 max pooling operation with a stride of 2 further reduces the spatial resolution while capturing the maximum activation within a local region.
Fire Modules: These are the repeated building blocks of SqueezeNet, responsible for learning complex features from the data. The model contains several Fire Modules (Fire2-FireN) that are stacked one after another. Each of these Fire Modules has two major components namely, Squeeze Layer: This layer uses a 1×1 convolutional layer with fewer filters than Conv1 (for instance, 16 filters). It is meant to reduce the feature maps’ dimensionality for computational efficiency. Expand Layer: This layer is used for identifying more complex features using less information and it has two branches namely, expand 1×1: This sub-branch employs a small size filter compared to squeeze layer such as 64 filters.
Expand 3×3: On the other hand, this part uses a filter with similar number of filters as the previous branch yet bigger size i.e. 64 filters only. In short, applying both the convolutions of size 1 by 1 and convolutions of size 3 by 3 enables the network to take care of local as well as global properties within an image. By merging both expand Branches results in richer informative feature representation. Attention Mechanism: This is a key innovation incorporated into the standard SqueezeNet architecture. It aims to direct the model's focus towards critical regions of the rice leaf image that are most relevant for nutrient deficiency classification. While specific implementations may vary, the general approach involves:
|
Algorithm 1: Attention Squeeznet |
|
1. Initialize weights and biases: ${{W}_{s}},{{b}_{s}}$: Initialize squeeze layer weights and biases ${{W}_{e}},{{b}_{e}}$: Initialize expand layer weights and biases ${{W}_{a}},{{b}_{a}}$: Initialize attention layer weights and biases ${{W}_{dense}},{{b}_{dense}}$: Initialize dense layer weights and biases # Initialize weights and biases for the squeeze, expand, attention, and dense layers. # Loop through the Dataset: 2. For each image in the dataset:
3. Prediction: $predicte{{d}_{class}}=np.argmax\left( probabilities \right)$ |
Integrating the Attention Module: Typically placed after Squeeze layer in each fire module. Attention Map Generation -This generates attention map that highlights important channels or location within feature maps predominantly in identifying nutritional deficiencies. Feature Refinement –In addition, this attention map is element wise multiplied by original feature map coming out from same fire module which ultimately emphasizes on critical features relying upon guidance provided by attention mechanism thereby possibly leading to enhanced classification accuracy. Conv10 – The last convolutional layer that uses 1×1 filter which is aimed to reduce the feature map size into few channels corresponding to number of nutrient deficiency classes (usually 3 for Nitrogen, Phosphorus, and Potassium deficiencies).
Global Average Pooling – This reduces dimensionality of the feature maps further by averaging on channel values so that outcome becomes a single vector. SoftMax: This function will convert the output vector elements into probabilities which reflect how confident the model is in each nutrient-deficiency class. In such cases, there may be higher or lower confidence levels on specific types of deficiencies. Conv10: The final convolutional layer is regarded as one of a kind, it employs 1×1 filters and shrinks the feature map dimensions to several channels matching different nutrient deficiency types usually up to 3 for Nitrogen, Phosphorous and Potassium deficiencies.
Global Average Pooling: Dimensionality of feature maps decreases through this layer by averaging over values within each channel to obtain a single feature vector. SoftMax: Lastly, applying this function computes a probability from every element in the resultant vector so that we can determine how many nutrient-deficiency cases have been predicted with high or low confidence levels amongst other things. Overall, the proposed Attention SqueezeNet model combines the efficiency of SqueezeNet with the benefits of an attention mechanism. It allows these models to focus on crucial visual cues in rice leaf images hence leading to improved diagnosis accuracies for malnutrition.
4.1 Dataset
The "Nutrient-Deficiency-Symptoms-in-Rice" dataset used in this study was sourced from Kaggle and contains 1,156 labeled images of rice plant leaves showing deficiencies in three essential nutrients: These are the three main Plant nutrients that are usually referred to by acronym NPK. The Nitrogen deficiency has 440 images, Phosphorus deficiency 333 and Potassium deficiency has 383 images. These images differ concerning their resolution and file type: On the one hand, these images show various visual manifestations of nutrient deficiencies. I believe that the data set established here can be used effectively to develop Markov models for diagnosing these deficiencies so that appropriate interferences can be taken to ensure the right crop is grown, at the right time, at the right place and in the right manner meeting the desired yields.
To ensure a fair and reliable evaluation of the proposed models, the dataset was split into training, validation, and testing sets using an 80:10:10 ratio. The samples were selected using a stratified technique to retain the class distribution in each of the sub-sets, therefore the proportions of each type of deficiency remained the same. This division will help the training set build up the model, the validation set fine tune the hyperparameters and finally the testing set to test the model. The size and categorization of this dataset is beneficial for the construction of more comprehensive solutions to detect nutrient deficiencies in rice crops.
SqueezeNet, InceptionResNetV2, and DCNN models’ performance are shown in the Figure 2 over ten epochs. From 90 percent at the beginning, DCNN model shows a gradual increase to reach 94.5 percent at the end. This indicated little but steady progress in nutrient deficiency diagnoses. On the other hand, InceptionResNetV2 starts at about ninety-one percent and has some growing pains that take it up as high as 94.9%. Nonetheless there is some instability in it because its last value is 93%. In contrast to this, Squeeze Net begins with an eighty nine percent accuracy rate but then goes through most impressive growth until about 98% by end of tenth epoch. The steadily increasing percentage values indicate that SqueezeNet has the highest ability to accurately detect any shortage of food substances within rice plants.
Figure 2. Accuracy
Figure 3. Precision
Three models are evaluated for their precision, which is the ratio of true positives to positive predictions in Figure 3. The DCNN model on the other hand has a starting precision of 89% and this steadily increases into a final epoch of 94.2%. This slow increase suggests that DCNN is getting better at identifying true nutrient deficiencies more accurately. InceptionResNetV2 starts at 90%, peaks at 94.6%, but drops slightly to 94% by the end thus indicating its inconsistency and volatility respectively. However, SqueezeNet commences with an initial accuracy rate of 92%, and gradually rises to be as high as 96%. This regularity points out how well SqueezeNet can identify nutrient deficiencies correctly reducing false positive errors.
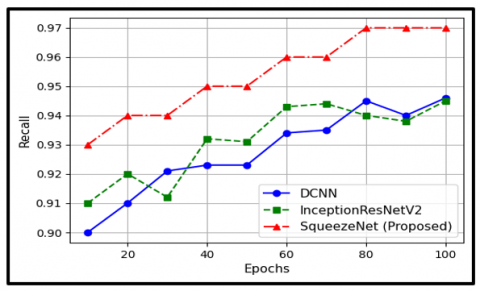
The Figure 4 shows the recall rates which measure that fraction of real positives correctly classified by the models. DCNN begins at 90% and grows steadily, achieving 94.6% by the last epoch, suggesting the improved ability to identify actual positive cases as time goes by. InceptionResNetV2 commences at 91% and reaches a maximum of 94.5% but has some slight fluctuations indicating less stable recall performance. SqueezeNet is better than both; it starts at 93% and rises consistently to 97%. Therefore, SqueezeNet is more accurate in detecting true positive cases of nutrient deficiencies, making it an extremely dependable diagnostic tool.
Figure 4. Recall
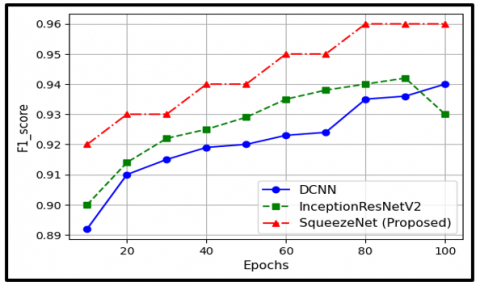
Figure 5. F1-score
Figure 5 shows the F1-Score which is a harmonic mean of precision and recall, therefore balancing the two metrics. DCNN begins with an F1-Score of 89.2%, rising slowly to reach 94% at the last epoch, thus advancing both precision and recall uniformly. InceptionResNetV2 commences at 90%, rises to peak at 94.2% but has oscillations resulting in it ending at 93%. This indicates its poor ability to maintain balanced precision and recall over time. SqueezeNet opens up with a value of 92% that increases monotonously up to the highest F1-Score value of 96% throughout the epochs. This reflects how well SqueezeNet performs in correctly identifying true positive cases while minimizing false positives during evaluation or learning process.
A decreasing flow of error predictions shows an improved performance in models as shown in Figure 6. There is a higher initial loss value for DCNN (0.153) and a significant drop to 0.115 which is still the highest among all the other models, implying that it learnt less effectively than others. For InceptionResNetV2, there was a huge improvement from 0.15 to 0.112 with little variations. At the beginning, SqueezeNet started at a value of 0.14 and gradually reduced up to 0.10 indicating that this has brought about the least loss values across epochs. The lowering loss values of SqueezeNet underscores its superior learning efficiency and excellent performance on minimizing prediction errors, thus making it the best model for diagnosis of nutrient deficiencies in rice plants.
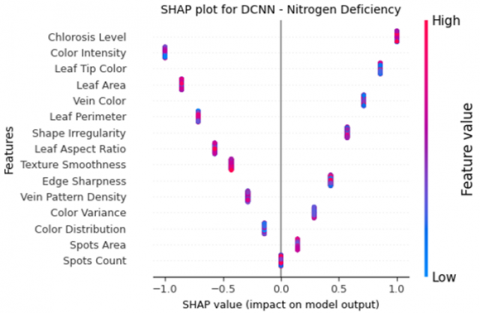
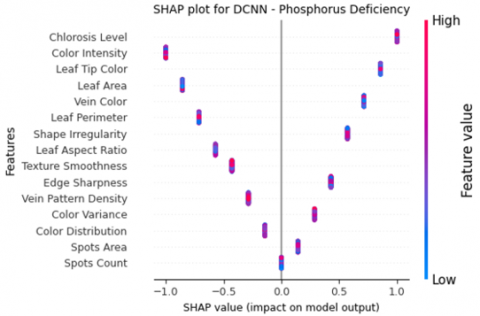
DCNNs excel in image recognition tasks by extracting features from raw pixel data hierarchically. In Figure 7, SHAP plots for feature impact analysis for DCNN has been shown, if “Leaf Area” or “Texture Smoothness” have high SHAP values, it means that they strongly predict nutrient deficiencies in rice plants. Multiple convolutional layers alternate with non-linearities to learn multiple levels of abstraction, allowing these networks to efficiently represent complex patterns in images. Interpreting DCNNs is hard due to their black-box nature. The SHAP plots help understand the importance of different features and specific visual cues like leaf morphology or colour distribution affecting nutrient deficiency predictions.
Figure 6. Loss
Figure 7. Impact of features for training DCNN on N, P, K deficiency in paddy
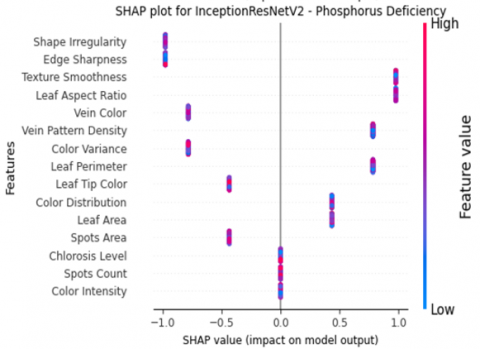
Figure 8. Impact of features for training InceptionResNetV2 on N, P, K deficiency in paddy
The inceptionResNetV2 merges the virtues of inception modules with residual connections that uplift feature extraction and gradient flow in the network. InceptionResNetV2 SHAP plots may show strong SHAP values for features such as “Leaf Perimeter” or “Vein Pattern Density”, which indicate their importance in diagnosing nutrient deficiencies. The architecture of this model enables it to efficiently learn fine details and diverse patterns in images of rice plants. This thus helps understand how these specific features are affecting predictions, thereby illustrating what the model thinks about image features associated with nutritional deficiency symptoms. InceptionResNetV2 does well on complex visual patterns as a result it is good for agricultural image analysis tasks (Figure 8).
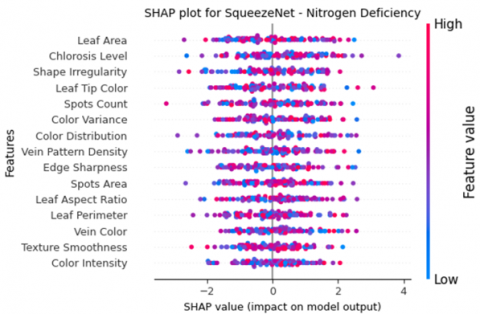
Figure 9. Impact of features for training proposed Attention-SqueezeNet on N, P, K deficiency in paddy
SqueezeNet’s lightweight architecture is meant to give high accuracy by reducing model size and computational cost. In SHAP plots for SqueezeNet, the features ‘Color Intensity’ and ‘Spots Count’ may display large SHAP values, thus indicating their relevance in predicting nutrient deficiencies. This model utilizes feature information efficiently yet retains its predictive accuracy, a trait that makes it ideal for resource-scarce situations like embedded systems or mobile applications. SHAP plots are useful because they show which visual characteristics of rice plant leaves best reveal nutrient deficiencies. The straightforward design of SqueezeNet ensures faster inference without compromising interpretability, hence making it useful in real-time agricultural decision support systems (Figure 9).
This work established that deep learning models, with especial focus to the SqueezeNet, could be used to predict nutrient deficiencies of potted Rice plants by analyzing pictures of the plants. For this reason, SqueezeNet was selected due to its ability to save computation and memory space through design features such as small size 1×1 convolution and other non-redundant parts, ideal for agricultural scenarios with limited resources. The application of Explainable AI methods allowed obtaining insights into specific features: it was revealed that for nutrient deficiency detection, information about the morphology of the leaves, their color distribution, and texture are valuable. This explainability not only increases the transparency of the model but also gives farmers and agronomists a tool for making proper decisions on crop health and productivity based on data, strengthening the use of technology for sustainable agriculture purposes.
However, several limitations and drawbacks need further consideration for the proposed model in realistic applications. Firstly, high-quality images with a good annotation of various plant species represents a valuable resource that might be difficult to gather due to the variability in image quality, light intensity, as well as variability in plant morphology across different geographic regions. Another issue is the cost of annotations which is highly impracticable for labeling big training sets. Future work can try to develop other learning paradigms such as semi-supervised learning and unsupervised learning in order to reduce dependence on labeled data and enhance generalization capability. Furthermore, it requires domain adaptations to acquire methods that can be adapted for the various geographical and climatic agro-ecological zones that exist in the country.
The other significant factor that needs to be examined is the applicability of this method in real field operations. To achieve all of the objectives mentioned, the proposed approach should complement the current and future agricultural management platforms and sensor systems to aggregate, process, and analyze data. If the diagnostic results are fed to smart farming platforms and real-time data acquisition through IoT-based sensor networks, the former can issue recommendations to the latter. Also enhancing technical translations of the diagnostic outputs into accurate, localized fertilization advice will improve the applicability and feasibility of the system and hence directly lead to better crop yields and sustainability.
Altogether, one can state that the presented work proves the applicability of SqueezeNet and Explainable AI for the automated identification of nutrient deficiencies; however, addressing issues connected to data quantity and quality as well as the adaptation of the model for practical use is important. Subsequent research should seek to develop more effective, sustainable systems that not only improve model performance, and reduce under estimation, but also closes the gap between theoretical AI applications and their practical implementation in the agricultural industry. Any such attempts will help achieve a higher outcome in tackling food insecurity in the global arena and improving sustainable farming practices including productivity in the light of growing necessities for food.
[1] Khush, G.S. (2005). What it will take to feed 5.0 billion rice consumers in 2030. Plant Molecular Biology, 59: 1-6. https://doi.org/10.1007/s11103-005-2159-5
[2] Statista. (2024). Rice-statistics & facts. https://www.statista.com/topics/1443/rice/
[3] Saha, I., Durand-Morat, A., Nalley, L.L., Alam, M.J., Nayga, R. (2021). Rice quality and its impacts on food security and sustainability in Bangladesh. PLoS One, 16(12): e0261118. https://doi.org/10.1371/journal.pone.0261118
[4] Sanyal, P., Bhattacharya, U., Parui, S.K., Bandyopadhyay, S.K., Patel, S. (2007). Color texture analysis of rice leaves diagnosing deficiency in the balance of mineral levels towards improvement of crop productivity. In 10th International Conference on Information Technology (ICIT 2007), Rourkela, India, pp. 85-90. https://doi.org/10.1109/ICIT.2007.40
[5] Wulandhari, L.A., Gunawan, A.A.S., Qurania, A., Harsani, P., Tarawan, T.F., Hermawan, R.F. (2019). Plant nutrient deficiency detection using deep convolutional neural network. ICIC Express Lett, 13(10): 971-977. https://doi.org/10.24507/icicel.13.10.971
[6] Talukder, M.S.H., Sarkar, A.K. (2023). Nutrients deficiency diagnosis of rice crop by weighted average ensemble learning. Smart Agricultural Technology, 4: 100155. https://doi.org/10.1016/j.atech.2022.100155
[7] Shrestha, J., Kandel, M., Subedi, S., Shah, K.K. (2020). Role of nutrients in rice (Oryza sativa L.): A review. Agrica, 9(1): 53-62. https://doi.org/10.5958/2394-448X.2020.00008.5
[8] Jeyalakshmi, S., Radha, R. (2017). A review on diagnosis of nutrient deficiency symptoms in plant leaf image using digital image processing. ICTACT Journal on Image & Video Processing, 7(4): 1515-1524. https://doi.org/10.21917/ijivp.2017.0216
[9] Mee, C.Y., Bala, S.K., Mohd, A.H. (2016). Detecting and monitoring plant nutrient stress using remote sensing approaches: A review. Asian Journal of Plant Sciences, 16(1): 1-8. https://doi.org/10.3923/ajps.2017.1.8
[10] Krishnamoorthy, N., Prasad, L.N., Kumar, C.P., Subedi, B., Abraha, H.B., Sathishkumar, V.E. (2021). Rice leaf diseases prediction using deep neural networks with transfer learning. Environmental Research, 198: 111275. https://doi.org/10.1016/j.envres.2021.111275
[11] Weiss, K., Khoshgoftaar, T.M., Wang, D. (2016). A survey of transfer learning. Journal of Big Data, 3: 9. https://doi.org/10.1186/s40537-016-0043-6
[12] Plompen, A.J., Cabellos, O., De Saint Jean, C., Fleming, M., et al. (2020). The joint evaluated fission and fusion nuclear data library, JEFF-3.3. The European Physical Journal A, 56: 181. https://doi.org/10.1140/epja/s10050-020-00141-9
[13] Ayana, G., Dese, K., Choe, S.W. (2021). Transfer learning in breast cancer diagnoses via ultrasound imaging. Cancers, 13(4): 738. https://doi.org/10.3390/cancers13040738
[14] Sharma, M., Nath, K., Sharma, R.K., Kumar, C.J., Chaudhary, A. (2022). Ensemble averaging of transfer learning models for identification of nutritional deficiency in rice plant. Electronics, 11(1): 148. https://doi.org/10.3390/electronics11010148
[15] Asraf, H.M., Nooritawati, M.T., Rizam, M.S. (2012). A comparative study in kernel-based support vector machine of oil palm leaves nutrient disease. Procedia Engineering, 41: 1353-1359. https://doi.org/10.1016/j.proeng.2012.07.321
[16] Sethy, P.K., Kumari, C., Barpanda, N., Negi, B., Behera, S., KumaRath, A. (2017). Identification of mineral deficiency in rice crop based on SVM in approach of K-means & fuzzy C-means clustering. Helix, 7(5): 1970-1983.
[17] Cevallos, C., Ponce, H., Moya-Albor, E., Brieva, J. (2020). Vision-based analysis on leaves of tomato crops for classifying nutrient deficiency using convolutional neural networks. In 2020 International Joint Conference on Neural Networks (IJCNN), Glasgow, UK, pp. 1-7 https://doi.org/10.1109/IJCNN48605.2020.9207615
[18] Han, K.A.M., Watchareeruetai, U. (2019). Classification of nutrient deficiency in black gram using deep convolutional neural networks. In 2019 16th International Joint Conference on Computer Science and Software Engineering (JCSSE), Chonburi, Thailand, pp. 277-282. https://doi.org/10.1109/JCSSE.2019.8864224
[19] Sethy, P.K., Barpanda, N.K., Rath, A.K., Behera, S.K. (2020). Nitrogen deficiency prediction of rice crop based on convolutional neural network. Journal of Ambient Intelligence and Humanized Computing, 11: 5703-5711. https://doi.org/10.1007/s12652-020-01938-8
[20] Bahtiar, A.R., Santoso, A.J., Juhariah, J. (2020). Deep learning detected nutrient deficiency in chili plant. In 2020 8th International Conference on Information and Communication Technology (ICoICT), Yogyakarta, Indonesia, pp. 1-4. https://doi.org/10.1109/ICoICT49345.2020.9166224
[21] Xu, Z., Guo, X., Zhu, A., He, X., Zhao, X., Han, Y., Subedi, R. (2020). Using deep convolutional neural networks for image-based diagnosis of nutrient deficiencies in rice. Computational Intelligence and Neuroscience, 2020(1): 7307252. https://doi.org/10.1155/2020/7307252
[22] Taha, M.F., Abdalla, A., ElMasry, G., Gouda, M. (2022). Using deep convolutional neural network for image-based diagnosis of nutrient deficiencies in plants grown in aquaponics. Chemosensors, 10(2): 45. https://doi.org/10.3390/chemosensors10020045
[23] Abdalla, A., Cen, H., Wan, L., Mehmood, K., He, Y. (2020). Nutrient status diagnosis of infield oilseed rape via deep learning-enabled dynamic model. IEEE Transactions on Industrial Informatics, 17(6): 4379-4389. https://doi.org/10.1109/TII.2020.3009736
[24] Yi, J., Krusenbaum, L., Unger, P., Hüging, H., Seidel, S.J., Schaaf, G., Gall, J. (2020). Deep learning for non-invasive diagnosis of nutrient deficiencies in sugar beet using RGB images. Sensors, 20(20): 5893. https://doi.org/10.3390/s20205893
[25] Nutrient-Deficiency-Symptoms-in-Rice. https://www.kaggle.com/guy007/nutrientdeficiencysymptomsinrice/activity.
[26] Arepalli, P.G., Naik, K. J. (2024). A deep learning-enabled IoT framework for early hypoxia detection in aqua water using light weight spatially shared attention-LSTM network. The Journal of Supercomputing, 80(2): 2718-2747. https://doi.org/10.1007/s11227-023-05580-x
[27] Arepalli, P.G., Naik, K.J. (2023). An IoT-based water contamination analysis for aquaculture using lightweight multi-headed GRU model. Environmental Monitoring and Assessment, 195(12): 1516. https://doi.org/10.1007/s10661-023-12126-4
[28] Neyshabur, B., Sedghi, H., Zhang, C. (2020). What is being transferred in transfer learning? In Proceedings of the 34th International Conference on Neural Information Processing Systems, Vancouver, Canada, pp. 512-523.
[29] Liu, L., Chen, J., Fieguth, P., Zhao, G., Chellappa, R., Pietikäinen, M. (2019). From BoW to CNN: Two decades of texture representation for texture classification. International Journal of Computer Vision, 127: 74-109. https://doi.org/10.1007/s11263-018-1125-z
[30] Arepalli, P.G., Naik, K.J., Amgoth, J. (2024). An IoT based water quality classification framework for aqua-ponds through water and environmental variables using CGTFN model. International Journal of Environmental Research, 18(4): 73. https://doi.org/10.1007/s41742-024-00625-2
[31] Arepalli, P.G., Naik, K.J. (2024). Water contamination analysis in IoT enabled aquaculture using deep learning based AODEGRU. Ecological Informatics, 79: 102405. https://doi.org/10.1016/j.ecoinf.2023.102405
[32] Çarkacıoǧlu, A., Yarman-Vural, F. (2003). Sasi: A generic texture descriptor for image retrieval. Pattern Recognition, 36(11): 2615-2633. https://doi.org/10.1016/S0031-3203(03)00171-7
[33] Yan, Y., Ren, W., Cao, X. (2018). Recolored image detection via a deep discriminative model. IEEE Transactions on Information Forensics and Security, 14(1): 5-17. https://doi.org/10.1109/TIFS.2018.2834155
[34] Saber, A., Sakr, M., Abo-Seida, O.M., Keshk, A., Chen, H. (2021). A novel deep-learning model for automatic detection and classification of breast cancer using the transfer-learning technique. IEEE Access, 9: 71194-71209. https://doi.org/10.1109/ACCESS.2021.3079204
[35] Arepalli, P.G., K, J.N., Rout, J.K. (2024). Aquaculture water quality classification with sparse attention transformers: leveraging water and environmental parameters. In Proceedings of the 2024 13th International Conference on Software and Computer Applications, Bali Island, Indonesia, pp. 318-325. https://doi.org/10.1145/3651781.3651829
[36] Deng, J., Dong, W., Socher, R., Li, L.J., Li, K., Fei-Fei, L. (2009). Imagenet: A large-scale hierarchical image database. In 2009 IEEE Conference on Computer Vision and Pattern Recognition, Miami, FL, USA, pp. 248-255. https://doi.org/10.1109/CVPR.2009.5206848
[37] Khan, A., Sohail, A., Zahoora, U., Qureshi, A.S. (2020). A survey of the recent architectures of deep convolutional neural networks. Artificial Intelligence Review, 53: 5455-5516. https://doi.org/10.1007/s10462-020-09825-6
[38] Gopi, A.P., Swathi, V., Harshitha, G.S., Swetha, B., Alekhya, N. (2023). Prediction of paddy yield based on IoT Data using GRU model in lowland coastal regions. In 2023 5th International Conference on Smart Systems and Inventive Technology (ICSSIT), Tirunelveli, India, pp. 1747-1752. https://doi.org/10.1109/ICSSIT55814.2023.10060935