Shruti Patil![]() | Anusuya Devi Vandavagula Satya
| Anusuya Devi Vandavagula Satya![]() | Usha Rani Bajjuri
| Usha Rani Bajjuri![]() | Pramodh Krishna Damarapati
| Pramodh Krishna Damarapati![]() | Manohar Manur
| Manohar Manur![]() | Arunadevi Thirumalraj
| Arunadevi Thirumalraj![]() | Ramesh Vatambeti*
| Ramesh Vatambeti*![]()
© 2024 The authors. This article is published by IIETA and is licensed under the CC BY 4.0 license (http://creativecommons.org/licenses/by/4.0/).
OPEN ACCESS
Potato leaf diseases like Late Blight and Early Blight significantly challenge potato cultivation, impacting crop yield and quality worldwide. Potatoes are a staple for over a billion people and crucial for food security, especially in developing countries. The economic impact is substantial, with Late Blight alone causing annual damages over $6 billion globally. Effective detection and management are essential to mitigate these effects on agricultural productivity and economic stability. This paper presents a novel approach to potato leaf disease detection using advanced deep learning and optimization techniques. Key components include data normalization to eliminate noise, feature extraction using GoogLeNet, and hyperparameter tuning through the Elk Herd Optimizer (EHO). Additionally, a Spatial Attention Mechanism and Convolutional Neural Network (SAM-CNNet) are employed for robust classification. The method is validated using the Plant Village dataset, yielding an accuracy of 98.58%, with precision of 97.68%, recall of 98.42%, and F1-Score of 98.21%, demonstrating exceptional performance and reliability. This study highlights the proposed approach's efficacy in accurately identifying and classifying potato leaf diseases, offering a promising solution for precision agriculture and crop management.
potato leaf diseases, GoogLeNet, convolutional neural network, Spatial Attention Mechanism, data normalization
The United Nations reports that 157 nations use potatoes in their crop rotations. The total planting area for potatoes is 19.46 million hectares, and the crop yields 370 million tons each year [1]. Potatoes are a staple food for over a billion people globally and play a crucial role in food security, particularly in developing countries. Growing potatoes has never been easier than in China, which now ranks top in both planting area and yield globally [2]. One of the major causes reducing its output level is potato Late Blight, which causes annual damages estimated at over $6 billion globally. Manual feature extraction has its limits; thus, constructing a model for identifying potato Late Blight would be beneficial. This would allow for early disease monitoring and prevention. Improving potato yields, decreasing production costs, and boosting income are all attainable goals with this strategy [3].
Alternaria solani Sorauer causes Early Blight, a prevalent potato pathogen in North America [4]. Its normal progression across the plant canopy, causing leaves to senesce, is similar to that of other plant leaf diseases: it begins by attacking older and less productive foliage [5]. Early stages of this illness manifest as tiny, 1-2 mm black or brown lesions; as the disease progresses and favourable environmental conditions are met, these lesions transform into dark pigmented concentric rings [6]. Current methods for controlling early blight include spraying fungicides indiscriminately, which negatively affects both the environment and production costs. Consequently, economic and environmental sustainability may be enhanced with the use of an intelligent classification system that can distinguish between healthy and sick plants, allowing for the targeted administration of fungicides [7, 8].
There has been extensive research on plant disease identification [9, 10]. A real-time disease detection system that is both accurate and efficient might aid in the development of mitigation measures to guarantee both large-scale food security and small-scale, economically viable crop protection. Proper illness categorization using deep learning (DL) and machine vision can provide the groundwork for applying agrochemicals at precise locations. In response to the shortcomings of machine learning (ML) algorithms, DL methods are gaining traction. Many DL methods are becoming well-known in the field of food security, such as convolutional neural networks (CNNs) [11], and recurrent neural networks (RNNs) [12-14]. DL algorithms can efficiently calculate useful sample feature characteristics even in the absence of domain experts. These approaches mimic the learning and object recognition processes that the human brain employs when presented with examples. When compared to multispectral evaluation, DL approaches provide more trustworthy findings for a variety of agricultural research activities. Grain volume measurement, plant head recognition, fruit quantification, crop condition diagnosis, and classification are some of the many agricultural production tasks that have been thoroughly researched using DL methods [15-18] such as ResidualNet, GoogLeNet, DenseNet, and visual geometry group (VGG). By using the structural and morphological data from the examined pictures, these methods show accurate identification with little computing demands [19, 20].
1.1 Motivation
Detecting potato leaf diseases through deep learning offers a transformative solution to agricultural challenges. Potatoes are a critical crop, contributing to both food security and the economies of many countries. By harnessing advanced algorithms, this research empowers farmers to swiftly identify diseases, enabling timely intervention and preventing significant crop loss. This technology not only enhances yield but also promotes sustainable farming practices by minimizing the indiscriminate use of chemical treatments. Furthermore, it fosters economic stability for farmers by reducing crop losses and production costs, ultimately ensuring food security and improving livelihoods. The potential to save billions of dollars in losses annually highlights the economic significance of implementing such advanced disease detection systems. Through the synergy of technology and agriculture, it paves the way for a resilient and prosperous farming future, where innovation safeguards crops, sustains communities, and cultivates a healthier planet.
1.2 Main contributions
(1) Integration of data normalization enhances preprocessing, reducing noise and improving the quality of input data for analysis. (2) Utilization of GoogLeNet for feature extraction enables robust representation of potato leaf disease characteristics. (3) Elk Herd Optimizer (EHO) optimizes hyperparameters, enhancing the performance and efficiency of the GoogLeNet model. (4) Introduction of Spatial Attention Mechanism and Convolutional Neural Network (SAM-CNNet) improves classification accuracy and reliability significantly.
What follows is the outline for the rest of the paper. In Section 2, you will find a selection of the most pertinent and pertinently linked books. In Section 3, the proposed approach is detailed. Experiment description and results are presented in Section 4. In Section 5, we review the study's findings and provide our opinions.
In their article, Mahum et al. [21] suggested a method that relies on an enhanced deep learning algorithm. This method makes use of visual features of potato leaves to categorize them into five groups: PLB, PEB, PLR, PVw, Late Blight (LB) photos, as well as a Healthy class for potato leaves, made up the preexisting dataset "The Plant Village," which was used to train the model. Furthermore, information for the Potato Verticillium Wilt (PVw) class, Potato Healthy (PH) class, and Potato Leaf Roll (PLR) class was collected by hand. For efficient disease classification of potato leaves, a pre-trained Efficient DenseNet model was used, using DenseNet-201's additional transition layer. In addition, the suggested approach was made more robust by using the reweighted cross-entropy loss function, which was necessary since the training data was very unbalanced. Even though the training sets of potato leaf samples were modest, the regularization power of the dense connections helped keep overfitting to a minimum. After a successful trial, the suggested algorithm was the first of its kind to identify and categorize four illnesses in potato leaves. When tested on the testing set, the algorithm had a 97.2% success rate.
With the goal of improving accuracy, decreasing information loss, and decreasing the number of trainable parameters and computation time required, Al-Adhaileh et al. [22] modified a convolutional neural network (CNN). A variety of deep learning and machine learning techniques were used to assess the effectiveness of the proposed model in potato blight classification. The proposed model accomplished more than its competitors in only 183 seconds of training time, thanks to its 839,203 trainable parameters and 99% overall accuracy.
In order to detect and forecast potato leaf diseases, Ghosh et al. [23] compared and evaluated ResNet50. A huge collection of pictures of potato leaves, including both healthy and sick specimens, was used to train and assess the chosen CNN models. Extensive data augmentation methods were used to boost the dataset's variety and generalizability. Models were evaluated according to computational efficiency, accuracy, precision, recall, and F1-score in order to identify the most suitable model for real-world applications. The results demonstrated that all three convolutional neural network (CNN) models detected and predicted potato leaf illnesses well; however, VGG19 outperformed DenseNet121 and ResNet50. In addition to providing useful information on the efficacy of DL methods for detecting potato leaf diseases, the findings provide a foundation for future research and the integration of these models into precision agricultural systems.
To identify potato leaf diseases, the researchers Lanjewar et al. [24] tweaked three pre-trained transfer learning (TL) models: VGG19, NASNetMobile, and DensNet169. The selection of these models was based on their consistently strong performance across a range of computer vision tasks. By adding more layers to the fundamental architecture of these pre-trained models, we were able to reduce the sum of trainable parameters and increase their performance. On the test set, the adjusted DenseNet attained a 99% accuracy, 98.5% MCC, 98.5% CKC, and 0.990 AUC-ROC score; on the validation set, it earned a 100% accuracy, 99.5% MCC, 99.5% CKC, and 0.997 AUC-ROC score.
By combining advanced "Deep Learning" models such as Convolution Neural Networks (CNNs) and Support Vector Machines (SVMs), Acharjee et al. [25] presented a method for autonomous plant disease identification. These models achieved an accuracy of up to 98% on a dataset that was trained using pictures of "healthy and unhealthy" plant leaves.
Arshaghi et al. [26] investigated five categories of potato diseases—Healthy, Black Scurf, Common Scab, Black Leg, and Pink Rot—using convolution neural network (CNN) techniques. Their database included pictures of five thousand potatoes. The results demonstrated that the suggested deep learning approach had superior accuracy. They were spot-on in a few courses (99% and 100%, respectively).
A convolutional neural network (CNN) was modified by Astani et al. [27] to increase accuracy while decreasing computation time, information loss, and the number of trainable parameters. With an overall accuracy of 99% and 839,203 trainable parameters, the suggested model achieved superior performance in only 183 seconds of training time.
After training the dataset on three distinct deep network architectures, Arafath et al. [28] determined which model was most suited for detecting illnesses in tomato leaves. An additional layer for batch normalization and a layer with dropout were included to forestall mode overfitting. After testing out several dropout levels during training, the suggested Deep CNN was found to have an optimal regularization value. With no preprocessing measures, such as noise reduction, the experimental technique demonstrated a 96% improvement in accuracy on the Plant Village dataset. With the addition of a dropout layer and batch normalization, the training accuracy reached 99%, while the validation and testing accuracy reached 98%.
2.1 Missing experiments
Taken as a whole, these sources demonstrate how far we've come in using deep learning to identify potato and plant diseases. Nevertheless, significant knowledge gaps remain. To begin, while many deep learning models have been investigated, the identification of the best model for varied datasets has been impeded by the absence of established benchmarking and comparison procedures. Secondly, the whole range of possible crop illnesses is often ignored since studies only look at certain diseases or classes. Further study is needed to close the gap between laboratory validation and actual field deployment, since the scalability and applicability of these models in real-world agricultural contexts have not been thoroughly investigated. Better and more widely used solutions for precision farming and crop disease control may result from filling these gaps.
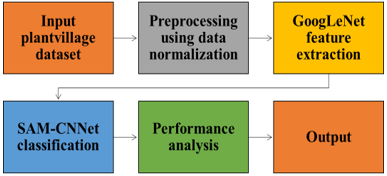
Figure 1 shows the proposed work flow of the potato leaf disease detection.
Figure 1. Block Diagram
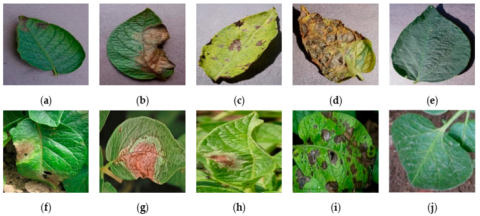
Figure 2. Picture examples of PLDDs
3.1 Dataset description
The dataset used in this study, the Potato Leaf Disease Dataset (PLDD), was developed to address the challenge of differentiating among various stages of potato leaf diseases [29]. The PLDD includes a comprehensive collection of images representing healthy leaves and leaves affected by diseases such as Late Blight and Early Blight. The dataset consists of a total of 7,500 images, carefully curated to ensure high quality and relevance for the task of disease classification.
Distribution of Images:
• Healthy Leaves: 2,500 images
• Late Blight (early stage): 1,500 images
• Late Blight (advanced stage): 1,500 images
• Early Blight (early stage): 1,500 images
• Early Blight (advanced stage): 500 images
This distribution ensures a balanced representation of each disease category, facilitating robust model training and evaluation.
It included pictures of healthy and sick leaves. The Plant Village dataset was used for photos of late blight and early blight, whereas the AI Challenger-2018 dataset (https://challenger.ai/dataset/pdd2018, retrieved on 19 May 2023) was used for healthy leaves. All of these photos were taken using the identical settings, including the same distance from the subject, lighting, and backdrop. This made sure that the diseased leaves would stand out from the rest. More potato disease photographs with natural backdrops were obtained from the Kaggle website (https://ww.kaggle.com/datasets/hassanikram/my-dataset, viewed on 19 May 2023) to increase the dataset's variety and dependability. Photos that were too fuzzy or had too obvious watermarks been hand-picked to guarantee excellent quality. Images with more than one leaf were also trimmed so that the dataset could only include information about individual leaves and diseases. Figure 2 displays an instance of the PLDD leaf pictures: (a) A singular setting exhibiting the initial phases of late blight leaf. (b) Late blight leaf in its last stages in a specific setting. (c) One setting exhibiting early blight leaf stages. (d) The latter stages of early light on a single species of leaf. (e) A green leaf in a specific setting. (f) A leaf affected by late blight in its natural environment at an early stage. (g) Late blight leaf in its natural setting, at its final stages. (h) A natural setting exhibiting the initial stages of early blight on a leaf. (i) Effected leaves of an early blight plant in their native environment. (j) A fit leaf in its native environment.
3.2 Data preprocessing
To ensure the dataset's suitability for deep learning model training, several preprocessing steps were applied:
• Image Normalization: The dataset was normalized to ensure consistent lighting and color conditions across all images. This step involved adjusting the brightness and contrast of the images to a standard range.
• Noise Reduction: A noise reduction algorithm was applied to eliminate any extraneous artifacts that could interfere with the model's ability to accurately classify the images. This step helps in improving the signal-to-noise ratio in the images.
• Image Resizing: All images were resized to a uniform dimension of 256×256 pixels. This resizing ensures that the images are compatible with the input requirements of the deep learning models used in the study.
• Data Augmentation: To increase the diversity of the training data and improve the model's generalization capabilities, several data augmentation techniques were applied. These included:
-Rotation: Random rotations between -15 to 15 degrees.
-Flipping: Horizontal and vertical flipping.
-Scaling: Random scaling within a range of 0.9 to 1.1.
-Translation: Random shifts within a range of -10 to 10 pixels in both horizontal and vertical directions.
• Splitting: The dataset was split into training, validation, and test sets in a ratio of 70:20:10, ensuring that each set contained a representative distribution of images from each category.
These preprocessing steps were crucial in preparing the dataset for effective training and evaluation of the proposed SAM-CNNet model.
3.3 Data normalization
The normalization technique, which ensures zero mean and unit variance, was chosen to stabilize the training process, improve learning efficiency, and enhance model generalization. Normalizing the data helps prevent issues like exploding or vanishing gradients, allows equal contribution of all features, and reduces overfitting risks.
A wide range of eigenvalues will lead to unstable model training for the SAM-CNNet since it is highly sensitive range [30]. Normalizing the dataset helps the CNN understand small differences between images and improves its convergence speed. Eq. (1) is used to normalize the data for each image channel.
$Z_i=\frac{x_i-\bar{x}}{\delta_x}$ (1)
where, $x_i, \delta_x$ and $\bar{x}$ as well as the mean, standard deviation, and sample values for the channel, respectively. All picture pixel standards reduction within the variety of [-1, 1] after the data has been normalized to zero-mean values.
3.4 GoogLeNet feature extraction
Before Christian Szegedy's 2014 proposal of GoogLeNet, all previous deep learning structures improved training consequences by increasing the layers. However, there are many negative effects associated with increasing the number of layers, including overfitting, gradient explosion [31]. When it comes to extracting deep features, GoogLeNet's approach enhances training results by expanding the convolutional network's network width. To fuse feature information at different sizes, the Inception structure is presented. The model parameters are significantly reduced by using a 1×1 layer.
Compared to other deep learning architectures, GoogLeNet has better training outcomes because it uses efficiently and extracts more features with the same amount of processing. One of them is the neural network module's stride (s1), which is 2, and the other is the module's stride (s2), which is 1. There are three main components to the network: pre-processing, feature extraction, and the classifier. There are several steps involved in feature extraction, including pre-processing to convert the test data to the format required by Inception, feature extraction itself is made up of multiple Inceptions, and the extractor itself is made up of a fully connected layer and a dropout. The sigmoid function is used as the activation function of Linear. When it comes to image processing and recognition, GoogLeNet is where it's at. In this paper, the sound recognition model is trained analysis. Then, in order to recognize and alert for a coal mine gas or coal dust explosion, the trained recognition model is fed the coefficient map.
3.4.1 Hyper parameter tuning using EHO
The Elk Herd Optimizer (EHO) algorithm is inspired by the natural behaviors of elk herds, mimicking their strategies for survival and mate selection to solve optimization problems [32]. The process begins by initializing a population of solutions, akin to a herd of elks, with each elk representing a possible solution. The fitness of each elk is evaluated to determine its quality. During the rutting season, the best solutions are selected to mate, analogous to the strongest elks mating in nature. This generates new solutions, or offspring, introducing variation and exploring different areas of the solution space. The best solutions from both parents and offspring are then selected to form the new herd, ensuring only the most promising solutions are retained. This iterative process continues until a stopping criterion is met, such as a maximum number of generations or achieving a satisfactory fitness level. EHO optimizes the hyperparameters of the GoogLeNet feature extraction model, enhancing performance by efficiently searching for the best settings. This leads to improved accuracy, faster convergence, and greater robustness of the SAM-CNNet model in classifying potato leaf diseases.
Mathematical model of EHO: Mathematical models of the Elk Herd optimizer (EHO) within an optimization framework are referred from the study [32]. Table 1 shows the notations used for EHO algorithm.
Table 1. Notations used in EHO Algorithms
|
Notation |
Description |
|
(P) |
population size |
|
f(x) |
fitness |
|
$\begin{aligned} & x_i \in\left[l b_i, u b_i\right]\end{aligned}$ |
$l b_i$ is the $u b_i$ is the upper limit for the attribute $x_i$. |
|
$p_i$ |
probability |
|
Br |
Bull rate |
|
B=|Br×EHS| |
total number of families |
|
f(xi) |
complete fitness value |
|
H |
Total vector |
|
i |
identical index |
|
$\boldsymbol{x}^{h_j}$ |
father bull |
|
$x_i^j$ |
Mother bull |
|
$\boldsymbol{x}^j$ |
Child bull |
|
α |
arbitrary number between 0 and 1 |
|
$x^k(t)$ |
Group of herd |
|
$\gamma$ and $\beta$ |
Ranges between [0.2] |
|
μ |
parental populace |
|
λ |
populace progeny |
|
$\mathrm{EH}_{\text {temp }}$ |
Climbing values of calves |
Step 1: Reset Parameters of EHO besides optimization problematic.
The goal function can be expressed generally in the manner of Eq. (2).
$\min _x f(x) x \in[l b, u b]$ (2)
Phase 2: Make the initial elk herd.
Eq. (3) express the matrix of the EH with its sizes.
$\mathrm{EH}=\left[\begin{array}{cccc}x_1^1 & x_2^1 & \cdots & x_n^1 \\ x_1^2 & x_2^2 & \cdots & x_n^2 \\ \vdots & \vdots & \cdots & \vdots \\ x_1^{E H S} & x_2^{E H S} & \cdots & x_n^{E H S}\end{array}\right] \#$ (3)
Finally, according to their fitness values, the elks in EH are arranged in climbing order, including $f\left(\boldsymbol{x}^1\right) \leq f\left(\boldsymbol{x}^2\right) \leq \cdots \leq f\left(\boldsymbol{x}^{E H S}\right)$.
Step 3: Rutting season.
By considering the fitness morals, the bulls are chosen from EH that is given in Eq. (4).
$\mathcal{B}=\arg \min _{j \in(1,2, \ldots, B)} f\left(\boldsymbol{x}^j\right)$ (4)
Eq. (5) shows the complete fitness function of the proposed optimization.
$p_j=\frac{f\left(\boldsymbol{x}^j\right)}{\sum_{k=1}^B f\left(\boldsymbol{x}^k\right)}$ (5)
Step 4: Calving period.
Eq. (6) is used to reproduce the calf value with its identical index, where Eq. (7) express the characteristics of harem and father bull as referred in [32].
$x_i^j(t+1)=x_i^j(t)+\alpha \cdot\left(x_i^k(t)-x_i^j(t)\right)$ (6)
$\begin{gathered}x_i^j(t+1)=x_i^j(t)+\beta\left(x_i^{h_j}(t)-x_i^j(t)\right) +\gamma\left(x_i^r(t)-x_i^j(t)\right)\end{gathered}$ (7)
Step 5: Selection season.
The solutions for the harems and bulls are stored in the climbing value of calves and production of calves will be carried out to the selected generations as mentioned in the study [32].
Step 6: Criteria for termination.
If the termination requirement is not satisfied, the process will loop back to steps 3, 4, and 5.
3.5 SAM-CNNet classification
3.5.1 Convolutional neural networks
One kind of model that takes cues from the way the human visual brain functions is convolutional neural networks (CNNs). Among other applications, its feed-forward neural network type has achieved remarkable success in picture and digital signal processing. Ideal for image processing and classification tasks, these models were the first to have parameter sharing. The rectified linear unit (ReLU) is an ideal non-linearity for convolutional neural networks; it has a track record of superior performance and is resistant to a wide range of issues. Nevertheless, the CNN design is flawed. CNNs include an internal max-pooling layer. Down sampling an image is how max pooling works. It takes a picture and, using a window of a predetermined size, converts entire frames to their individual values. Importantly, unlike convolution, this reduction does not combine the values to produce an output but rather disregards them. Due to the potential loss of crucial information resulting from pooling, this discarding of information poses a significant problem to CNNs.
3.5.2 Spatial attention mechanism
For neural machine translation systems that rely on encoder-decoders, the attention mechanism initially gained traction as a useful improvement. They achieved state-of-the-art results using what they dubbed "soft alignment" in this work.
The results can be improved using very basic models by using either local attention. A major step forward in deep learning has been the attention mechanisms since then. These developments proved that such easily constructed methods can be utilized to improve the outcome of representations. Attention was based on a straightforward principle. According to it, when doing jobs like machine translation, it's crucial to absolute and relative value of each word in the input and convert them to context vectors accordingly. There are several distinct kinds of attention. Worldwide and regional focus are two main categories. One name for global attention is soft attention. This is the part of a sequence or picture where each patch is considered. Contrarily, hard attention, sometimes called local attention, focuses solely on one area of concern. From this vantage point, it expands on the prior conversation by elucidating the functions of attention in contexts other than sequential models. In only a short amount of time, a wide variety of attentional tools have emerged, each catering to a different kind of user with varying degrees of complexity. In addition, there are spatial transformer networks that combine image sampling and parameterized grid sampling with localization networks. When it comes to image processing, this kind of processing is a major focus. For jobs in this sector, more recent applications use designs with residual connections.
Because it can aid in overcoming the information bottlenecks in deep learning models, attentiveness becomes both important and necessary. When an excessive amount of data is processed or sent via a very small aperture, the network experiences an information bottleneck because it becomes more and harder to store relevant data.
The motivation behind combining the Spatial Attention Mechanism (SAM) with Convolutional Neural Networks (CNNs) is to enhance the model’s ability to focus on the most relevant parts of the input data, improving image classification performance. SAM allows the network to dynamically highlight important regions while downplaying less relevant areas, thereby emphasizing crucial patterns specific to potato leaf diseases. This leads to more discriminative feature representations and improved classification accuracy. SAM also helps reduce the influence of noise and irrelevant background information, resulting in cleaner feature maps. By directing computational resources to the most informative parts of the image, this combination improves training efficiency and processing speed. Additionally, the enhanced focus on relevant features aids in better generalization, reducing overfitting and increasing robustness. Overall, integrating SAM with CNNs is expected to yield higher accuracy, robust disease detection, and efficient performance, making it suitable for real-time applications in precision agriculture.
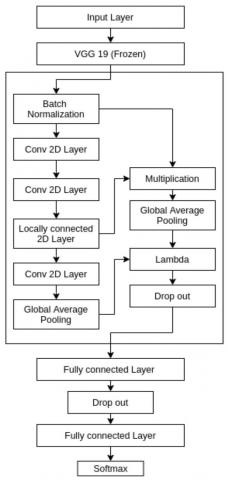
3.5.3 The proposed architecture
More information on the model's architecture has been provided. In this case, it just utilized the VGG19 representation's base and omitted its upper portion. There are approximately 20,025,920 weights in the base model. The decision was made to freeze altogether the layers in the underlying VGG19 model to highlight the superiority of attention over other techniques. With all of its layers frozen, the basic VGG19 model could only do one thing: use convolution layers with pre-trained weights to operate as a feature extractor. We are holding off on using this architecture to fine-tune and improve the model's accuracy because our goal is to demonstrate how the model's attention is improved and how it outperforms other models with a very basic attention mechanism. It has just compared VGG19 findings for the sake of comparison. Comparing the models, we find that VGG19 does better on the PLDD dataset. Hence, VGG19 is included in the suggested framework for disease detection in potato leaves in this article.
The CNN model that has been improved by attention is the following component of the model. To achieve this goal, it has employed a really basic method of focus. The model it introduces demonstrates how a simplified version of the attention process may gather a great deal of information, as previously stated. Dynamic spatial convolution is the method that has been employed to elicit attention in this case. It is a spatial attention method that excels in vision and image processing jobs. Since not every area in a picture is of equal importance, dynamic convolution employs a globally average pooling process, which is intuitive. In terms of utility and suitability, certain areas are far superior to others.
The use of these normalized vectors in conjunction with 2D convolutional layers allows them to produce spatial attention. Finally, a lambda layer is used to merge them. In this case, the GAP is rescaled using the lambda layer. This layer is responsible for producing the attention-enhanced feature maps, which are then passed via a 256-unit dense layer that is linked to a rate. After that, it goes through a regularization layer with a 25% and with 25 components. In this layer, SoftMax is utilized for activation. Lastly, the neural network design is shown in Figure 3.
Figure 3. Model architecture and attention generation mechanism proposed
4.1 Experimental setup
A 12-gigabyte (11.439 gigabytes useable) GDDR5 VRAM NVIDIA Tesla K80 GPU was used to train all the models on Google Colab. All models in this research were trained, evaluated, and predicted using TensorFlow 2.0 with a Keras API.
4.2 Performance metrics
Output metrics presented in Eqs. (8)-(11) include recall, precision, accuracy, and the F1-score. Using these variables, the following table compares actual outcomes with predictions:
$Accuracy =\frac{(T P+T N)}{T P+F P+T N+F N} \%$ (8)
$Precision =\frac{T P}{T P+F P}$ (9)
$ Recall =\frac{T P}{T P+F N}$ (10)
$F 1-$ score $=\frac{2 T P}{2 T P+F P+T N}$ (11)
TP: the true positive value, FP: the false positive value, TN: the true negative value, TN: the true negative value.
4.3 Training validation of the proposed model
Table 2 shows the assessment of training validation of the projected SAM-CNNet perfect with other representations.
From Table 2 and Figure 4 the training analysis of the proposed SAM-CNNet model, along with comparative metrics from other models, reveals its impressive performance. The Deep Belief Network (DBN) achieved an accuracy of 85.51%, with precision, recall, F1-Score, and specificity ranging from 86.25% to 87.32%. The Deep Neural Network (DNN) exhibited improvement with an accuracy of 87.73% and specificity between 87.54% and 91.25%. The Artificial Neural Network (ANN) further elevated the performance metrics, achieving an accuracy of 91.55% with precision, recall, F1-Score, and specificity surpassing 91%. The Convolutional Neural Network (CNN) notably increased accuracy to 93.34%, accompanied by precision, recall, F1-Score, and specificity values exceeding 93%. However, the proposed SAM-CNNet model outperformed all preceding models, achieving an impressive accuracy of 95.83% and demonstrating superior precision, recall, F1-Score, and specificity values, indicating its efficacy in the task at hand.
4.4 Testing validation of the projected model
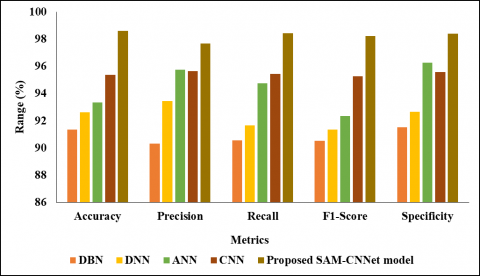
Table 3 shows the comparison of testing validation of the projected SAM-CNNet perfect with other models.
From Table 3 and Figure 5 the testing validation of the proposed SAM-CNNet model, its superior performance is once again evident when compared to other models. The Deep Belief Network (DBN) achieved an accuracy of 91.36%, with precision, recall, F1-Score, and specificity ranging from 90.32% to 91.52%. The Deep Neural Network (DNN) exhibited further improvement with standards between 91.35% and 93.45%. The Artificial Neural Network (ANN) continued the trend of enhancement, achieving an accuracy of 93.33% with precision, recall, F1-Score, and specificity values surpassing 92%. The Convolutional Neural Network (CNN) notably increased accuracy to 95.35%, accompanied by precision, recall, F1-Score, and specificity values exceeding 95%. However, the proposed SAM-CNNet model outperformed all previous models by a significant margin, achieving an exceptional accuracy of 98.58%, along with superior precision, recall, F1-Score, and specificity values, underscoring its efficacy and robustness in the task of testing validation.
Figure 4. Training validation
Figure 5. Testing validation
Figure 6. Feature extraction validation with EHO
4.5 Feature extraction analysis
Table 4 shows the analysis of feature extraction without and with EHO.
Table 4 and Figure 6 presents the analysis of feature extraction both without and with Elk Herd Optimizer (EHO). The models evaluated include AlexNet, ResNet, EfficientNet, MobileNet, and GoogLeNet. Without EHO, AlexNet achieved an accuracy (ACC) of 89.29%, hovering around 89%. ResNet exhibited slightly improved performance with an ACC of 90.29% and PR, REC, and F1 values ranging from 89% to 90%. EfficientNet surpassed both previous models, attaining an ACC of 91.76% and PR, REC, besides F1 values exceeding 91%. MobileNet further elevated the metrics with an ACC of 92.23% and PR, REC, and F1 values surpassing 92%. GoogLeNet demonstrated the highest performance without EHO, achieving an impressive ACC of 94.76% with PR, REC, and F1 values exceeding 94%. With EHO integration, all models experienced performance enhancements. AlexNet saw an ACC increase to 91.57%, with PR, REC, and F1 values surpassing 91%. ResNet similarly improved, reaching an ACC of 92.94% and PR, REC, and F1 values exceeding 92%. EfficientNet demonstrated notable enhancement, achieving an ACC of 94.37% and PR, REC, and F1 values surpassing 93%. MobileNet exhibited substantial improvement, with an ACC of 96.01% and PR, REC, and F1 values exceeding 95%. Finally, GoogLeNet continued to excel with an ACC of 98.22% and PR, REC, and F1 values surpassing 98%. These results underscore the efficacy of EHO in enhancing feature extraction across various convolutional neural network architectures.
The proposed SAM-CNNet approach offers significant practical implications for farmers and agricultural practitioners. By providing an accurate and efficient method for early disease detection, it enables timely interventions, reducing crop losses and improving yield quality. Early identification of diseases such as Late Blight and Early Blight allows for targeted application of treatments, minimizing the use of chemical fungicides and reducing environmental impact. This precision in disease management helps lower production costs and enhances the sustainability of farming practices. The high accuracy and robustness of the SAM-CNNet model ensure reliable detection even in complex and noisy field conditions, aiding in better decision-making and resource allocation. Ultimately, this approach supports improved crop management, enhances food security, and promotes economic stability for farmers by safeguarding their livelihoods against the devastating effects of potato leaf diseases.
Table 2. Training analysis of the projected SAM-CNNet model
|
Models |
Accuracy |
Precision |
Recall |
F1-Score |
Specificity |
|
DBN |
85.51 |
87.32 |
86.62 |
86.42 |
86.25 |
|
DNN |
87.73 |
91.25 |
87.67 |
88.53 |
87.54 |
|
ANN |
91.55 |
91.56 |
91.58 |
91.62 |
92.32 |
|
CNN |
93.34 |
93.54 |
93.26 |
93.45 |
93.13 |
|
Proposed SAM-CNNet model |
95.83 |
95.48 |
95.32 |
95.18 |
95.24 |
Table 3. Testing validation of the projected SAM-CNNet model
|
Models |
Accuracy |
Precision |
Recall |
F1-Score |
Specificity |
|
DBN |
91.36 |
90.32 |
90.57 |
90.53 |
91.52 |
|
DNN |
92.62 |
93.45 |
91.66 |
91.35 |
92.64 |
|
ANN |
93.33 |
95.73 |
94.75 |
92.33 |
96.26 |
|
CNN |
95.35 |
95.64 |
95.44 |
95.25 |
95.58 |
|
Proposed SAM-CNNet model |
98.58 |
97.68 |
98.42 |
98.21 |
98.39 |
Table 4. Feature extraction validation
|
Without EHO |
With EHO |
|||||||
|
Model |
ACC |
PR |
REC |
F1 |
ACC |
PR |
REC |
F1 |
|
AlexNet |
89.29 |
89.21 |
87.13 |
89.14 |
91.57 |
92.12 |
91.22 |
91.19 |
|
ResNet |
90.29 |
89.23 |
89.42 |
90.34 |
92.94 |
93.43 |
93.52 |
93.49 |
|
EfficientNet |
91.76 |
91.78 |
90.23 |
91.35 |
94.37 |
93.98 |
95.37 |
94.22 |
|
MobileNet |
92.23 |
92.32 |
92.21 |
93.32 |
96.01 |
95.46 |
96.28 |
95.56 |
|
GoogLeNet |
94.76 |
94.87 |
94.21 |
94.23 |
98.22 |
98.13 |
98.19 |
98.15 |
This study introduces an advanced approach for potato leaf disease detection using the SAM-CNNet model, which integrates data normalization, GoogLeNet for feature extraction, and the Elk Herd Optimizer (EHO) for hyperparameter tuning. The inclusion of a Spatial Attention Mechanism significantly enhances the model's ability to focus on disease-specific patterns, leading to an impressive classification accuracy of 98.58%. This research offers a robust and efficient solution for early disease detection, which is crucial for timely intervention and effective crop management. The proposed method excels in precision, recall, and F1-score, ensuring reliable performance in real-world agricultural settings. By enabling accurate and early identification of diseases like Late Blight and Early Blight, the SAM-CNNet model helps in reducing the excessive use of chemical treatments, promoting sustainable farming practices, and lowering production costs. This contributes to improved crop yields and economic stability for farmers, enhancing food security.
Future research could focus on real-time implementation of the SAM-CNNet model in the field, utilizing drone or satellite imagery for large-scale monitoring. Expanding the model to detect multiple types of crop diseases and integrating it with IoT devices for automated intervention systems could further enhance its utility. Additionally, investigating the model’s performance under diverse environmental conditions and with different potato varieties will help refine its accuracy and generalizability.
[1] Lu, Z., Zhou, Y., Li, Y., Li, C., Lu, M., Sun, X., Luo, Z., Zhao, J., Fan, M. (2023). Effects of partial substitution of chemical fertilizer with organic manure on the activity of enzyme and soil bacterial communities in the mountain red soil. Frontiers in Microbiology, 14: 1234904. https://doi.org/10.3389/fmicb.2023.1234904
[2] Liu, P.X., Chai, S.X., Chang, L., Zhang, F.W., Sun, W., Zhang, H., Liu, X.L., Li, H. (2023). Effects of straw strip covering on yield and water use efficiency of potato cultivars with different maturities in rain-fed area of northwest China. Agriculture, 13(2): 402. https://doi.org/10.3390/agriculture13020402
[3] Zheng, Z.Z., Hu, Y.H., Guo, T.F., Qiao, Y.C., He, Y., Zhang, Y., Huang, Y.X. (2023). AGHRNet: An attention ghost-HRNet for confirmation of catch-and-shake locations in jujube fruits vibration harvesting. Computers and Electronics in Agriculture, 210: 107921. https://doi.org/10.1016/j.compag.2023.107921
[4] Zhao, M.Y., Jha, A., Liu, Q., Millis, B.A., Mahadevan-Jansen, A., Lu, L., Landman, B.A., Tyska, M.J., Huo, Y.K. (2021). Faster Mean-shift: GPU-accelerated Embedding-clustering for Cell Segmentation and Tracking. Medicine Image Analysis, 71: 102048. https://doi.org/10.1016%2Fj.media.2021.102048
[5] Zhao, M., Liu, Q., Jha, A., Deng, R., Yao, T.Y., Mahadevan-Jansen, A., Tyska, M.J., Millis, B.A., Huo, Y. (2021). VoxelEmbed: 3D instance segmentation and tracking with voxel embedding based deep learning. In Machine Learning in Medical Imaging: 12th International Workshop, MLMI 2021, Held in Conjunction with MICCAI 2021, Strasbourg, France, pp. 437-446. https://link.springer.com/chapter/10.1007/978-3-030-87589-345.
[6] Thirumalraj, A., Chandrashekar, R., Gunapriya, B., kavin Balasubramanian, P. (2024). Detection of pepper plant leaf disease detection using tom and jerry algorithm with MSTNet. In Machine Learning Techniques and Industry Applications, pp. 143-168. https://doi.org/10.4018/979-8-3693-5271-7.ch008
[7] Zheng, Z.Z., Hu, Y.H., Yang, H.B., Qiao, Y.C., He, Y., Zhang, Y., Huang, Y.X. (2022). AFFU-Net: Attention feature fusion U-Net with hybrid loss for winter jujube crack detection. Computers and Electronics in Agriculture, 198: 107049. https://doi.org/10.1016/j.compag.2022.107049
[8] Gulzar, Y. (2023). Fruit image classification model based on MobileNetV2 with deep transfer learning technique. Sustainability, 15(3): 1906. https://doi.org/10.3390/su15031906
[9] Mamat, N., Othman, M.F., Abdulghafor, R., Alwan, A.A., Gulzar, Y. (2023). Enhancing image annotation technique of fruit classification using a deep learning approach. Sustainability, 15(2): 901. https://doi.org/10.3390/su15020901
[10] Gulzar, Y., Hamid, Y., Soomro, A.B., Alwan, A.A., Journaux, L. (2020). A convolution neural network-based seed classification system. Symmetry, 12(12): 2018. https://doi.org/10.3390/sym12122018
[11] Aggarwal, S., Gupta, S., Gupta, D., Gulzar, Y., Juneja, S., Alwan, A.A., Nauman, A. (2023). An artificial intelligence-based stacked ensemble approach for prediction of protein subcellular localization in confocal microscopy images. Sustainability, 15(2): 1695. https://doi.org/10.3390/su15021695
[12] Revathi, V., Kavin, B.P., Thirumalraj, A., Gangadevi, E., Balusamy, B., Gite, S. (2024). Image based feature separation using RBM tech with ADBN tech for accurate fruit classification. In 2024 IEEE International Conference on Computing, Power and Communication Technologies (IC2PCT), Greater Noida, India, 5: 1423-1429. https://doi.org/10.1109/IC2PCT60090.2024.10486564
[13] Nazki, H., Yoon, S., Fuentes, A., Park, D.S. (2020). Unsupervised image translation using adversarial networks for improved plant disease recognition. Computers and Electronics in Agriculture, 168: 105117. https://doi.org/10.1016/j.compag.2019.105117
[14] Too, E.C., Yujian, L., Njuki, S., Yingchun, L. (2019). A comparative study of fine-tuning deep learning models for plant disease identification. Computers and Electronics in Agriculture, 161: 272-279. https://doi.org/10.1016/j.compag.2018.03.032
[15] Zhong, Y., Zhao, M. (2020). Research on deep learning in apple leaf disease recognition. Computers and electronics in agriculture, 168: 105146. https://doi.org/10.1016/j.compag.2019.105146
[16] Abuley, I.K., Hansen, J.G. (2021). An epidemiological analysis of the dilemma of plant age and late blight (Phytophthora infestans) susceptibility in potatoes. European Journal of Plant Pathology, 161(3): 645-663. https://link.springer.com/article/10.1007/s10658-021-02350-4.
[17] Degefu, Y. (2021). Co-occurrence of latent Dickeya and Pectobacterium species in potato seed tuber samples from northern Finland: Co-colonization of latent Dickeya and Pectobacterium species in potato seed lots. Agricultural and Food Science, 30(1): 1-7. https://doi.org/10.23986/afsci.101446
[18] Meno, L., Escuredo, O., Rodríguez-Flores, M.S., Seijo, M.C. (2021). Looking for a sustainable potato crop. Field assessment of early blight management. Agricultural and Forest Meteorology, 308: 108617. https://doi.org/10.1016/j.agrformet.2021.108617
[19] Kolychikhina, M.S., Beloshapkina, O.O., Phiri, C. (202). Change in potato productivity under the impact of viral diseases. In IOP Conference Series: Earth and Environmental Scienc, IOP Publishing, 663(1): 012035. https://doi.org/10.1088/1755-1315/663/1/012035
[20] Garhwal, A.S., Pullanagari, R.R., Li, M., Reis, M.M., Archer, R. (2020). Hyperspectral imaging for identification of Zebra Chip disease in potatoes. Biosystems Engineering, 197: 306-317. https://doi.org/10.1016/j.biosystemseng.2020.07.005
[21] Mahum, R., Munir, H., Mughal, Z.U.N., Awais, M., Sher Khan, F., Saqlain, M., Mahamad, S., Tlili, I. (2023). A novel framework for potato leaf disease detection using an efficient deep learning model. Human and Ecological Risk Assessment: An International Journal, 29(2): 303-326. https://doi.org/10.1080/10807039.2022.2064814
[22] Al-Adhaileh, M.H., Verma, A., Aldhyani, T.H.H., Koundal, D. (2023). Potato blight detection using fine-tuned CNN architecture. Mathematics, 11(6): 1516. https://doi.org/10.3390/math11061516
[23] Ghosh, H., Rahat, I.S., Shaik, K., Khasim, S., Yesubabu, M. (2023). Potato leaf disease recognition and prediction using convolutional neural networks. EAI Endorsed Transactions on Scalable Information Systems, 10(6). https://doi.org/10.4108/eetsis.3937
[24] Lanjewar, M.G., Morajkar, P., P, P. (2024). Modified transfer learning frameworks to identify potato leaf diseases. Multimedia Tools and Applications, 83(17): 50401-50423. https://link.springer.com/article/10.1007/s11042-023-17610-0.
[25] Acharjee, T., Das, S., Majumder, S. (2023). Potato leaf diseases detection using deep learning. International Journal of Digital Technologies, 2(1). https://journal.nielit.edu.in/index.php/01/article/view/43.
[26] Arshaghi, A., Ashourian, M., Ghabeli, L. (2023). Potato diseases detection and classification using deep learning methods. Multimedia Tools and Applications, 82(4): 5725-5742. https://link.springer.com/article/10.1007/s11042-022-13390-1.
[27] Astani, M., Hasheminejad, M., Vaghefi, M. (2022) A diverse ensemble classifier for tomato disease recognition. Computers and Electronics in Agriculture, 198: 107054. https://doi.org/10.1016/j.compag.2022.107054
[28] Arafath, M., Nithya, A.A., Gijwani, S. (2023). Tomato Leaf disease detection using deep convolution neural network. Advances in Science and Technology, 124: 236-245. https://www.scientific.net/AST.124.236.
[29] Feng, J., Hou, B., Yu, C., Yang, H., Wang, C., Shi, X., Hu, Y. (2023). Research and validation of potato late blight detection method based on deep learning. Agronomy, 13(6): 1659. https://doi.org/10.3390/agronomy13061659
[30] Chao, X., Sun, G., Zhao, H., Li, M., He, D. (2020). Identification of apple tree leaf diseases based on deep learning models. Symmetry, 12(7): 1065. https://doi.org/10.3390/sym12071065
[31] Yu, X., Li, X. (2023). Sound recognition method of coal mine gas and coal dust explosion based on googlenet. Entropy, 25(3): 412. https://doi.org/10.3390/e25030412
[32] Al-Betar, M.A., Awadallah, M.A., Braik, M.S., Makhadmeh, S., Doush, I.A. (2024). Elk herd optimizer: a novel nature-inspired metaheuristic algorithm. Artificial Intelligence Review, 57(3): 48. https://link.springer.com/article/10.1007/s10462-023-10680-4