Mukesh Kumar![]() | Vivek Bhardwaj
| Vivek Bhardwaj![]() | Deepti Thakral
| Deepti Thakral![]() | Abdulnaser Rashid*
| Abdulnaser Rashid*![]() | Mohamed Tahar Ben Othman
| Mohamed Tahar Ben Othman![]()
© 2024 The authors. This article is published by IIETA and is licensed under the CC BY 4.0 license (http://creativecommons.org/licenses/by/4.0/).
OPEN ACCESS
When assessing an institution's performance, the level of academic achievement by its students is a crucial factor. Educational Data Mining (EDM) uses ensemble models of Data Mining (DM) to gain a better understanding of student progress and enhance educational quality. The primary challenge in predicting student performance lies in identifying the model with the highest predictive accuracy. This study suggests a multilevel heterogeneous predictive model that uses a group of learning algorithms that were trained with k-fold cross-validation to make predictions more accurate. This work compares the predictive accuracy of different models and proposes Ensemble Learning (EL) modelling for predicting student performance and assessment. We compare the predictive efficacy of individual learning algorithms such as Naïve Bayes (NB), Random Forest (RF), Decision Tree (J48), Multilayer Perceptron (MLP), Decision Table (DT), JRip, and Logistic Regression (LR) with the proposed ensemble model comprising diverse Machine Learning (ML) algorithms. The study's results demonstrate a predictive accuracy rate of 99.50%, providing strong evidence for the effectiveness of the EL model in scientific inquiry. This research contributes to the field by showcasing the value of ensemble approaches in accurately predicting student academic performance and offering insights for educational practitioners and policymakers seeking to enhance educational outcomes.
educational data mining, machine learning, ensemble learning model, task analysis, meta-ensembles, feature selection algorithms
In recent years, there has been a growing interest in making use of techniques derived from ML to make predictions and conduct analyses regarding the academic performance of students. It is essential for educational institutions to have the capacity to accurately predict the outcomes in the form of assessment to measure the performance of their students since these paves the way for early intervention and individualized support for students who are having difficulty, as well as the identification of high-performing individuals who could potentially benefit from enrichment programme [1]. Language learning models of ML algorithms have evolved as strong tools for discovering patterns and making accurate predictions because of the availability of comprehensive educational data. This data includes student demographics, past academic records, and socio-economic characteristics.
The concept of EL which refers to the process of enhancing performance by merging numerous prediction models, is becoming increasingly popular in a variety of disciplines, one of which is education. By drawing on the combined expertise of several different models, the predictive accuracy and robustness of EL can typically be said to be superior to those of individual models [2]. Among the several EL strategies, stacking has demonstrated a significant amount of promise for managing difficult prediction tasks. The technique of training a meta-model to combine predictions from numerous base models while capturing their capabilities to complement one another is referred to as stacking [3]. ML prediction has already explained some of the models that make up models, commonly known as "meta-ensembles." The primary idea is to exploit the advantages of many models to make estimates about various aspects of the data. This can be done to improve prediction accuracy via majority voting, weighted voting, or stacking generalizations, depending on the classification task.
Voting Ensemble (VE) Model: It is feasible that this ML strategy can function without the need for aggregated classifiers and models. Voting procedures often do not need training on extremely large datasets of representative recognitions from classifiers, nor do they necessitate prior knowledge of the behavior of a certain model [4]. Current research provides a weighted voting method for the multiclass problem that combines the best voting aspects of previous language learning models as shown in Figure 1.
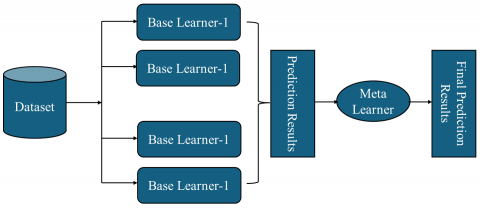
Stacking Ensemble (SE) Model: When it comes to making predictions based on ML, SE makes use of two-tiered models or classifiers, which comprise both base learners and meta-classifiers [5]. SE routinely makes use of meta-classifiers to aggregate the data from the fundamental learners to analyze the patterns or links between the outputs that are created as shown in Figure 2.
Figure 1. Meta-ensemble model architecture for VE model
Figure 2. Meta-ensemble model architecture for SE model
This research proposes an improved EL approach for predicting students' academic performance using stacking algorithms. The objective is to develop a language model that can effectively integrate various base learning algorithm models and exploit their diverse perspectives to achieve superior predictive accuracy. The proposed approach aims to overcome the limitations of individual models by leveraging the power of EL, ultimately providing educators and policymakers with valuable insights for effective decision-making and student support. To enhance the prediction of students' academic performance and proactively address potential issues, it is crucial to explore computational intelligence techniques [6, 7]. Additionally, leveraging ML algorithms can greatly benefit educational resources, governance, and student services. This comprehensive approach directly supports institutional management, education systems, teachers, educational service providers, and students alike. This study aims to develop a model for predicting students' academic performance by employing EL model architecture. The primary focus is on improving the accuracy and other performance metrics of the prediction model due to the critical nature of the application. The main objectives of this research paper are as follows:
• Investigating the efficacy of stacking algorithms for academic performance prediction for assessment.
• Exploring the selection and integration of diverse base models to create a robust ensemble model based on ML algorithms.
• Evaluating the performance of the proposed approach using a comprehensive dataset of student attributes and academic records.
•Comparative analysis of the proposed model's performance with similar research studies.
By incorporating these contributions, anticipated significant advancements in accurately predicting students' academic performance, thereby enabling proactive measures to be taken for their benefit are made.
There are a total of seven parts to this study, in Section 2, a review of relevant research into predicting student performance with predictive analytics models and EL algorithms of classifiers being done. The proposed model structure and its multilevel explanatory structure are discussed in Section 3. The proposed model is implemented in Section 4, which addresses the seven different classification techniques. In Section 5, an examination of performance of seven classifiers are carried out, and in Section 6, a conclusion is drawn based on findings.
A good education may help you overcome numerous challenges in your life. A good education is the best way to increase one's chances of getting a job down the road. DM using EDM is popular because of how well it can glean insights from freshly collected data. Researchers have found and presented a plethora of models to explain predictive modelling of student performance, retention, and success after examining data over several decades. Numerous studies have been conducted to determine what factors affect a student's decision to continue their education beyond high school, and these studies have led to the development of numerous theoretical models based on the American educational system. Based on data input into the Learning Management System (LMS), Saa et al. [8] calculate the students' final grades for assessment purpose. Metrics include time spent online, frequency of logins, posts read, created, and followed up on, content page views, and posts read. To measure the effectiveness of online education, several studies have looked at factors such as the frequency, duration, and regularity of user logins. Once these confounding variables were accounted for, the study's reliability increased. Common indicators of success in a LMS include students' engagement with content, how much time they spend online, how easily they can get their hands on course materials, and how often they log in Yadav et al. used data from a questionnaire they created to predict students' performance at a university in Malaysia. Topical enthusiasm, study habits, beliefs, and parental encouragement are all factors that may be evaluated from the data. According to the results, there is a robust connection between students' emotional well-being and their academic performance [9]. Ruiz et al. [10] used questionnaire surveys to collect information on students' intrinsic and personality traits that is not readily available in any database used for predicting students' academic outcomes. These investigators aimed to determine what factors including students' individual features, learning styles, personalities, pedagogical strategies, and intrinsic motivation affected their academic performance and well-being. Raga and Raga [11] investigated the relationship between academic success and emotional well-being using a short questionnaire that measured five distinct personality traits: the student's learning style, emotional well-being, and academic accomplishment. Kuzilek et al. [12] described how they divided their students into "VLE intensity clusters" and compared the results of their courses among the different groups. Their study was made possible by using data from the Open University Learning Analytics Project.
Using a survey-based retention approach, publicly available data sources, and internal databases at their respective institutions, Sokkhey and Okazaki [13] compared the efficacy of three prediction models. The survey-based model fared better than the institutional internal datasets when applying LR. Using both the questionnaire and institutional databases resulted in higher performance accuracy than either method alone, as observed in the study by Arifin et al. [14]. Finally, studies on student performance have shown that variables beyond the control of Higher Education Institutions (HEIs) are more likely to be to blame for low grades and student dropout rates than those causes that are often documented publicly. Moreno-Marcos et al. [15] emphasize that student participation in surveys is essential, as most criteria rely on individual student data. The factors that affect and determine students' final grades are not independent variables; rather, they are tied to one another and have mutually reinforcing impacts and relationships. Asif et al. [16] used DM methods, zeroed in on two parts of the students' work to improve it. First, we will attempt to predict how well students will do in their last year of a four-year degree Programme. The second is to combine the data from the predictions with information about the children's development over time. They divided the students into two categories: one for those with low achievement and another for those with high achievement. According to their findings, educators should zero in on a select group of classes that consistently produce strong or weak performance data to provide early warnings, assist students who are not performing up to their potential, and provide guidance and opportunities to those who are performing exceptionally well. Using sixteen demographic characteristics, Cruz-Jesuset et al. [17] predicted students' performance in school. Age, gender, class participation, internet use, computer ownership, and course load were all considered. RF, LR, k-NN, and SVM all leaning models able to predict students' performance with an accuracy of 50-80% using ML approaches.
Using students' demographic information and their term-end accomplishment grades as inputs, Fernandes et al. [18] constructed a model. Classification models were constructed using the Gradient Boosting Machine (GBM) and used to analyze the students' academic performance in that study. The results indicated that the previous year's accomplishment scores and a lack of attendance were the most significant factors in predicting academic success. Researchers noted that characteristics including study location, participants' educational backgrounds, and study participants' ages may have functioned as predictors of success or failure. He also suggested that the model be used to inform the creation of new anti-failure measures, which he thought may have significant positive effects. Kumar et al. [19] used information gathered from students during registration and the surrounding environmental to determine which students were at risk of failing. They concluded that using DM strategies improved the ability to identify at-risk students. By employing their strategy, we can also assign a risk rating to each child. To evaluate the correlation between various factors and school academic achievement and to isolate the crucial factors. Rebai et al. [20] used regression trees revealed that the most important factors associated with improved performance were school size, competition, class size, parental pressure, and gender ratios. In addition, the results of the RF algorithm showed that school size and the proportion of female pupils both significantly impacted the anticipated accuracy of the model. Ahmad and Shahzadi proposed a ML-based methodology to determine if students were at risk of failing to meet academic expectations. Using the students' knowledge, study habits, and academic interactions, they were able to predict the outcome with an accuracy of 85%. They determined that their proposed methodology may be used to detect underachieving kids. The current state of research calls for a new paradigm that adopts a comprehensive and holistic approach [21]. Balcioğlu and Artar [22] in research focuses on using ML and deep learning models to predict college students' academic performance. Various models were used to predict students' performance in three categories-Pass/Fail, Close to Fail, and Close to Pass-on the Open University Learning Analytics (OULA) dataset. The models comprised DT, SVM, NN, and ensemble model. The ensemble model consistently outperformed other models by achieving superior outcomes in F1 measure, recall, accuracy, and precision. The findings highlight the importance of using data-driven methods for making educational decisions, enabling more accurate interventions and personalized approaches to student learning. Priyambada et al. [23] propose a two-layer EL method that combines EL with ensemble-based progressive prediction. For both present and past results, it analyses data on students' learning behaviour and domain knowledge. Applying our proposed approach to a real student dataset improves its accuracy, as seen in the results. Holicza and Kiss [24] predicts, assesses, and explains the decline in student performance through the application of diverse ML methods such as support vector machines with different kernels, decision trees, random forests, and k-nearest neighbors. We conducted our analysis by comparing two databases, one focusing on offline learning traits and the other on online learning traits. This comparison aims to assess the precision and F1 score of the predicted vulnerabilities.
Based on the analysis of existing literature, it is urgent to improve the standard of education by creating tools to predict students' academic performance and supporting those who have been identified as part of risk groups. The study's goal is to use students' GPAs alone to predict their future academic success without considering any other demographic or socioeconomic factors [25, 26]. ML algorithms are highly adaptable, making them useful in various educational settings. For example, algorithms like RF and SVM are popular because they can handle complex and high-dimensional data effectively. However, their success largely depends on the quality and diversity of the data they are given. If the data is limited or lacks variety, the accuracy of these models can decrease significantly. Additionally, the effectiveness of these algorithms can vary depending on the specific educational goals they are meant to achieve. For instance, a model designed for one country's education system might not work as well in another due to differences in educational practices, student behaviors, and policies. This means that while ML models can adapt, they often require careful adjustment and customization to be truly effective in different contexts. Despite their strengths, ML models in education also face challenges. A significant issue is the "black box" nature of advanced models like deep learning, which makes them difficult to understand and interpret. This lack of transparency can make it hard for educators and policymakers to trust and use the model's predictions effectively.
The goal of this study was to use cutting-edge machine-learning methods to develop a unique model for predicting students' performance on final exams. This goal was reached by finding and using classification algorithms that use ML to make predictions as accurate as possible about how well a student will do in a certain subject.
3.1 Proposed multilevel heterogeneous learning-based ensemble predictive model
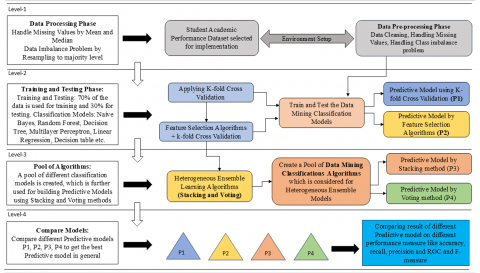
In this research, an application of a proposed ensemble model consisting of a multilevel heterogeneous ensemble prediction, employing ML techniques are employed. It was found that most authors based their findings on the degree of success during the period where we surveyed the relevant literature. But proposed model lays out a procedure that can be followed having heterogeneous ensemble predictive modeling. Every step of planned procedure presents a new challenge, Figure 3 is a block diagram of the proposed implemented language learning model.
Level 1: Handling missing data (using the mean and median), finding outliers, and fixing class imbalances are all needed to move on to the next phase (using the resampling method). Outlier identification is the process of finding odd data points so that they can be left out of further analysis. Finding an anomaly is hard because there are not any tried-and-true ways to do it and because it takes a lot of data. DM can be used in many ways in the growing field of "data stream analysis. When it comes to ML, the larger phenomenon is the performance of the model, which is analyzed by doing calculations on smaller samples.
Level 2: In this stage, several approaches to classifying data are tested and refined (both with the complete dataset and with feature selection). To test the efficacy of ML algorithms on a limited dataset, work employ k-fold cross-validation, a resampling technique. This method only varies by the number of times a data sample is split in half, which is k. To do this, there is need of two different classifiers: termed as P1 and P2 in Figure 3.
Level 3: At this stage, there will be a request to establish a pool of classification algorithms that will be taken into consideration when a suggested model is being developed. These algorithms will be considered by the proposed model. From this level, P3 and P4 models are derived, which we can be used to make predictions.
Level 4: Here the comparison of different prediction models (P1, P2, P3, and P4) is done to get a better score on the different performance indicators.
After having the experimentation over the large language models for the performance analysis of students, a decision is made on which EL algorithms will be used to evaluate the various classification strategies. All the necessary conditions have been met, so the previously stated heterogeneous classification algorithms may be used with the aid of feature selection and feature selection techniques. Finally, there will be a need to assess each algorithm's performance to determine which one is most reliable for predicting the outcome of a given set of inputs.
3.2 Pre-processing dataset
A. Pre-processing Dataset
This data collection relates to the academic performance of students attending secondary school at two different educational institutions in Portugal. Data was gathered through school reports and questionnaires, encompassing student grades along with demographic, social, and school-related factors. This collection also includes information about individuals proficient in Portuguese. The datasets analyzed by Cortez and Silva were utilized for binary classification and five-level classification and regression tasks, respectively. This research relied on a dataset of student grades obtained from the Kaggle online dataset repository [27]. The information was obtained from the educational institutions located in the Alentejo area of Portugal during the academic sessions. It has 649 occurrences and 33 properties, such as student grades, demographic information, social characteristics, and characteristics about the school.
Figure 3. Proposed multilevel heterogeneous learning based ensemble predictive model
B. Classification Algorithms
Based on the characteristics that were input into the algorithm, the purpose of any classification algorithm is to provide an output that can distinguish between positive values associated with one class and negative values associated with another class. The approach assigns weights to the attributes in such a way that it can distinguish between positive and negative values associated with one class. Classifier training is to determine the parameters (weights and functions) that enable the clearest and most reliable separation of two types of data. The classifier's usefulness is maximized as a result. Classification is the act of finding, comprehending, and organizing concepts and things into distinct groups, which are sometimes referred to as "sub-populations". The word "Classification" refers to the process of doing these stages. ML systems can categorize future data according to the most relevant categories using a variety of data analysis approaches. These methods may be optimized and enhanced by using pre-classified datasets. A ML algorithm analyses the supplied training data to assess whether fresh data falls into one of the established categories. These projections are intended to test the hypothesis that the future data will be classified into one of the established buckets.
Naïve Bayes: To classify data, NB applies Bayes' theorem to estimate the likelihood that a given record or data point belongs to a particular category. The category with the highest probability is selected as the final classification. This straightforward predictive modelling method yields reliable results [28]. Some call it naive since it believes each input variable is independent. The end effect is naivety. Even though using this assumption on real data would be absurd, the strategy is useful in a variety of challenging cases. The probability of one event is used to calculate the chance of another. This allows you to compute the likelihood of an event. We may make reasonable assumptions about the attribute values of the other members based on how the data is classified. Related data points are grouped together due to their similarity. If the algorithm correctly identifies the class, Bayesian classification can yield reliable feature value predictions. The NB classifier employs a straightforward probability theory known as Bayes as well as the nave assumption that all attributes are pairwise independent. Bayes was a probability theorist who lived in the 18th century. Bayes's Theorem says that the following relationship holds true when the variable y is a class variable and the feature vectors x1, x2, ..., xn depend on each other:
$\mathrm{P}\left(\mathrm{y} \mid \mathrm{x} 1, \mathrm{x} 2, \ldots \mathrm{x}_{\mathrm{n}}\right)=\frac{\mathbf{P}(\mathbf{y}) \mathbf{P}\left(\mathrm{x}_1, \mathbf{x}_2, \ldots, \mathbf{x}_{\mathrm{n}} \mid \mathbf{y}\right)}{\mathbf{P}\left(\mathbf{x}_1, \mathbf{x}_2, \ldots, \mathbf{x}_n\right)}$ (1)
$\mathrm{P}\left(\mathrm{y} \mid \mathrm{x}_1, \mathrm{x}_2, \ldots \mathrm{x}_{\mathrm{n}}\right)=\frac{P(y) \prod_{i=1}^n P\left(x_i \mid y\right)}{P\left(x_1, x_2, \ldots, \mathrm{x}_n\right)}$ (2)
The following rule of classification can be applied since P (x1, x2, ... xn) is constant as shown in the Eq. (1). and Eq. (2).
Random Forest: Researchers in the field of ML frequently make use of RF for tasks such as regression and classification due to the utility and simplicity of the method. Learning by ensemble is a strategy that employs several different classification approaches to solve an issue. RF training makes use of both bagging and bootstrapping aggregation to compile results. An ensemble of techniques, often known as "bagging," may be employed in place of a single method to increase the accuracy of ML algorithms. After the findings of a DT analysis have been analyzed, a procedure known as RF is applied to the data. The outcomes of the tree are averaged, and the average is calculated. Greater accuracy is achieved because of the inclusion of trees. A RF will collect random samples from the dataset to create a prediction [29]. Learning takes place in a context that involves interaction with other individuals. Collect samples from the edge nodes of the network until you discover one that encompasses the whole structure. Subtract the total number of samples from the total. The Gini index is then utilized to organize the RF nodes into clusters on a DT branch.
$Gini Index =1-\sum_{i=1}^c\left(p_i\right)^2$ (3)
Eq. (3). incorporates both class and probability when determining each branch's Gini value. This helps determine which branch is likely. pi is the relative frequency and c is the total number of classes. Entropy can help us determine how DT nodes branch.
$Entropy =\sum_{i=1}^c-p_i * \log _2\left(p_i\right)$ (4)
Entropy, as mentioned in Eq. (4), is a method for determining the most likely path a node should take in terms of branching.
Decision Tree: The structure is a branched graph, where nodes and branches form a tree-like pattern. Due to this arrangement, the nodes and branches align in a linear order. Starting with the root node at the top, each node is positioned based on the data's entropy. Since it represents the whole dataset, the root node is the most crucial one. Effectiveness, outcomes, and resource costs are used as inputs and outputs, respectively, in decision modeling. In this study, the DT approach is employed to streamline the reading process and guarantee accurate interpretation. One of the most difficult tasks is deciding what value to assign to the first node of each branch in a DT [30]. In a scientific or academic setting, this process is known as attribute selection. To identify the feature that would act as the first leaf node, we utilized information gain attribute selection methods, as outlined in Eq. (5). Each time a DT node is employed to partition the training examples into smaller, more manageable subsets, the entropy of the data is altered. As illustrated in Eq. (6), the entropy change is measured in terms of the information gained. Suppose X is a set of instances, Y is an attribute, Xy is the subset of X with Y=y, and Values (Y) is the set of all possible values of Y, then
$\begin{gathered}\operatorname{Gain}(X, Y)=\operatorname{Entropy}(\mathbf{X})- \sum_{\mathbf{v} \in \operatorname{Vakues}(\mathbf{Y})} \frac{\left|\mathbf{X}_{\mathbf{v}}\right|}{|\mathbf{X}|} \cdot \operatorname{Entropy}\left(\mathbf{X}_{\mathbf{v}}\right)\end{gathered}$ (5)
where, the formula for finding Entropy is
$\operatorname{Entropy}(\mathrm{X})=-\sum_{i=1}^n P\left(x_i\right) \log \left(P\left(x_i\right)\right)$ (6)
Multi-Layer Perceptron: A neural network is a group of interconnected algorithms that use a computational strategy like the human brain to unearth latent links in a dataset. As a result, "neural networks" might mean systems comprised of either synthetic neurons or human-sourced neurons. It shows that the accuracy of a neural network's findings is not affected by changing the criterion for the output of the network. The network can adapt quickly to new data. Specifically, a multi-layer neural network is a MLP with all its layers interconnected [31]. A neural network with several layers is called a multi-layer neural network. Each layer consists of artificial neurons, or nodes.
Logistic Regression: It is one of the ML strategies that is utilized the most and does not fall under the purview of the supervised learning approach. It is feasible to make a prediction about a categorical dependent variable by making use of a predetermined collection of independent factors. LR is used to predict the value of a categorical dependent variable. It is a statistical model that identifies the relationship between variables and produces a binary outcome-either yes or no. The process begins by assessing the difference between the result without any predictors and the baseline outcome, followed by a comparison of the observed outcome to the baseline outcome [27].
Feature Extraction
Feature extraction is a critical step in data preprocessing, where relevant attributes (features) are identified and selected for analysis. One common approach in feature extraction is the use of correlation analysis, which helps in understanding the relationship between different variables. This method can identify which features are most relevant by measuring how strongly they are associated with the target variable or with each other.
Correlation Approach in Feature Extraction: Correlation analysis is a statistical tool used to compare two variables and quantify the degree of their relationship. The strength of this relationship is expressed by the correlation coefficient, a value that ranges from -1 to 1:
By calculating the correlation coefficient, we can determine how much one variable affects another, aiding in the selection of features that are most informative for the model.
Pearson Correlation Coefficient (PCC) in Feature Extraction: The Pearson Correlation Coefficient (PCC) is the most widely used measure of correlation in feature extraction. It quantifies the linear relationship between two variables, making it especially useful when the goal is to identify linear dependencies between features. Pearson's Correlation Coefficient Formula is calculated according to the Eq. (7):
$\mathrm{r}=\frac{n\left(\sum\left[(x y)-\left(\sum x\right)\left(\sum y\right)\right]\right.}{\sqrt{\left[n \sum x^2-\left(\sum x\right)^2\right]\left[n \sum y^2-\left(\sum y\right)^2\right]}}$ (7)
where, r stands for Pearson Coefficient, n means the number of the pairs of the stock, $\sum x y$ is sum of products of the paired stocks, $\sum x$ is sum of the x scores, $y$ is sum of the y scores, $\sum x^2$ means sum of the squared x scores and $\sum y^2$ means sum of the squared y scores [33].
In the context of feature extraction, PCC can be employed to filter out features that are either redundant (highly correlated with each other) or irrelevant (low correlation with the target variable). This process enhances the efficiency and accuracy of ML models by ensuring that only the most informative features are used.
Here, there is an analysis of how the performance of various ensemble methods is affected by the selection of optimal variables from the provided dataset. Before beginning any type of analysis, it is generally accepted that the number of attributes in the dataset should be reduced. In a wide variety of practical classification situations, this preliminary stage is crucial. Limiting the number of variables in the dataset is necessary to keep relevant information from the original data while still satisfying certain optimization criteria.
4.1 Model building with base classifier
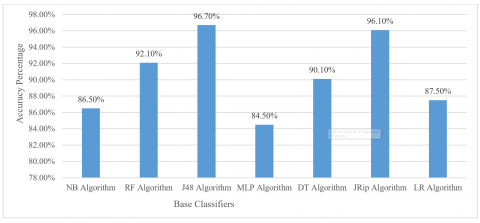
The student performance dataset was classified using a wide range of approaches. Many different classification algorithms were put through k-fold cross-validation tests, and the results are summarized in Table 1. In terms of accuracy, the J48 approach outperforms other popular classification algorithms, including NB, RF, MLP, DT, JRip, and LR, by a wide margin. The table also shows that the MLP method, which is discussed, is only 84.5% accurate. Both methods work quite well; RF achieves an accuracy of 92.1%, while JRip achieves 96.1%. All 33 attributes in the dataset are considered by these methods. Mean Absolute Error (MAE), accuracy, and recall are only a few of the many metrics that are considered by the built-in classifiers. The lack of extreme cases in our dataset means that accuracy may serve as the primary metric for evaluating the classifier's performance. NB is valued for its simplicity and efficiency, especially with large datasets where feature independence is reasonably assumed. It works well with categorical features, making it useful for quickly classifying students based on factors like course enrolment or attendance. However, its assumption of feature independence might not always hold in real-world educational data, where features can be correlated. Table 2. Different ML algorithms parameters values taken into consideration for implementation.
Table 1. Accuracy achieved by base classifiers
|
ML Algorithms |
Accuracy (%age) |
MAE |
Precision |
Recall |
|
NB |
86.5 |
.06 |
.87 |
.87 |
|
RF |
92.1 |
.12 |
.92 |
.92 |
|
J48 |
96.7 |
.02 |
.97 |
.97 |
|
MLP |
84.5 |
.08 |
.85 |
.85 |
|
DT |
90.1 |
.15 |
.91 |
.90 |
|
JRip |
96.1 |
.02 |
.96 |
.96 |
|
LR |
87.5 |
.05 |
.88 |
.87 |
RF excels in handling complex datasets with numerous features and interactions, providing robust performance by averaging the results of multiple DTs. It is less prone to overfitting than individual DTs, making it effective for intricate datasets that include factors like attendance, prior performance, and socio-economic status. However, RF's computational intensity and need for parameter tuning can be a drawback, though it offers valuable feature importance scores that highlight influential factors in student performance. J48, an implementation of the C4.5-DT algorithm, is beneficial for its interpretability. It generates decision rules that are easy to understand and apply, which can be useful for identifying at-risk students based on their behavior and performance patterns. Nevertheless, J48 can overfit to noisy data and may not handle complex interactions as well as ensemble methods.
MLP stands out for its ability to model non-linear relationships between features, which is advantageous when predicting student performance based on complex interactions. MLPs can achieve high accuracy but require careful tuning of hyperparameters and substantial computational resources, making them suitable for datasets where capturing intricate patterns is essential. DT are straightforward and provide clear decision rules, which can be directly communicated to educators for practical use. They work well with both numerical and categorical data but tend to overfit, particularly when the trees are very deep. Decision Trees can be used to generate easy-to-interpret models that guide educational decisions, such as identifying key factors for student success or failure.
The accuracy of a classification algorithm refers to the percentage of correct predictions made by the algorithm out of the total predictions for a given dataset. Figure 4 provides a graphical representation of the classification algorithms using the k-fold cross-validation method. It is evident from the graph that the J48 classification algorithm performs better than the others.
4.2 Model building using feature selection with base classifier
The Correlation Attribute Evaluator (CAE) gives greater weight to qualities with a higher correlation coefficient to better predict the class label. A prioritization is made by removing components that are critical to the operation of a feature. The weighted average is the best approach for estimating the overall correlation of a nominal attribute. A selection to choose the top ten characteristics by combining the CAE attribute evaluator with the Ranker search technique, all of which had significance criteria greater than 1. Many classification techniques were tested using CAE with the k-fold cross-validation option, and the results are summarized in Table 3. LR and CAE surpassed various classification methods, including NB, RF, J48, MLP, DT, and JRip, with a total accuracy of 97.8%. The MLP method's accuracy drops to 94% when the feature selection step is eliminated. Regardless, the remaining algorithms are accurate enough to suit the most basic requirements. These approaches only consider the top 15 attributes in the dataset.
Classification methods using CAE and k-fold cross-validation are shown graphically in Figure 5. It is proven that the LR method outperforms every other algorithm in the graph. It is clear from the graph that the prediction accuracy of most classification methods is well above 90%.
Table 2. Different ML algorithms parameters values taken into consideration for implementation
|
Algorithms |
ML Algorithms Parameter for Selection |
|
NB |
Typical values: [0.1, 0.5, 1.0, 2.0], Use cross-validation to select the best alpha. |
|
RF |
Number of Trees (n_estimators): [100, 200, 300, 500, 1000], Maximum Depth (max_depth): [None, 10, 20, 30, 50, 100], Minimum Samples Split (min_samples_split): [2, 5, 10], Minimum Samples Leaf (min_samples_leaf): [1, 2, 4, 6], Maximum Features (max_features): ["auto", "sqrt", "log2", 0.5, 0.7] |
|
J48 |
Confidence Factor (confidenceFactor): [0.1, 0.2, 0.25, 0.5], MinNumObj (minNumObj): [2, 5, 10, 20], Unpruned (unpruned): Can be set to True or False. |
|
MLP |
Number of Hidden Layers and Units: [(100,), (50, 50), (100, 50, 25)], Activation Function: ["relu", "tanh", "logistic"], Solver: ["adam", "sgd", "lbfgs"], Learning Rate (learning_rate): ["constant", "invscaling", "adaptive"], Batch Size: [32, 64, 128], Maximum Iterations (max_iter): [200, 300, 500] |
|
DT |
Criterion: ["gini", "entropy"], Max Depth: [None, 10, 20, 30, 50], Min Samples Split: [2, 5, 10], Min Samples Leaf: [1, 2, 4] |
|
JRip |
Number of Iterations (numIterations): [1, 5, 10], Percentage Split: [70/30, 80/20], Minimum Support (minSupport): [2, 5, 10] |
|
LR |
Regularization (C): [0.001, 0.01, 0.1, 1, 10, 100], Penalty: ["l1", "l2", "elasticnet"], Solver: ["liblinear", "newton-cg", "lbfgs", "saga"], Maximum Iterations (max_iter): [100, 200, 300] |
Figure 4. Visual depiction of the accuracy achieved by individual base classifiers
Table 3. Accuracy obtained by the standard classifier using a CAE
|
ML Algorithms |
Accuracy (%age) |
MAE |
Precision |
Recall |
|
Feature Selection: Correlation Attribute Evaluator |
||||
|
NB |
87.5 |
.06 |
.88 |
.87 |
|
RF |
95.8 |
.06 |
.96 |
.96 |
|
J48 |
96.9 |
.02 |
.97 |
.97 |
|
MLP |
97.6 |
.02 |
.98 |
.98 |
|
DT |
90.1 |
.15 |
.91 |
.90 |
|
JRip |
95.5 |
.03 |
.96 |
.95 |
|
LR |
97.8 |
.01 |
.98 |
.98 |
Figure 5. Visual depiction of the accuracy achieved by base classifiers using CAE
4.3 Model building using feature selection with SE
By applying a feature selection approach like CAE, the dataset's dimensionality can be reduced, which may enhance the accuracy of the model built using stacked ensembles with k-fold cross-validation. The cross-validation results for various classification methods using the CAE-SE are summarized in Table 4. With the help of two different function-based classification algorithms (LR and SL), we were able to achieve 99.5% accuracy. The newly created LR and SL prediction models have very high accuracy when compared to state-of-the-art function-based classification algorithms like MLP-SL and tree-based algorithms like J48 and REPTree (RT). Combining the strengths of several classification approaches can improve prediction accuracy to 93.3%. Table 3 provides a summary of the relative classification performance of the various classifiers.
Table 4. Accuracy using feature selection with Stacking Ensemble
|
ML Algorithms |
Accuracy (%age) |
MAE |
Precision |
Recall |
|
Feature Selection: Correlation Attribute Evaluator |
||||
|
Meta Model: Logistic Regression |
||||
|
NB |
94.7 |
.03 |
.95 |
.95 |
|
RF |
95.2 |
.02 |
.95 |
.95 |
|
J48 |
96.6 |
.03 |
.97 |
.97 |
|
MLP |
98.3 |
.01 |
.98 |
.98 |
|
DT |
95.6 |
.02 |
.96 |
.96 |
|
JRip |
93.3 |
.03 |
.93 |
.93 |
|
LR |
99.5 |
.01 |
.99 |
.99 |
Stacking-CAE and k-fold cross-validation were employed in the implementation of the classification algorithm. The graph shows that the LR-SL classification technique achieved the highest prediction accuracy compared to NB-BN, RF-RT, J48-RT, MLP-SL, and JRip-PART. In this implementation, using Stacking-CAE with k-fold cross-validation, all possible sub-model combinations performed effectively, achieving an accuracy of 93% or higher.
4.4 Model building using feature selection with voting ensemble
Table 5 summarizes the outcomes acquired from the development of multiple classification algorithms using CAE, voting ensemble, and k-fold cross-validation. In a joint effort, we were able to achieve 99.53% accuracy by combining several classification algorithms, including the function-based MLP-SL approach. The VE approach may be used to blend new MLP and LR models, which has the potential to increase accuracy to as high as 98.61%. When employing the VE technique for prediction, this level of accuracy is very near the best that can be obtained. The use of additional classification algorithms has the potential to increase prediction accuracy to levels greater than 93.8%.
Table 5. Accuracy using feature selection with Voting Ensemble
|
ML Algorithms |
Accuracy (%age) |
MAE |
Precision |
Recall |
|
Feature Selection: Correlation Attribute Evaluator |
||||
|
NB-BN |
93.8 |
.025 |
.94 |
.94 |
|
RF-RT |
94.9 |
.021 |
.95 |
.95 |
|
J48-RT |
96.9 |
.012 |
.97 |
.97 |
|
MLP-SL |
99.5 |
.002 |
.99 |
.99 |
|
DT-PART |
96.9 |
.012 |
.97 |
.97 |
|
JRip-PART |
97.0 |
.018 |
.97 |
.97 |
|
LR-SL |
98.6 |
.006 |
.99 |
.99 |
Table 6 displays a variety of models that have been applied by the authors to the same dataset along with their respective attained levels of accuracy. The process model that was developed does a better job of correctly predicting how well students will do in their academic careers. A significant amount of research was carried out. Nevertheless, for the objectives of the study, only a few works that were carefully chosen for their high level of quality were taken into consideration. Each model offers a unique set of benefits and drawbacks, in addition to varying degrees of accuracy. Therefore, in the work that is being presented here, a comparison of the various models is carried out on several factors, such as accuracy and classification techniques, and these are taken into consideration while the model is being constructed. The various models, together with the selected techniques used to generate them, are displayed in Table 5, along with the accuracy of their respective classifiers. Table 6. presents a comparison of the various models developed by the authors and their respective levels of accuracy when applied to the same dataset. Saluja et al. [25] provides a straightforward classification technique that, when tested with 10-fold cross-validation, achieves a level of accuracy that is 71.3%. After putting in place the DT system, the accuracy increased to 91.47%. The Naive Bayes algorithms were used by Roy and Garg [30] for the attribute selection, and they attained an accuracy of 73.92%. The authors classified the objects we observed using a combination of the Nave Bayes algorithm, a J48 decision tree, and an MLP.
Salal et al. [31] discovered that algorithms like OneR, RT, and DT can forecast student results with greater than 76.73% accuracy, and they all perform the same function.
The purpose of this research is to construct a model that can estimate how well students will do in college. The results of the experiments reveal that the Particle Swarm Optimization-based strategy that was developed may enhance accuracy by 94.8% and obtain promising outcomes with a minimal number of characteristics. The proposed paradigm could be used to improve the quality of education and make it easier for people to make decisions in the educational system. The accuracy of the classification models that only utilized a single classification method in their models was much lower when compared to the accuracy of the classification models that used a combination of several classifications to develop their models. In the model that was given, the author used hybrid classification algorithms. By using the proposed Model, they were able to get an accuracy of up to 99.5%.
Table 6. Comparison of various classifiers with Proposed Learning Model
|
Authors / References |
Classifier Models |
Accuracy (%age) |
|
Kumar et al. [19] |
SVM, MLP and RF |
95.9 |
|
Roy and Garg [30] |
NB, J48, and MLP |
73.9 |
|
Salal et al. [31] |
NB, J48, RF, REPTree, JRip, OneR, SL and ZeroR |
76.7 |
|
Lemay et al. [32] |
IGRE, Correlation Based Feature Selection |
94.8 |
|
Hamoud [34] |
J48, REPTree and Hoeffding Tree |
91.4 |
|
Asad et al. [35] |
J48, RF, Gradient Boosting, XGB |
95.0 |
|
Bithari et al. [36] |
DT, SVM, LR and Voting classifier |
84.0 |
|
Tasnim et al. [37] |
Random Tree, RF, LMT, AdaBoost.M1, Decision Stump, Hoeffding Tree and J48 |
95.0 |
|
Athani et al. [38] |
NB |
87.0 |
|
Multilevel Heterogeneous Ensemble Predictive Model |
99.5 |
|
To develop a reliable model that can precisely predict how well students will perform in school, researchers are looking into a wide range of EL strategies. For feature selection, further hybrid EL techniques, including stacking and voting, are now being studied for the possibility of adoption with CAE. The findings of this study indicate that algorithms that obtain superior classification results are those that make use of hybridized EL and the correlation attribute evaluator. This contrasts with algorithms that do not make use of EL or feature selection. Ensemble learning, in conjunction with feature selection, is a means by which classification or prediction accuracy can be significantly improved. To be more specific, the conceptual framework of the method is partitioned into four distinct layers, each of which tackles a distinct issue. As a result of putting that into practice and analyzing it, the authors have arrived at the conclusion that is shown below: Some examples of heterogeneous ensemble approaches are stacking and voting, both of which consistently outperform traditional classification algorithms in terms of performance. In addition to this, procedures for feature selection, such as the correlation attribute evaluator, are utilized to ascertain the prediction conclusion that is determined to be the most accurate.
Future research will focus on refining and expanding advanced EL methods, such as hybrid stacking and voting, to further enhance prediction accuracy. Moreover, we plan to explore the integration of more sophisticated feature selection techniques with these ensemble strategies, aiming to optimize the overall performance of student academic performance prediction models.
The Researchers would like to thank the Deanship of Graduate Studies and Scientific Research at Qassim University for financial support (Grant No.: QU-APC-2024-9/1).
[1] Zhang, Y., Yun, Y., An, R., Cui, J., Dai, H., Shang, X. (2021). Educational data mining techniques for student performance prediction: Method review and comparison analysis. Frontiers in Psychology, 12: 698490. https://doi.org/10.3389/fpsyg.2021.698490
[2] Yağci, M. (2022) Educational data mining: Prediction of students’ academic performance using ML algorithms. Smart Learning Environments, 9(1): 11. https://doi.org/10.1186/s40561-022-00192-z
[3] Iatrellis, O., Savvas, I.Κ., Fitsilis, P., Gerogiannis, V.C. (2021). A two-phase machine learning approach for predicting student outcomes. Education and Information Technologies, 26(1): 69-88. https://doi.org/10.1007/s10639-020-10260-x
[4] Zhao, X. (2022). Leveraging data mining technique to enhancing online education and its efficiency study. Mathematical Problems in Engineering, 2022(1): 4946619. https://doi.org/10.1155/2022/4946619
[5] Albahli, S. (2019). A deep ensemble learning method for effort-aware just-in-time defect prediction. Future Internet, 11(12): 246. https://doi.org/10.3390/fi11120246
[6] Kumar, M., Mehta, G., Nayar, N., Sharma, A. (2021). EMT: Ensemble meta-based tree model for predicting student performance in academics. In IOP Conference Series: Materials Science and Engineering, 1022(1): 012062. https://doi.org/10.1088/1757-899X/1022/1/012062
[7] Albahli, S., Irtaza, A., Nazir, T., Mehmood, A., Alkhalifah, A., Albattah, W. (2022). A machine learning method for prediction of stock market using real-time twitter data. Electronics, 11(20): 3414. https://doi.org/10.3390/electronics11203414
[8] Saa, A.A., Al-Emran, M., Shaalan, K. (2020). Mining student information system records to predict students’ academic performance. In the International Conference on Advanced Machine Learning Technologies and Applications (AMLTA2019), Springer International Publishing, 4: 229-239. https://doi.org/10.1007/978-3-030-14118-9_23
[9] Yadav, A., Alexander, V., Mehta, S. (2019). Case-based instruction in undergraduate engineering: Does student confidence predict learning. International Journal of Engineering Education, 35(1): 25-34.
[10] Ruiz, S., Urretavizcaya, M., Rodríguez, C., Fernández-Castro, I. (2020). Predicting students’ outcomes from emotional response in the classroom and attendance. Interactive Learning Environments, 28(1): 107-129. https://doi.org/10.1080/10494820.2018.1528282
[11] Raga, R.C., Raga, J.D. (2019). Early prediction of student performance in blended learning courses using deep neural networks. In 2019 International Symposium on Educational Technology (ISET), Hradec Kralove, Czech Republic, pp. 39-43. https://doi.org/10.1109/ISET.2019.00018
[12] Kuzilek, J., Vaclavek, J., Zdrahal, Z., Fuglik, V. (2019). Analysing student VLE behaviour intensity and performance. Transforming Learning with Meaningful Technologies, 14: 587-590. https://doi.org/10.1007/978-3-030-29736-7_45
[13] Sokkhey, P., Okazaki, T. (2019). Comparative study of prediction models on high school student performance in mathematics. In 2019 34th International Technical Conference on Circuits/Systems, Computers and Communications (ITC-CSCC), JeJu, Korea (South), pp. 1-4. https://doi.org/10.1109/ITC-CSCC.2019.8793331
[14] Arifin, M., Wibowo, A., Warsito, B. (2021). Comparative analysis on educational data mining algorithm to predict academic performance. In 2021 International Seminar on Application for Technology of Information and Communication (iSemantic), Semarangin, Indonesia, pp. 173-178. https://doi.org/10.1109/iSemantic52711.2021.9573185
[15] Moreno-Marcos, P.M., Pong, T.C., Munoz-Merino, P.J., Kloos, C.D. (2020). Analysis of the factors influencing learners’ performance prediction with learning analytics. IEEE Access, 8: 5264-5282. https://doi.org/10.1109/ACCESS.2019.2963503
[16] Asif, R., Merceron, A., Ali, S.A., Haider, N.G. (2017) Analyzing undergraduate students’ performance using educational data mining. Computers & Education, 113: 177-194. https://doi.org/10.1016/j.compedu.2017.05.007
[17] Cruz-Jesus, F., Castelli, M., Oliveira, T., Mendes, R., Nunes, C., Sa-Velho, M., Rosa-Louro, A. (2020) Using artificial intelligence methods to assess academic achievement in public high schools of a European Union country. Heliyon, 6(6): e04081. https://doi.org/10.1016/j.heliyon.2020.e04081
[18] Fernandes, E., Holanda, M., Victorino, M., Borges, V., Carvalho, R., Van Erven, G. (2019). Educational data mining: Predictive analysis of academic performance of public school students in the capital of Brazil. Journal of Business Research, 94: 335-343. https://doi.org/10.1016/j.jbusres.2018.02.012
[19] Kumar, M., Sharma, B., Handa, D. (2022). Building predictive model by using data mining and feature selection techniques on academic dataset. International Journal of Modern Education and Computer Science, 11(4): 16. https://doi.org/10.5815/ijmecs.2022.04.02
[20] Rebai, S., Ben Yahia, F., Essid, H. (2020) A graphically based machine learning approach to predict secondary schools’ performance in Tunisia. Socio-Economic Planning Sciences, 70: 100724. https://doi.org/10.1016/j.seps.2019.06.009
[21] Ahmad, Z., Shahzadi, E. (2018). Prediction of Students' academic performance using artificial neural network. Bulletin of Education and Research, 40(3): 157-164.
[22] Balcioğlu, Y.S., Artar, M. (2023). Predicting academic performance of students with machine learning. Information Development. https://doi.org/10.1177/02666669231213023
[23] Priyambada, S.A., Usagawa, T., Mahendrawathi, E.R. (2023). Two-layer ensemble prediction of students’ performance using learning behavior and domain knowledge. Computers and Education: Artificial Intelligence, 5: 100149. https://doi.org/10.1016/j.caeai.2023.100149
[24] Holicza, B., Kiss, A. (2023). Predicting and comparing students’ online and offline academic performance using machine learning algorithms. Behavioral Sciences, 13(4): 289. https://doi.org/10.3390/bs13040289
[25] Saluja, R., Rai, M., Saluja, R. (2023). Original research article designing new student performance prediction model using ensemble machine learning. Journal of Autonomous Intelligence. https://doi.org/10.32629/jai.v6i1.583
[26] Talebi, K., Torabi, Z., Daneshpour, N. (2024). Ensemble models based on CNN and LSTM for dropout prediction in MOOC. Expert Systems with Applications, 235: 121187. https://doi.org/10.1016/j.eswa.2023.121187
[27] Kaggle (2020), Student Performance Data Set. https://www.kaggle.com/datasets/larsen0966/student-performance-data-set.
[28] Butt, A.H., Alkhalifah, T., Alturise, F., Khan, Y.D. (2023). Ensemble learning for hormone binding protein prediction: A promising approach for early diagnosis of thyroid hormone disorders in serum. Diagnostics, 13(11): 1940. https://doi.org/10.3390/diagnostics13111940
[29] Gasmi, K., Ammar, L.B., Krichen, M., Alamro, M.A., Mihoub, A., Mrabet, M. (2024). Optimal ensemble learning model for dyslexia prediction based on an adaptive genetic algorithm. IEEE Access, 12: 64754-64764. https://doi.org/10.1109/ACCESS.2024.3395803
[30] Roy, S., Garg, A. (2017). Predicting academic performance of student using classification techniques. In 2017 4th IEEE Uttar Pradesh Section International Conference on Electrical, Computer and Electronics (UPCON), Mathura, India, pp. 568-572. https://doi.org/10.1109/UPCON.2017.8251112
[31] Salal, Y.K., Abdullaev, S.M., Kumar, M. (2019). Educational data mining: Student performance prediction in academic. International Journal of Engineering and Advanced Technology, 8(4C): 54-59.
[32] Lemay, D.J., Baek, C., Doleck, T. (2021). Comparison of learning analytics and educational data mining: A topic modeling approach. Computers and Education: Artificial Intelligence, 2: 100016. https://doi.org/10.1016/j.caeai.2021.100016
[33] Lab. Meteorological Dataanalysis…. Fourthstage. https://uomustansiriyah.edu.iq/media/lectures/6/6_2022_03_10!05_35_33_PM.pdf, access on Apr. 15, 2024.
[34] Hamoud, A. (2016). Selection of best decision tree algorithm for prediction and classification of students’ action. American International Journal of Research in Science, Technology, Engineering & Mathematics, 16(1): 26-32. https://ssrn.com/abstract=3027086
[35] Asad, R., Arooj, S., Rehman, S.U. (2022). Study of Educational Data Mining Approaches for Student Performance Analysis. Technical Journal of University of Engineering & Technology Taxila, 27(1): 68-81.
[36] Bithari, T.B., Thapa, S., Hari, K.C. (2020). Predicting academic performance of engineering students using ensemble method. Technical Journal, 2(1): 89-98. https://doi.org/10.3126/tj.v2i1.32845
[37] Tasnim, N., Paul, M.K., Sattar, A.S. (2019). Identification of drop out students using educational data mining. In 2019 International Conference on Electrical, Computer and Communication Engineering (ECCE), Cox'sBazar, Bangladesh, pp. 1-5. https://doi.org/10.1109/ECACE.2019.8679385
[38] Athani, S.S., Kodli, S.A., Banavasi, M.N., Hiremath, P.S. (2017). Student academic performance and social behavior predictor using data mining techniques. In 2017 international conference on computing, communication and automation (ICCCA), Greater Noida, India, pp. 170-174. https://doi.org/10.1109/CCAA.2017.8229794