Mohamad Jamil*![]() | Hadiyanto Hadiyanto
| Hadiyanto Hadiyanto![]() | Ridwan Sanjaya
| Ridwan Sanjaya![]()
© 2024 The authors. This article is published by IIETA and is licensed under the CC BY 4.0 license (http://creativecommons.org/licenses/by/4.0/).
OPEN ACCESS
The objective of this research is to classify public comments on YouTube related to disaster preparedness simulations through sentiment analysis. The research process included data collection, labeling, pre-processing, and classification. Support Vector Machine (SVM) and Naïve Bayes algorithms were used for classification. Following manual labeling of 204 datasets, the breakdown of sentiment was as follows: 112 positive, 43 negative, and 49 neutral. The evaluation involved two scenarios: performance testing and sensitivity testing. Performance testing, conducted on pre-processed datasets, revealed that Naïve Bayes Classifier (NBC) achieved an accuracy rate of 80.4%, with the best execution time of 0.0097 seconds. In contrast, the Support Vector Machine (SVM) achieved the highest accuracy rate of 72.3%, albeit with a longer worst-case execution time of 193.48 seconds. Furthermore, in the results of sensitivity measurements using the dataset without going through the pre-processing stages, each method was able to show the best results with a value of 100%.
disaster, simulation, sentiment analysis, naïve bayes, Support Vector Machine, classification, YouTube
A disaster is a sudden event caused by natural, non-natural, and social factors, thus impacting the community and the surrounding environment. In general, the causal factors for disasters are caused by several trigger components, threats or hazards, and vulnerabilities that work together systematically to cause risk to the community [1, 2]. Disaster risk can be reduced through systematic efforts to analyze and reduce the causal factors of disasters, one of which is understanding disaster risk reduction. The outreach related to disaster awareness and preparedness in the community is one of the non-structural disaster mitigation efforts that must be strengthened by increasing awareness, preparedness, and public education on disaster mitigation so that it is entrenched in society. The existence of social media is evidence of the development of information and communication technology that is often used today. Social media can be used as an effective tool in education and outreach to the public. Social media is increasingly used for socialization, simulation, learning, and collaboration. Social media can offer helpful information for containing catastrophe risk and responding to emergencies [3, 4]. Of the various types of social media sites, online video-sharing applications have been shown to have the highest interactive rate [5].
YouTube is the second-largest search engine behind Google and one of the most significant video-sharing platforms in the world [6]. YouTube offers dynamic new opportunities for practical learning models compared to traditional ones [7]. YouTube is the largest online digital video channel, with over two billion users, and more than one billion hours of YouTube videos are watched daily [8]. To reduce the risks caused by disasters in Indonesia, the government, through BNPB (the National Agency for Disaster Countermeasures), always tries to provide educative outreach to the public in various ways, such as counseling, training or workshops, as well as direct simulations or through mass media, electronic, and social media [9].
One form of outreach utilizing social media that BNPB has carried out is their YouTube channel, which can be accessed via the link https://www.youtube.com/@BNPBIndonesia/video. The YouTube channel, in addition to covering coverage of activities carried out by BNPB, also contains procedures and steps related to disaster preparedness for the community. Dissemination of disaster management through the YouTube platform can effectively convey information and education to the public. However, to make the dissemination of disaster management through YouTube more effective, of course, it is necessary to see the extent to which the public responds to the content presented. For this reason, this research will classify public comments on the YouTube channel on disaster management simulations in Indonesia through sentiment analysis. Sentiment analysis is an approach that makes it possible to obtain condensed viewpoints from particular sources that contain substantial volumes of data [10]. Sentiment analysis identifies, recognizes, and/or categorizes user emotions or thoughts for any service, such as movies, product issues, events, or each attribute, as positive, negative, or neutral [11, 12]. Many techniques can be employed to classify each attribute, such as the Naive Bayes Classifier, Support Vector Machine, K-NN, RNN, C4.5, Lexicon, and LDA-Based Topic Modeling [13]. Some existing literature on sentiment analysis, especially related to social media, explains that the Naïve Bayes Classifier (NBC) method is a simple method that has a high level of accuracy from classification results where the accuracy level is influenced by the amount of test data [14], the NBC algorithm is perfect for analysis text but not allowed for data in the form of images. Support Vector Machine (SVM) produces the maximum level of accuracy from data in the form of text or images.
In dynamic disaster emergencies, understanding community reactions and perceptions is key to designing a rapid and effective response. The use of sentiment analysis in disaster management can be a tool for policy makers in identifying and understanding how society responds to disaster situations that occur. Maharani in his research used sentiment analysis to classify the relevance of tweet data for disaster emergency response situations during floods in Maharani [15]. Li et al. [16] in research created sentiment analysis to collect public opinion via social media to provide information to decision makers in urban disaster management and sustainable development.
Social media involvement has a significant impact on disaster management. Several studies have demonstrated the value and usefulness of YouTube as a data storage and dissemination platform, but no research has been conducted on the extent to which video content presented using YouTube can provide effective understanding for the community to improve disaster preparedness.
From the background, in this research a sentiment analysis will be made using two types of approaches, namely in the form of text and images using NBC and SVM to classify public comments submitted via YouTube channels in order to observe the effectiveness of video content presented on YouTube in disaster preparedness simulations.
This section discusses several literature reviews on the basic concepts of sentiment analysis and the classification methods used, i.e., Naïve Bayes (NBC) and Support Vector Machine (SVM).
2.1 Sentiment analysis
Sentiment analysis, called opinion mining, is a computational study that identifies and expresses subjectivity, judgments, opinions, feelings, assessments, attitudes, and emotions in a text [17]. According to Parabhoi and Saha [18], sentiment analysis is related to the automatic extraction of information from text, and these sentiments can be categorized into positive, negative, neutral, or n-point scale [19, 20]. Sentiment analysis studies user opinions, assessments, attitudes, and feelings expressed on social media or other online platforms [21]. The purpose of sentiment analysis is to extract the attributes and components of several comments on social media and determine several positive, negative, and neutral classes. The results of sentiment analysis can provide an overview of customers so that a company can determine the next steps in developing brands and products. In addition, in the context of government policy, the results of sentiment analysis can be used to develop strategies so that policies can be accepted and/or improved to improve public services.
2.2 Classification method
One of the primary subjects of data mining or machine learning is classification [22]. When data is utilized for classification, it is grouped according to a label or target. Classification is the process of finding a model (or function) that differentiates a class of data or concepts whose purpose is to be used for predictions class of an object whose class label is unknown. Model found by training data analysis (data object whose class is known). The classification process can be carried out after a relevance analysis to determine the attributes relevant to the process. The predictive accuracy of a classifier can be stated in a contingency table or confusion matrix. As part of supervised learning, classification involves analyzing a data set and then using the pattern found in the analysis findings to classify the test data. The two steps in the data classification process are learning and classification. A classification algorithm is used to evaluate data in learning training, and data testing is then employed in classification to verify the degree of accuracy of the classification rules applied. Based on distinctions in mathematical ideas, classification approaches are categorized into five groups: rule-based, statistical-based, distance-based, decision tree-based, and neural network-based. There are many algorithms from each of these categories, but those that are popular and frequently used include naive Bayes, nearest neighbor, decision tree, and support vector machine [23].
2.2.1 Naïve Bayes Classifier (NBC)
Naive Bayes is a data classification method based on probability [24]. This method, known as Bayes' theorem, predicts future opportunities based on previous experience. The theorem is combined with Naive, where it is assumed that the conditions between the instructions (attributes) are mutually independent. The advantage of this method is that it can be used for quantitative and qualitative data classification, does not require a large amount of data, can be used for classification for two or more classes (multiclass). The approach of the algorithm uses the following equation:
$P(C \mid Z)=\frac{p(Z \mid C) X p(c)}{p(z)}$ (1)
Eq. (1) shows that c is the class label, z is the applied attribute, while P(c) and P(x|c) are the previous class probabilities. In the naïve Bayes classification, the data set to be processed is categorized into three classes, positive, negative, and neutral [25].
2.2.2 Support Vector Machine (SVM)
One approach in the Supervised Learning category is the Support Vector Machine algorithm, which implies that machine learning is done on already labeled data. The machine classifies the test data into labels during the decision-making process based on its attributes [26, 27]. In the SVM method, the main point is to optimize a hyperplane. The hyperplane is a boundary that separates class one support vectors from other class support vectors [28]. Optimizing support vectors, especially support vectors that are close between one class and another, is used as a benchmark for classification limits so that the hyperplane will be optimal [29]. This vector comes from a dataset converted into a vector value through vectorization after the feature extraction process and is used as a support vector. For example, the training dataset consists of x and y in the form $\left\{\left(x_1, y_1\right), \ldots,\left(x_n, y_n\right)\right\}$ where x is called a vector and y is the class label.
2.2.3 Kernel in Support Vector Machine (SVM)
The kernel in the Support Vector Machine method is a separator between one class and another. There are several kernels to support vector machines, including Linear, Polynomial, and Radial Basis Functions (RBF) [30].
a. Linear
Linear kernels use straight lines as a boundary/hyperplane between classes. The linear kernel only requires two variables, including $x_i$ and $x_j$. This variable is a vector of the results of the vectorization of the feature extraction weight values. In the calculation, the value of the vector $x_i$ is transposed before being multiplied by $x_j$. It's the same with the linear kernel for labeling results in the target class.
$k\left(x_i, x_j\right)=x \frac{T}{i} x_j$ (2)
b. RBF
In its completion, RBF requires parameters gamma and C. Gamma functions as a decision boundary and decision area. For example, if gamma is small, the decision boundary will be small, but the decision area will be vast, and vice versa. The gamma value used must be greater than zero. C serves as a penalty against errors in classification. x is taken from the vector as a result of vectorization. Exp is the exponent of the calculation of x and gamma:
$\operatorname{Exp}\left(-\gamma\left\|x_i-x\right\|\right), \gamma>0$ (3)
c. Polynomial
The Polynomial kernel has two different parameters from other kernels. Parameter r is an independent parameter called homogeneous if r is filled with zero. At the same time, the parameter d is the degree/square, which is generally filled with d equal to 2:
$k\left(x_i, x\right)=\left(y \cdot x_i^t x+r\right)^2$ (4)
2.3 Confusion matrix
A performance indicator for machine learning classification, the confusion matrix allows for the output of class results to contain more than two classes [31]. The confusion matrix is a table for recording the results of classification work [32, 33]. A classification model's performance is assessed using the confusion matrix, where n is the number of class targets. The performance of the classification model is determined by comparing the numbers in the matrix between the actual value and the predicted value produced by the model. Table 1 below is an example of a confusion matrix.
Table 1. Example of confusion matrix
|
Prediction |
Actual Value |
|
|
Positive |
TP |
FP |
|
Negative |
FN |
TN |
True Positive (TP) is the amount of data with positive class actual values and positive class predicted values by the classification model; False Positive (FP) is the sum of the actual value of the negative class and the predicted value of the positive class by the classification model; False Negative (FN) is the sum of the actual value of the positive class and the predicted value of the negative class by the classification model; Negative (TN) is the sum of the actual value of the negative class and the predicted value of the negative class by the classification model. It is necessary to use the following Eq. (5) to get an accuracy value, measuring how accurate the classification model results are:
Acuraccy $=\frac{T P+T N}{T P+T N+F P+F N}$ (5)
Precision is the level of accuracy of the model's prediction value in predicting the positive and correct class. This value results from the positive predictive value compared to the number of positive values classified by the model. The following equation can obtain the precision value:
Precesion $=\frac{T P}{T P+F P}$ (6)
Recall is the number of true positive values (TP) compared to actual positive values. Eq. (7) below is the formula used to get the recall value.
Recall $=\frac{T P}{T P+F N}$ (7)
2.4 Related works
Several previous studies have discussed sentiment analysis of comments on social media using various methods. Rajkumar et al. [34] This research uses supervised learning to detect feelings on Twitter. It compares two algorithms: K-nearest neighbor (KNN) and Naïve Bayes (NB). It finds that Naïve Bayes has a higher ideal accuracy level than KNN. Bamane et al. [35] conducted a sentiment analysis based on the number of likes and dislikes opinions. Khan et al. [36] used the Naïve Bayes algorithm for multi-label classification to understand the behavior and responses of individuals after viewing specific videos on YouTube. Bhuiyan et al. [37] focused their research on improving the YouTube video capture process. They analyze the sentiment on YouTube comments to find the most relevant videos by search. Barzenji [38] three algorithms (support vector machine, random forest, and Naïve Bayes) were used to study Twitter tweets' subjective polarity (positive, negative, and neutral). SVM had an accuracy of 82%, compared to 72% for random forest and Naïve Bayes. Subsequent research conducted by Kavitha et al. [39] categorizes user comments on YouTube based on video relevance using a comparative analysis with the Bag of Words and Association List approaches. Tanesab et al. [40] conducted a sentiment analysis of netizen comments on YouTube using a Support Vector Machine (SVM) with a positive rate of 91.1%. Some of the research presented previously certainly has the same objective, namely to conduct sentiment analysis, but further research that will be carried out tends to look at the effectiveness of the use of media used concerning the socialization of disaster management in Indonesia based on comments from the public.
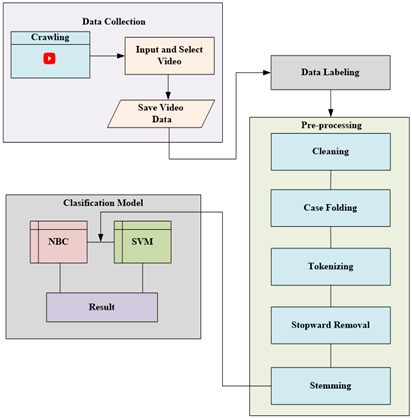
This section discusses the stages and steps taken to realize the proposed research. the stages we carry out begin with data collection, labeling, pre-processing and classification. The research began by collecting data using the crawling technique to see community comments on various disaster simulation videos on the YouTube channel with the aim of knowing how effective the media used in the educational process, both simulation and socialization. A complete description of the stages to be carried out is shown in Figure 1.
Figure 1. Research stages for sentiment analysis
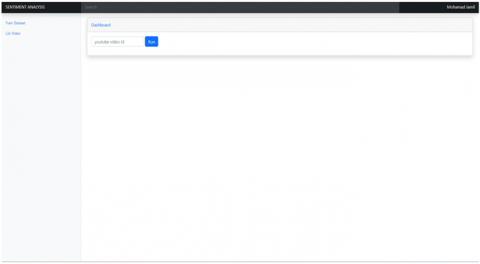
(a) Sentiment analysis application page
(b) Train dataset page
Figure 2. Sentiment analysis application and train dataset pages
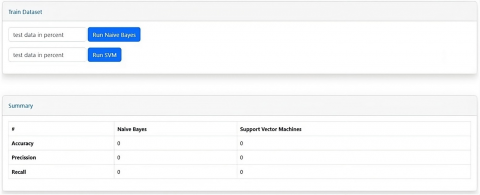
Figure 3. Labeling process
Figure 4. Flowchart of classification process using NBC dan SVM
3.1 Data collection
Our main goal is to identify video content that contains various guidelines, simulations and education about the disaster preparedness process. The initial step taken is to enter a search command in the browser with the following query: https://www.youtube.com/results?search_query=bnpb+simulasi+bencana+mitigation+disaster+animation+simulation+disaster. After obtaining data from the various videos we were looking for, we then selected the content of the existing videos one by one by selecting the type of video that was appropriate to the topic of this research, as well as looking at the number of comments from the public regarding the video shows presented. In the selection process stage, we designed a web-based sentiment analysis application to facilitate the crawling, labeling, classification and analysis processes. Crawling is done by entering the videoID in the application, after the request is sent, YouTube will respond by sending the requested web page to the crawler, then extracting the information needed for processing to the next stage. Table 2 below shows the dataset from crawling various types of disaster simulation videos.
Based on the web crawling results we conducted, there were 33 video datasets related to disaster simulation, with a total of 696 comments. Figure 2(a) shows the main interface of the sentiment analysis application, while Figure 2(b) shows the training dataset interface.
Table 2. The dataset from crawling disaster simulation videos
|
No. |
VideoID |
Number of Comments |
|
1 |
nk38uvgEWkM |
87 |
|
2 |
aIxvmNAEhZU |
10 |
|
3 |
b5wjvTA4ao4 |
25 |
|
4 |
IJFVib4YiXA |
8 |
|
5 |
_W1p2Of-nlc |
237 |
|
6 |
-QP9vI4NZkY |
8 |
|
7 |
UcbENUL6G9o |
60 |
|
8 |
zAz8MJuNzCQ&t=25s |
16 |
|
9 |
A6QPP1X6IEM |
20 |
|
10 |
wxH8tV2C8Ww&t=58s |
49 |
|
11 |
0rjob-YK-n8 |
0 |
|
12 |
2H489tL-FNk |
1 |
|
13 |
0AYFChlPoB0 |
3 |
|
14 |
7pSDBfMO17Y |
1 |
|
15 |
zTKpsNq-9ik |
0 |
|
16 |
b3D7fn1Cuec |
16 |
|
17 |
GlzpBn0CSOY |
4 |
|
18 |
P_yW7RwPMMY |
3 |
|
19 |
8-ZZ3uzZkp0 |
2 |
|
20 |
nJeNMDZvcrQ |
0 |
|
21 |
USZ1BBJss_A |
0 |
|
22 |
cVgIy_HpA3k |
11 |
|
23 |
EV1DkiCgkn0 |
17 |
|
24 |
_QOEvpxc7RA |
1 |
|
25 |
gp3VE0BsSr0 |
0 |
|
26 |
Z5VkdB6Xbu8 |
15 |
|
27 |
DeafytS3Rjw&t=100s |
27 |
|
28 |
NP61elQ5xgE |
0 |
|
29 |
rwsGVH9Lq3w |
3 |
|
30 |
Myfsxaf-OTc |
23 |
|
31 |
gsWZ5HhWrLc |
23 |
|
32 |
Cbj4xkARhkY |
3 |
|
33 |
A2OV5-6doTo |
18 |
|
|
Total Number of Comments |
696 |
3.2 Labelling
The labeling process in sentiment analysis involved assigning specific sentiment labels to the texts to be analyzed, such as positive, negative, or neutral. The goal of this process is to classify the text based on the sentiment expressed within it. Out of the 696 comments obtained, 204 comments were successfully labeled. This was due to the presence of many redundant comments. The labeled comments consist of 112 positive comments, 43 negative comments, and 49 neutral comments. Figure 3 illustrates an example of the labeling process.
3.3 Preprocessing
Before sentiment analysis is carried out from the YouTube comment data taken, it is necessary to process the data to be ready for sentiment analysis. One data mining technique is preprocessing, which transforms unprocessed data into a processable data structure. Freshly retrieved raw data is often incomplete, inconsistent, and contains many errors. Stages in preprocessing techniques: cleaning, case folding, tokenizing, and stemming.
3.3.1 Cleaning
The comment data on each video presented needs to be fully cleaned and prepared before applying any classifying algorithm. Within each text, many (mentions, hashtags, emoticons, punctuation, spaces, unconventional symbols) have no value on classification and must be removed (filtered). One of the biggest advantages of this step is that it makes the data smaller, saving storage capacity.
3.3.2 Case folding
Case folding helps ensure that the same words in a text with different use of uppercase and lowercase letters are considered one entity. It is useful for avoiding situations where the same word is perceived as two different words due to the use of uppercase and lowercase letters.
3.3.3 Stopword removal
Stopword is the process of removing existing words from the list of stopwords. Stopwords, such as prepositions, interjections, and pronouns, appear in large numbers with a function but no meaning.
3.3.4 Stemming
Stemming data is the process of filtering words that contain conjunctions, pronouns, prepositions, and root words by removing prefixes or suffixes. The main purpose of stemming is to reduce the variation of words with the same root word so that they can be counted as one entity in text analysis.
3.4 Sentiment analysis classification model
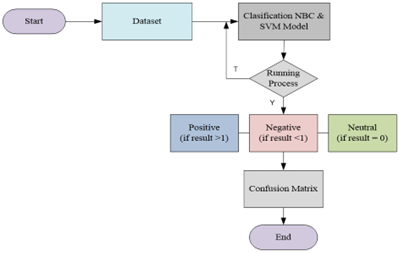
Following data preprocessing, the next step involved the classification process. In this stage, comments from the presented videos were classified. Classification was carried out using the Naïve Bayes Classifier (NBC) and Support Vector Machine (SVM) algorithms to predict positive, negative, and neutral values. Figure 4 shows the flowchart of the classification process using NBC and SVM. The classification results were then presented using a confusion matrix with accuracy and precision parameters. To detect sentiment classification, in this study, the polarity scores of each attribute were set as follows: positive if > 1, neutral if = 0, and negative if < 1, as per Eq. (8):
$\left\{\begin{array}{c}\text { positive if \$positive }>1 \text { \$negative } \\ \text { netral if \$positive }=0 \text { \$negative } \\ \text { negative if \$positive }<1 \text { \$negative }\end{array}\right\}$ (8)
3.5 Feature extraction
Each word found in the reviews will be assigned a weight based on its calculation. In this feature extraction phase, we will perform term weighting, which is the process of assigning values to each term in the preprocessed review data. The method known as Term Frequency-Inverse Document Frequency (TF-IDF) will be employed for assigning weight values [41]. The results of this word weighting will then serve as inputs for the classification process.
In this section, we will present the results of sentiment analysis experiments conducted on a dataset of user comments from various disaster simulation videos on YouTube. Testing scenarios were performed in two ways: performance evaluation scenario and sensitivity evaluation scenario. Two types of datasets were used in this study: a dataset with preprocessing and successfully labeled 204 comments, and a dataset without preprocessing, containing 696 comments. The testing process was conducted six times with data distribution compositions as shown in Tables 3 and 4 below.
Based on the performance evaluation test results, it can be observed that the composition ratio of training data to test data significantly affects the performance of each method used. The use of training and test data composition has an impact on the validation of machine learning models [42]. The best accuracy score was achieved when the training data to test data ratio was set at 80:20. NBC obtained an accuracy score of 80.4% with the best execution time of 0.0097 seconds, while SVM could only achieve a maximum accuracy score of 72.3% with the worst execution time of 193.48 seconds. A unique finding during the testing of the NBC method using different training data compositions (20:80 and 30:70) resulted in an execution time of 0.0030 seconds. This is because the SVM model is more suitable for classifying long documents, while NBC is better suited for snippets or short documents [43]. Naïve Bayes is an appropriate and effective algorithm to improve machine learning model performance [44].
Table 3. Results of performance evaluation NBC and SVM methods (preprocessing stages)
|
Method |
|
Classification |
Accuracy (%) |
Precession (%) |
Recall (%) |
Time |
||
|
Ratio (Train & Test) |
Positive |
Negative |
Neutral |
|||||
|
ACTUAL |
|
112 |
43 |
49 |
||||
|
NBC |
10:90 |
80 |
0 |
105 |
67.9 |
45.8 |
37 |
0.0134 |
|
|
20:80 30:70 70:30 80:20 90:10 |
116 89 40 25 14 |
18 19 17 13 7 |
30 36 5 3 0 |
73.9 75 76.3 80.4 71.4 |
47.4 50.7 54.5 64.9 55.6 |
52.6 53.5 57.4 69.3 38.1 |
0.0230 0.0230 0.0139 0.0097 0.0089 |
|
SVM |
10:90 |
149 |
0 |
36 |
68.6 |
37.7 |
29.6 |
0.4081 |
|
|
20:80 30:70 70:30 80:20 90:10 |
119 110 49 30 17 |
9 5 4 6 3 |
36 29 9 5 1 |
71.1 71.7 70.9 72.3 68.2 |
42.8 42.7 46.5 51 49.2 |
44.7 40.8 63.4 61.1 71.2 |
4.9820 23.294 106.77 193.48 242.67 |
Table 4. Results of sensitivity evaluation NBC and SVM methods (without preprocessing stages)
|
Method |
|
Classification |
Accuracy (%) |
Precession (%) |
Recall (%) |
Sensitivity (%) |
F1-Score (%) |
Time |
||
|
Ratio (Train & Test) |
Positive |
Negative |
Neutral |
|||||||
|
ACTUAL |
|
393 |
60 |
243 |
||||||
|
NBC |
10:90 |
389 |
82 |
156 |
65 |
35 |
29.6 |
63.4 |
1.9 |
0.0034 |
|
|
20:80 30:70 70:30 80:20 90:10 |
381 327 127 86 42 |
121 127 36 24 12 |
55 34 46 30 16 |
66.9 72.8 83.2 82.5 82.8 |
43.7 67 96.1 96.08 100 |
35.8 52.1 81.06 81.01 80.95 |
68.1 74 100 100 100 |
2.04 2.22 3 3 3 |
0.0161 0.0195 0.0305 0.0477 0.0127 |
|
SVM |
10:90 |
492 |
22 |
113 |
70.8 |
46.1 |
51.5 |
80.7 |
2.4 |
26.974 |
|
|
20:80 30:70 70:30 80:20 90:10 |
416 345 57 37 18 |
47 113 36 24 12 |
94 30 52 34 16 |
71 72.7 100 100 100 |
51.2 66.6 133.3 133.3 133.3 |
54.6 54.3 133.3 133.3 133.3 |
91.2 97.4 100 100 100 |
2.7 2.9 3 3 3 |
114.51 387.68 8,094.7 5,361.3 6,838.6 |
For precision comparison, NBC achieved a precision score of 64.9%, while SVM obtained a precision score of 51%. In measuring recall, NBC only achieved a score of 69.3%, while SVM was able to achieve the highest score of 71.2%. A high recall score in an SVM model indicates that the model has good ability to identify most of the true positives from the actual positive class in the dataset. This improvement is also due to the use of the C parameter (penalty parameter) with a value of C=1, adjusting the value of the C parameter can enhance identification ability [45]. In the process of classifying positive, negative, and neutral sentiment comments, neither method was able to provide the best results that matched the actual sentiment data (manual labeling). The NBC predictions found 116 positive comments, 19 negative comments, and 36 neutral comments, while SVM found 110 positive comments, 9 negative comments, and 36 neutral comments. The differences may be due to some comments that have initial, middle, and final part of the sentence categorized as positive, but actually contain negative words in the middle of the sentence, or vice versa. This naturally results in ambiguous sentences. Ambiguous sentences can lead to errors in the classification process [46]. Other constraints were also caused by the imbalance of data in the labeling process. The difference in the number of labeled positive and negative data sets will affect the results obtained [47], and may cause minority class data to be misclassified as majority class data [48]. Further sensitivity measurement evaluation with a larger dataset than before resulted in the following results as shown in Table 4.
According to the Table 4, it can be seen that SVM has an excellent accuracy rate of 100%, compared to NBC, which can only achieve a maximum accuracy of 82.8%. The accuracy, precision, recall, and F1-Score values obtained by SVM tend to remain constant when the training data is larger than the test data. This is because SVM aims to maximize the distance to the nearest training points from one of the classes to achieve better classification performance on test data [49]. The more data is provided to the training data, the higher the accuracy achieved [50], but using larger datasets also increases the execution time. Furthermore, in measuring sensitivity, each method was able to show the best results with a value of 100%. This certainly proves that the greater the sensitivity value obtained, the greater the classification system can classify the positive class well.
In this paper, we have analyzed the sentiment of user reviews on disaster simulation videos found on various YouTube channels. We utilized the Naïve Bayes (NBC) and Support Vector Machine (SVM) methods to classify the dataset of user comments, aiming to assess the effectiveness of using YouTube as a medium to educate the public. We collected a total of 696 comments, and after preprocessing, we obtained a dataset consisting of 204 comments. The labeling process resulted in 112 comments with a positive sentiment, 43 with a negative sentiment, and 49 with a neutral sentiment. Testing was conducted using two evaluation scenarios: performance measurement evaluation and sensitivity measurement evaluation. In terms of performance measurement evaluation using the preprocessed dataset, NBC achieved the highest accuracy rate of 0.804 or 80.4% with an execution time of 0.0097 seconds.
Meanwhile, with an execution time of 193.48 seconds, we obtained an accuracy rate of 0.723, or 72.3%, utilizing the Support Vector Machine (SVM) approach. Furthermore, in the results of sensitivity measurements using the dataset without going through the pre-processing stages, each method was able to show the best results with a value of 100%. The higher sensitivity value indicates better classification of the positive class. Therefore, the choice of a classification method depends on several factors, including the dataset size, data type, data characteristics, execution time, classification objectives, and data dimensions. In conclusion, this research recommends the use of the NBC method for sentiment analysis of public comments on YouTube related to disaster mitigation simulations. This recommendation is based on its fast execution time and the relatively small dataset of comments collected. The successful sentiment analysis results demonstrate that video-based media is still effective for simulation and learning processes, although there is room for further development of simulation media that can seamlessly integrate virtual and real-world simulation processes.
The practical implication given in this research is that using sentiment analysis can help disaster management institutions in designing more effective counseling and communication messages via YouTube channels with content that better understands community needs and is relevant to disaster management steps. including:
(1) Understanding People's Emotions and Perceptions: Sentiment analysis allows governments and related institutions to understand people's emotions, perceptions and attitudes towards disasters. This helps in determining appropriate and effective responses.
(2) Evaluate Response Effectiveness: Through sentiment analysis, disaster management agencies can evaluate the effectiveness of their response and refine strategies based on public feedback obtained from social media and other online platforms.
(3) Encourage Public Participation: Through sentiment analysis, public participation in disaster management can be increased by facilitating easier feedback and giving the public a more active role in the decision-making process.
(4) Community-Based Approach: Sentiment analysis enables governments and related institutions to better adopt a community-based approach to disaster management, taking into account the immediate needs, hopes and aspirations of affected communities.
This research was supported by the Doctoral Program of Information Systems. School of Postgraduate Studies, Diponegoro University, and Informatics Engineering Study Program Khairun University.
|
NBC |
naive bayes |
|
SVM |
support vector machine |
|
c |
class label |
|
z |
attribute |
|
k |
kernel |
|
Greek symbols |
|
|
ɣ |
gamma |
|
> |
greater than |
|
< |
less than |
[1] Chaudhary, M.T., Piracha, A. (2021). Natural disasters-origins, impacts, management. Encyclopedia, 1(4): 1101-1131. https://doi.org/10.3390/encyclopedia1040084
[2] Chowdhury, S., Chakraborty, P. P. (2017). Universal health coverage-There is more to it than meets the eye. Journal of Family Medicine and Primary Care, 6(2): 169-170. https://doi.org/10.4103/jfmpc.jfmpc
[3] Chan, J.C. (2013). The role of social media in crisis preparedness. Rahs Think Cent. Available: http://www.oecd.org/governance/risk/The role of social media in crisis preparedness, response and recovery.pdf.
[4] Jurek, A., Mulvenna, M.D., Bi, Y. (2015). Improved lexicon-based sentiment analysis for social media analytics. Security and Information, 4(1): 1-13. https://doi.org/10.1186/s13388-015-0024-x
[5] Khan, M.L. (2017). Social media engagement: What motivates user participation and consumption on YouTube? Computers in Human Behavior, 66: 236-247. https://doi.org/10.1016/j.chb.2016.09.024
[6] Djerf-Pierre, M., Lindgren, M., Budinski, M.A. (2019). The role of journalism on YouTube: Audience engagement with 'superbug' reporting. Media Communication, 7(1): 235-247. https://doi.org/10.17645/mac.v7i1.1758
[7] Almobarraz, A. (2018). Utilization of YouTube as an information resource to support university courses. Electronic Libraries, 36(1): 71-81. https://doi.org/10.1108/EL-04-2016-0087
[8] Duffett, R. (2020). The YouTube marketing communication effect on cognitive, affective and behavioural attitudes among Generation Z consumers. Sustainability, 12(12): 5075. https://doi.org/10.3390/su12125075
[9] Waleleng, G.J., Sondakh, M., Paat, C. (2022). Theization model of local disaster management agency mitigation in communities vulnerable to flood affects. International Journal of Paper Public Review, 3(3): 34-43. https://doi.org/10.47667/ijppr.v3i3.172
[10] Bordoloi, M., Biswas, S.K. (2023). Sentiment analysis: A survey on design framework, applications and future scopes. Artificial Intelligence Review, 56(11): 12505-12560. https://doi.org/10.1007/s10462-023-10442-2
[11] Mehta, P., Pandya, S. (2020). A review on sentiment analysis methodologies, practices and applications. International Journal of Science and Technology Research, 9(2): 601-609.
[12] Nasukawa, T., Yi, J. (2003). Sentiment analysis: Capturing favorability using natural language processing. In Proceedings of the 2nd International Conference on Knowledge Capture (K-CAP 2003), New York, NY, United States, pp. 70-77. https://doi.org/10.1145/945645.945658
[13] Tan, K.L., Lee, C.P., Lim, K.M. (2023). A survey of sentiment analysis: Approaches, datasets, and future research. Applied Sciences, 13(7): 4550. https://doi.org/10.3390/app13074550
[14] Juliane, C. (2021). Implementation of naive bayes algorithm on sentiment analysis application. In Proceedings of the 2nd International Seminar on Science and Application Technology (ISSAT 2021), France, pp. 193-200. https://doi.org/10.2991/aer.k.211106.030
[15] Maharani, W. (2020). Sentiment analysis during Jakarta flood for emergency responses and situational awareness in disaster management using BERT. In 2020 8th International Conference on Information and Communication Technology (ICoICT 2020), Yogyakarta, Indonesia, pp. 1-5. https://doi.org/10.1109/ICoICT49345.2020.9166407
[16] Li, W., Haunert, J. H., Knechtel, J., Zhu, J., Zhu, Q., Dehbi, Y. (2023). Social media insights on public perception and sentiment during and after disasters: The European floods in 2021 as a case study. Transactions in GIS, 27(6): 1766-1793. https://doi.org/10.1111/tgis.13097
[17] Liu, B. (2015). Sentiment Analysis: Mining Opinions, Sentiments, and Emotions. Cambridge University Press.
[18] Parabhoi, L., Saha, P. (2018). Sentiment analysis of YouTube comments on Koha open source software. International Journal of Library Information Studies, 8(4): 96-102.
[19] Shevtsov, A., Oikonomidou, M., Antonakaki, D., Pratikakis, P., Ioannidis, S. (2023). What Tweets and YouTube comments have in common? Sentiment and graph analysis on data related to US elections 2020. Plos One, 18(1): e0270542. https://doi.org/10.1371/journal.pone.0270542
[20] Singh, G. (2021). Sentiment Analysis on YouTube Comments to Predict YouTube Video Like Proportions ISAC LORENTZ. Degree Project in Technology.
[21] Asghar, M.Z., Ahmad, S., Marwat, A., Kundi, F.M. (2015). Sentiment analysis on YouTube: A brief survey. arXiv preprint arXiv:1511.09142. https://doi.org/10.48550/arXiv.1511.09142
[22] Medhat, W., Hassan, A., Korashy, H. (2014). Sentiment analysis algorithms and applications: A survey. Ain Shams Engineering Journal, 5(4): 1093-1113. https://doi.org/10.1016/j.asej.2014.04.011
[23] Kesavaraj, G., Sukumaran, S. (2013). A study on classification techniques in data mining. In International Conference on Computing, Communications and Networking Technologies (ICCCNT), Tiruchengode, India, pp. 1-7. https://doi.org/10.1109/ICCCNT.2013.6726842
[24] Irmayani, D., Edi, F., Harahap, J.M., Rangkuti, R.K., Ulya, B., Watrianthos, R. (2021). Naives Bayes algorithm for Twitter sentiment analysis. In Journal of Physics, 1933(1): 012019. https://doi.org/10.1088/1742-6596/1933/1/012019
[25] Rasool, A., Tao, R., Marjan, K., Naveed, T. (2019). Twitter sentiment analysis: A case study for apparel brands. Journal of Physics, 1176(2): 022015. https://doi.org/10.1088/1742-6596/1176/2/022015
[26] Zainuddin, N., Selamat, A. (2014). Sentiment analysis using Support Vector Machine. In I4CT 2014 - 1st International Conference on Computer Communication Control Technology Proceedings, Langkawi, Malaysia, pp. 333-337. https://doi.org/10.1109/I4CT.2014.6914200
[27] Al Amrani, Y., Lazaar, M., El Kadirp, K.E. (2018). Random forest and support vector machine based hybrid approach to sentiment analysis. Procedia Computer Science, 127: 511-520. https://doi.org/10.1016/j.procs.2018.01.150
[28] Gangwar, A., Mehta, T. (2022). Sentiment analysis of political tweets for Israel using machine learning. In International Conference on Machine Learning and Big Data Analytics, India, pp. 191-201. https://doi.org/10.1007/978-3-031-15175-0_15
[29] Bhagat, C., Mane, D. (2019). Survey on text categorization using sentiment analysis. International Journal of Science and Technology Research, 8(8): 1189-1195.
[30] Almaiah, M.A., Almomani, O., Alsaaidah, A., Al-Otaibi, S., Bani-Hani, N., Hwaitat, A.K.A., Aldhyani, T.H. (2022). Performance investigation of principal component analysis for intrusion detection system using different support vector machine kernels. Electronics, 11(21): 3571. https://doi.org/10.3390/electronics11213571
[31] Gaye, B., Wulamu, A. (2019). Sentiment analysis of text classification algorithms using confusion matrix. In Cyberspace Data and Intelligence, and Cyber-Living, Syndrome, and Health: International 2019 Cyberspace Congress, CyberDI and CyberLife, Beijing, China, pp. 231-241. https://doi.org/10.1007/978-981-15-1922-2_16
[32] Bello, A., Ng, S.C., Leung, M.F. (2023). A BERT framework to sentiment analysis of tweets. Sensors, 23(1): 506. https://doi.org/10.3390/s23010506
[33] Tripathy, A., Agrawal, A., Rath, S.K. (2015). Classification of sentimental reviews using machine learning techniques. Procedia Computer Science, 57: 821-829. https://doi.org/10.1016/j.procs.2015.07.523
[34] Rajkumar, N., Subashini, T.S., Rajan, K., Ramalingam, V. (2020). Tamil stopword removal based on term frequency. In Data Engineering and Communication Technology: Proceedings of 3rd ICDECT-2K19, Singapore, pp. 21-30. https://doi.org/10.1007/978-981-15-1097-7_3
[35] Bamane, R., Raul, M., Vadkar, A. (2020). Classification of YouTube data based on opinion mining. International Research Journal of Engineering and Technology, 7(5): 4574-4577.
[36] Khan, A.U.R., Khan, M., Khan, M.B. (2016). Naïve multi-label classification of YouTube comments using comparative opinion mining. Procedia Computer Science, 82: 57-64. https://doi.org/10.1016/j.procs.2016.04.009
[37] Bhuiyan, H., Ara, J., Bardhan, R., Islam, M.R. (2017). Retrieving YouTube video by sentiment analysis on user comment. In Proceedings of the 2017 IEEE International Conference on Signal and Image Processing Applications (ICSIPA 2017), Kuching, Malaysia, pp. 474-478. https://doi.org/10.1109/ICSIPA.2017.8120658
[38] Barzenji, H.S.A. (2021). Sentiment analysis of Twitter posts using machine learning algorithms. Academic Platform Journal of Engineering Sciences, New Delhi, India, pp. 980-983. https://doi.org/10.21541/apjes.939338
[39] Kavitha, K.M., Shetty, A., Abreo, B., D’Souza, A., Kondana, A. (2020). Analysis and classification of user comments on YouTube videos. Procedia Computer Science, 177: 593-598. https://doi.org/10.1016/j.procs.2020.10.084
[40] Tanesab, F.I., Sembiring, I., Purnomo, H.D. (2017). Sentiment analysis model based on YouTube comment using support vector machine. International Journal of Computer Science and Software Engineering, 6(8): 180-185.
[41] Prihatini, P., Indah, K., Sukerti, G., Indrayana, I., Sudiartha, I. (2023). Feature extraction performance on classified methods for text sentiment analysis. In Proceedings of the 4th International Conference on Applied Science and Technology on Engineering Science (iCAST-ES 2021), Indonesia, pp. 1235-1243. https://doi.org/10.5220/0010962900003260
[42] Pham, B.T., Prakash, I., Jaafari, A., Bui, D.T. (2018). Spatial prediction of rainfall-induced landslides using aggregating one-dependence estimators classifier. Journal of the Indian Society of Remote Sensing, 46(9): 1457-1470. https://doi.org/10.1007/s12524-018-0791-1
[43] Wang, S., Manning, C. D. (2012). Baselines and bigrams: Simple, good sentiment and topic classification. In 50th Annual Meeting of the Association for Computational Linguistics (ACL 2012) - Proceedings of the Conference, Jeju, Republic of Korea, pp. 90-94.
[44] Quadri, M.H.S., Selvakumar, D.R.K. (2020). Performance of Naïve Bayes in sentiment analysis of user reviews online. International Journal of Innovative Technology and Exploratory Engineering, 10(2): 64-68. https://doi.org/10.35940/ijitee.a8198.1210220
[45] Cunha, V.C., Magoni, D., Inácio, P.R., Freire, M.M. (2022). Impact of self C parameter on SVM-based classification of encrypted multimedia peer-to-peer traffic. In International Conference on Advanced Information Networking and Applications, Sydney, NSW, Australia, pp. 180-193. https://doi.org/10.1007/978-3-030-99584-3_16
[46] Deng, S., Sinha, A.P., Zhao, H. (2017). Resolving ambiguity in sentiment classification: The role of dependency features. ACM Transactions on Management Information Systems (TMIS), 8(2-3): 1-13. https://doi.org/10.1145/3046684
[47] Mountassir, A., Benbrahim, H., Berrada, I. (2012). An empirical study to address the problem of unbalanced data sets in sentiment classification. In Proceedings of the IEEE International Conference on Systems, Man, and Cybernetics, Seoul, Korea (South), pp. 3298-3303. https://doi.org/10.1109/ICSMC.2012.6378300
[48] Ginicola, J.M., Smith, C., Filmore, C. (2017). Glossary of terms. In Inspiring Conversations with Women Professors, pp. 349-354. https://doi.org/10.1016/B978-0-12-812346-1.00016-0
[49] Hastie, T., Tibshirani, R., Friedman, J., Hastie, T., Tibshirani, R., Friedman, J. (2009). High-dimensional problems: p N. The Elements of Statistical Learning: Data Mining, Inference, and Prediction, 27(2): 649-698. https://doi.org/10.1007/978-0-387-84858-7_18
[50] Yulietha, I.M., Faraby, S.A., Adiwijaya, Widyaningtyas, W.C. (2018). An implementation of support vector machine on sentiment classification of movie reviews. Journal of Physics: Conference Series, 971(1): 012056. https://doi.org/10.1088/1742-6596/971/1/012056