Bain Khusnul Khotimah* | Devie Rosa Anamisa | Yeni Kustiyahningsih | Anggi Nor Fauziah | Eko Setiawan
© 2024 The authors. This article is published by IIETA and is licensed under the CC BY 4.0 license (http://creativecommons.org/licenses/by/4.0/).
OPEN ACCESS
The vitality of small and medium enterprises (SMEs) is integral to the economic fortification of nations, necessitating refined enhancement mechanisms from governmental bodies. Distinctive in their developmental trajectory, SMEs present a unique challenge in prioritizing interventions. A Decision Support System (DSS), employing a hybridized methodology of Clustering and Analytic Hierarchy Process-Technique for Order Preference by Similarity to Ideal Solution (AHP-TOPSIS), is proposed to facilitate the stratification of SMEs and guide governmental action based on a hierarchical scale of priorities. In this study, K-Means clustering was adopted for the segmentation of SMEs, leveraging its capability to efficiently partition high-dimensional data with minimal error. Subsequently, the TOPSIS method was utilized to rank SMEs within each cluster. However, the critical step of computing criteria weights to ascertain their relative importance was achieved through the AHP method. The latter effectively addresses multivariate considerations encompassing both quantitative and qualitative criteria through pairwise comparison matrices. The research incorporated 11 attributes, encompassing essential characteristics intrinsic to business entities, such as business name, location, operational status, sector, tax identification number, workforce size, average revenue, production costs, operational challenges, credit accessibility, and external financing needs. The clustering process, executed via Self-Organizing Maps (SOM), yielded optimal clusters at 1000 epochs, evidenced by a Davies Bouldin Index (DBI) of 0.74785, translating to an accuracy of 91.2601%. Notably, the SOM's performance in clustering SME data surpassed that of K-Means, as demonstrated by superior results in both Sum of Squared Error (SSE) and DBI metrics, thus showcasing its proficiency in managing data with heterogeneous criteria. The methodology engenders an n-cluster output, from which members are earmarked for priority ranking. AHP-derived weights are calculated, with a Consistency Ratio (CR) exceeding 0 denoting consistency, thereby determining the significance of each SME. TOPSIS calculations then ascribe the final score, delineating the SMEs' standings. This integrated DSS framework presents a robust tool for policymakers, ensuring targeted and efficient allocation of resources towards the advancement of SMEs.
decision support system, recommendation, SME, clustering method, AHP-TOPSIS
Small and medium enterprises (SMEs) are widely acknowledged as the bedrock of technological innovation and change [1]. In the Indonesian context, SMEs account for a substantial 67% of total corporate entities; however, their engagement in innovation is not yet commensurate with their numerical strength, necessitating an impetus to bolster their competitiveness on a global scale [2]. Governmental development policies have also been implicated as a driving force behind this push [3]. Research has illuminated the synergistic effects of product, process, marketing, and organizational innovation on company performance; notably, these effects are contingent upon the industry classification and inherent similarities within each category.
Notwithstanding their significant potential, a plethora of SMEs encounter obstacles in business development, including but not limited to product innovation, marketing strategies, and intensifying competition. Consequently, there is a pressing need for strategic interventions to cultivate and sustain superior SME offerings capable of competing effectively [4]. Discrepancies between the collected data and the actual SME landscape have been noted, indicating a suboptimal data acquisition process, which results in information gaps [5]. Current SME categorization practices are predominantly manual, leading to inefficiencies and potential inaccuracies.
The adoption of a systematic clustering method is posited as a requisite for addressing these challenges. The strategic use of clustering is proposed to foster social capital, enhance the intrinsic capabilities of SMEs, and yield positive regional impacts, all while equipping SMEs to navigate the dynamic challenges posed by external entities [6]. Clustering, a subset of Machine Learning (ML), is leveraged to categorize SMEs into distinct echelons, thereby facilitating an elevation in competitive edge [7]. Diverse cluster formation methodologies exist, each yielding different cluster models, including but not limited to hierarchies [8], centroids (e.g., K-Means [5]), distribution-based methods such as expectation maximization [6], density-based approaches [9, 10], subspace, group, and graph-based models [11]. This classification not only aids policymakers, notably governments and relevant institutions, in identifying the characteristic features and requirements of SMEs but also underscores the essence of data mining concepts in deriving such pivotal information [12].
Incorporation of the halal label on SME products, notably food items, is recognized as essential for upholding consumer rights to informed choice and consumption. Transparent labeling not only signifies the business operators' commitment to consumer rights but also assures health guarantees and psychological satisfaction associated with consumption practices [13]. SMEs, as producers, bear the responsibility of contributing to a salubrious business environment and bolstering the national economy.
K-Means, an established algorithm within the domain of unsupervised learning, is distinguished from classification algorithms by the absence of a target variable [14]. This venerable clustering algorithm has been extensively deployed in the analysis of SME characteristics. Investigations employing the K-Means algorithm have traditionally categorized SMEs into three generalized tiers. A notable study utilized this algorithm to classify cooperatives in West Java, stratifying them based on capital ownership, external capital, and business volume into distinct clusters: high, medium, and low [15].
The K-Means algorithm operates by minimizing a cost function, which measures the Euclidean distance between numerical data points. However, the algorithm faces limitations when applied to categorical data due to the non-quantitative nature of such values. Transformations and normalizations are prerequisites to enable the processing of categorical data within ML frameworks [16]. Moreover, overfitting emerges as a challenge when the data fail to encapsulate the full scope of the underlying model, a situation exacerbated in the context of Mult categorical data sets. The K-Means algorithm's adaptability to data samples is dictated by the selection of an optimal number of clusters, a decision often informed by the epoch value-a parameter delineating the frequency of the learning process [17, 18]. The utility of unsupervised learning, and by extension cluster analysis, is increasingly recognized in diverse fields for its capacity to handle unlabeled data sets, thereby economizing on manual labor and time [19].
In the pursuit of refining ranking methodologies, the integration of the Analytic Hierarchy Process (AHP) with the Technique for Order Preference by Similarity to Ideal Solution (TOPSIS) has been examined. Research has shown that this combined AHP-TOPSIS method yields an accuracy of 85.86% in the validation of ranking outcomes for students who have passed and those who have erroneously carried out the validity test [19]. The sensitivity of the TOPSIS method is reported to surpass that of the Simple Additive Weighting (SAW) method in the context of output ranking [20]. AHP contributes to this integrated approach by facilitating the determination of priorities through pairwise comparison analysis, thereby ensuring consistent values across various criteria.
The present study extends this integrated approach by applying the AHP-TOPSIS method to small and medium enterprises (SMEs). The aim is to offer recommendations for SME enhancement, utilizing data on a wide array of factors including halal certification completeness, SNI certification, brand rights, product packaging, turnover, assets, production volume, demand, sales, and employee numbers [21]. Weighted importance is assigned to each datum influencing recommendations for the most productive SMEs, thereby distinguishing impactful SMEs within Indonesia's diverse landscape. Clustering via the K-Means algorithm is employed to discern the characteristic tendencies of SMEs, which serves to provide targeted alternative recommendations. The AHP method is instrumental in ascertaining the weight of criteria established by Indonesian provincial government representatives, promoting consistent prioritization and minimizing subjectivity. Conversely, TOPSIS is utilized to rank SMEs in need of development within each cluster, by optimizing solutions based on their proximity to ideal positive and negative benchmarks [22, 23].
This investigation will delineate criteria pivotal in identifying the most suitable alternatives for SME prioritization towards halal standards. Five criteria are scrutinized for their influence on SME prioritization: standards compliance, workforce size, initial capital, production volume, and turnover. The recommendations generated from this study aim to bolster public confidence in the competitive capability of SMEs against established market entities. Additionally, the clustering system charts the general condition of SMEs in Madura, facilitating the simplification of priority determinations. Governmental decisions derived from this analysis are expected to inform policy directions, fostering support and assistance for the most promising SMEs.
2.1 K-Means clustering
The fundamental clustering technique employs a leveraged approach by calculating the Euclidean distance between every pair of samples in the sample set matrix D, resulting in the distance matrix M. The first cluster center is the corresponding sample, and the maximum value is chosen based on the value distance (Ci = 1, 2, ..., i). The sample located the furthest from the first cluster center is selected as the subsequent initial cluster center. The comparison of the distances of each unselected sample and the first cluster center, with the most significantly separated from the two previously determined samples. Finally, until the number of clustering centers at the beginning matches the value of k ascertained [8].
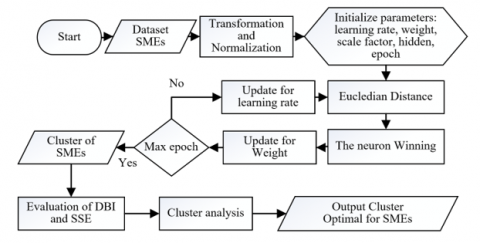
Based on several related studies that have been described, the primary researchs used as a reference in this research are literatures [7, 10, 13]. The research [8] compared two clustering methods, K-Means and SOM, where the K-Means clustering method had lower accuracy than the SOM method. This research uses the SOM method with different data [24]; SME data is used in Madura. The algorithm step diagram is shown in the Figure 1.
Then, literatures [9, 10] evaluated the cluster results by assessing the Davies Bouldin Index (DBI) to get the optimal cluster on family welfare data. The clustering process is carried out by combining 3 clusters, learning rate, and epoch values to determine the results of the DBI value in determining optimal cluster results [7]. The usage of K-Means with Automatic Clustering using Differential Evolution (ACDE) for grouping SME innovation processes produces three optimal clusters. The usage SOM clustering on the grouping of potato chip SMEs is formed into 2 clusters: cluster 1 is a micro-scale, and cluster 2 is a small scale [4].
Figure 1. Flow diagram of SOM algorithm
K-Means includes an algorithm for simple clustering and can group data according to similarities between data [25]. The steps for calculating the K-Means method are as follows [15].
(1) Determine the number of clusters (k) as a dynamic value for grouping similarity data. A rule of thumb approach based on n overall data that can follow Eq. (1):
k=√n2 (1)
(2) Determine the initial centroid value (initial cluster center point). To determine the initial centroid value, generally use the random method or take values randomly.
(3) Calculate the distance of each data with the centroid. Euclidean Distance is used to calculate the distance for each data using Eq. (2):
DJ=√∑ni(xi−yi)2 (2)
(4) Grouping data based on the nearest cluster after going through the distance calculation process. It is necessary to pay attention to the cluster that has the closest distance to the data or centroid, then group the data according to the cluster.
The data has been grouped according to clusters, then calculate the centroid of the new cluster by calculating the average of the total data values in the new cluster. To get a new centroid value, use Eq. (3).
Ci=∑ni=1xi∈Sin (3)
Repeat the third and fourth stages. The last step compares the new cluster obtained with the initial group; if there are still changes or the new cluster centroid is not the same as the initial cluster, iterates again, starting from determining the new cluster centroid. If they are the same, then the clustering process is complete.
2.2 Analytical hierarchy process
AHP is a Multi-Criteria Decision Making (MCDM) method introduced by Thomas L. Saaty in the 1970s. The AHP method is commonly used because it can determine the importance of many criteria by conducting a pairwise comparison analysis on each measure. In addition, AHP also considers the validity of the requirements and alternatives chosen by the decision maker to the tolerance limit to prevent inconsistent results. The following stages in the AHP method include [20]:
(1) Create a hierarchical structure starting from the goal to be achieved, followed by the criteria and alternatives you want to rank.
(2) Create a pairwise comparison matrix (Pairwise Comparisons).
(3) This comparison matrix describes the relative contribution or influence of each element on each objective or criterion level above it.
(4) Normalization of the pairwise comparison matrix. After compiling the criteria matrix values, the next step is to calculate the matrix normalization values by dividing the value of each cell by the number of each column with Eq. (4).
Xij=kij∑ni=1kij (4)
where, the comparison value of Ki to Kj is kij. The value of k is determined by the rule:
• If kij = x, then kji = 1x and the value x ≠ 0 .
• Certain treatment occurs at kii = 1, applies to all i.
Pairwise comparisons were performed for the scoring criteria. The importance level scale value in the pairwise comparison matrix can be seen in Table 1 [21].
Table 1. AHP importance scale value
|
Importance Intensity |
Information |
|
1 |
Ki as important as Kj |
|
2 |
Ki approaching slightly more important than Kj |
|
3 |
Ki little more important than Kj |
|
4 |
Ki aproaching is more important than Kj |
|
5 |
Ki more important than Kj |
|
6 |
Ki approaching very important of Kj |
|
7 |
Ki very important of Kj |
|
8 |
Ki mendekati mutlak dari Kj |
|
9 |
Ki absolutely very important of Kj |
|
Opposite |
If the variable Ki gets one number and is compared to the variable Kj , then the variable Kj has the opposite value when compared to the variable Ki . |
(5) Calculate the value of the priority weight (priority vector), then do a consistency test. If it is not consistent, taking the importance value must be repeated. Calculating priority weight values with Eq. (5).
PVi=∑nj=1Xijn (5)
(6) Calculate the eigenvector values of each pairwise comparison matrix by multiplying the pairwise comparison matrices by the priority criteria weight value for each row with Eq. (6).
EVij=(kij×PVji) (6)
(7) The AHP method is used to measure consistency based on the consistency ratio. The consistency test must be carried out in a decision to determine whether the value of importance given to each criterion has reached a consistent weight. The steps for calculating the consistency value are as follows:
(a) The results of the consistency test obtain a value by calculating the average value in the CM column using Eq. (7).
CMi=∑i=1(EVij)PVi (7)
(b) The results of the consistency test obtain a value by calculating the average value in the CM column using Eq. (8).
λmax (8)
(8) The Consistency Index (CI) value is calculated using Eq. (9).
C I=\frac{(\lambda \max -n)}{(n-1)} (9)
(9) Evaluation of consistency in pairwise comparisons is done by calculating the CR using Eq. (10).
C R=\frac{C I}{R I} (10)
The Ratio Index (RI) has been determined based on the matrix order or the number of criteria in the AHP method shown in Nilai RI.
Table 2. RI value
|
Ordo Matriks |
RI |
Ordo Matriks |
RI |
Ordo Matriks |
RI |
|
1 |
0 |
6 |
1,24 |
11 |
1,51 |
|
2 |
0 |
7 |
1,32 |
12 |
1,48 |
|
3 |
0,58 |
8 |
1,41 |
13 |
1,56 |
|
4 |
0,90 |
9 |
1,46 |
14 |
1,57 |
|
5 |
1,12 |
10 |
1,49 |
15 |
1,59 |
In Table 2, if CR≤0.1, the determined pairwise comparison value has reached a consistent deal because the error tolerance is 10%. Suppose CR>0.1, a pairwise comparison matrix is reassessed to obtain consistent results [22].
2.3 Technique for order preference by similarity to ideal solution
Yoon and Hwang presented the TOPSIS in 1981. The TOPSIS technique is a type of Multi-Criteria Decision Making (MCDM) approach that operates under the tenet that the optimal answer is the closest to the positive ideal solution and the furthest from the negative perfect solution [21]. AHP, ELECTRE III, PROMETHEE II, Gray Relational Analysis, Fuzzy TOPSIS, MOORA, WASPAS, VIKOR, and Fuzzy Analytical Hierarchy Process (FAHP) are some of the MCDM methodologies that are used as decision support systems. A clear rating of other options is provided by decision-making, which also handles a variety of criteria and alternatives, their benefits and drawbacks, and management constraints for complex data, including subjective assessment [26].
The usage of TOPSIS method has solved recommendations for SMEs that deserve coaching to help recommend alternatives by compiling all options for each cluster and calculating to get the highest preference value to obtain a ranking of alternative recommendations in each cluster, especially in recent years in the Asia Pacific region. The TOPSIS method can help calculate data as weight suitability of alternative approaches that will produce the best assessment, compute very efficiently, and measure relative performance levels and decision alternatives made in simple mathematics [22, 23].
The approach (FAHP-TOPSIS) has been utilized to prioritize impediments and methods for adopting manufacturing SMEs while giving strategic insights to guide decision-makers and practitioners of Indian manufacturing SMEs in implementing sustainable manufacturing. Furthermore, this study assists managers by offering a list of hierarchies' ranking systems based on their effectiveness, removing implementation constraints [27]. Figure 2 depicts the flow of the TOPSIS approach.
Many conflicting qualitative and quantitative criteria play a role in the success of high-tech SMEs. To overcome this problem, it is necessary to integrate the Analytic Hierarchy Process (AHP) considering the weight of the calculated criteria, which can increase the critical success factor (CSF) to be determined to produce a ranking used for recommendations [28].
Figure 2. Process diagram of the TOPSIS method
This measurement defines the best number of k clusters based on SSE and DBI for analysis based on the clustering outcomes evaluation index and the objective function of the clustering process. Combining two direct evaluation indicators can limit the number of times the clustering results fall into the optimal local solution. Before calculating ck, each cluster number's SSE and DBI values are computed [10], and the usage for the accuracy of the combined AHP and TOPSIS ranking results.
3.1 DBI
DBI is an evaluation method when the data has been formed into clusters to evaluate the cluster results quantitatively. DBI describes the quality of clustering based on the spread level across clusters and the closeness of data objects within the same group [14]. The DBI idea is to maximize the distance between clusters while minimizing the distance between points inside the cluster. When the inter-cluster distance is maximum, it signifies that the similarities of each cluster are slightly similar, allowi ng the distinctions between clusters to be easily noticed. If the intra-cluster distance is small, each object in the cluster is quite similar. The best clustering results have a sizeable inter-cluster distance and a small intra-cluster distance.
(1) The sum of squares within a cluster (SSW) was calculated to use the SSW value Eq. (11).
S S W_i=\frac{1}{m_i} \sum_{j=i}^{m_i} d\left(x_j-c_i\right) (11)
(2) Sum of Square Between-cluster (SSB)
Calculating the SSB value to be able to find out the cluster separation, using Eq. (12).
S S B_{i, j}=d\left(c_i-c_j\right) (12)
(3) Ratio (Rasio)
Calculate the ratio value to be able to find out the comparative value between the i-th and j-th clusters, using Eq. (13).
R_{i, j}=\frac{S S W_i+S S W_j}{S S B_{i, j}} (13)
(4) DBI
The ratio value from Ri,j will be used to calculate the DBI value using Eq. (14).
D B I=\frac{1}{k} \sum_{i=1}^k \max _{i \neq j}\left(R_{i, j}\right) (14)
(5) The lower the DBI value obtained (non-negative), the better the cluster obtained from the grouping. Similar to error, the smaller the DBI value, the better the clustering results [15, 17].
Selecting the optimal number of k clusters can use the Sum of Square Error method, which is a way to measure how far the data points in a cluster are from its centroid. SSE is calculated based on the sum of the squares of the distance between each data point and its cluster center [18].
S S E=\sum_{k-1}^k \sum x i \in s k\left\|x_i-c_k\right\|_2^2 (15)
where, xi = -ith feature or data attribute, and ck = Feature or attribute of the ith custer center point. The measurement accuracy TOPSIS shows how close the results of a data from system testing are to actual data, with the level of accuracy using Eq. (16) [21].
accuracy =\frac{\sum \text { test data is correct }}{\sum \text { total test data }} \times 100 \% (16)
4.1 Purpose of research
The system flow that will be carried out in the SME grouping research combines the SOM and AHP-TOPSIS mixed methods. The system flow design of the method proposed in the study is according to Figure 3.
The stages of the process in the system to be built first is the data preparation stage on the SME dataset, where this stage is carried out for data preparation, starting from transformation and normalization until the data is ready for processing. Then enter the clustering stage using the SOM method with input from the SME dataset that has undergone the data preparation process. For the optimal clustering results, a cluster evaluation is used using DBI. Then proceed to weighting the criteria for the weights used in making decisions using the AHP method. The alternative ranking stage in each cluster using the TOPSIS method. The input weight to the TOPSIS method was used the results of SME data that have gone through the clustering stage and priority weights obtained from the AHP method. The priority weights are used as criteria weighting in the TOPSIS method because the TOPSIS method does not have specific weight calculations, so the AHP method is needed to get more consistent weights.
Figure 3. System flow diagram
4.2 Clustering SME
The stage of presenting the results of the trial scenario to answer research questions, namely the first, is in the form of the effect of learning rate and epoch values on clustering results with the DBI cluster evaluation value. The second is ranking accuracy results from the clustering results of the SOM method and the combined AHP and TOPSIS methods. Test scenario one aims to obtain the optimal cluster results based on scala 0.01 of learning rate and epoch in Table 1 dan Table 2. Tests were carried out on 800 SME data used in this study; then, the cluster evaluation stage will be carried out using the DBI method to determine how optimal the cluster results obtained for each combination. The overall results of the learning rate and epoch combination experiments, along with the DBI values in test scenario 1, are summarized in Table 3 and Table 4.
Table 3. The results of SOM test
|
Number |
Epoch |
Learning Rate |
Number of Data in Cluster |
DBI SOM |
||
|
Cl |
C2 |
C3 |
||||
|
1 |
500 |
0.05 |
337 |
437 |
26 |
0.76497 |
|
2 |
0.10 |
256 |
225 |
319 |
0.86122 |
|
|
3 |
0.15 |
533 |
49 |
218 |
0.76071 |
|
|
4 |
0.20 |
256 |
319 |
225 |
0.80339 |
|
|
5 |
750 |
0.05 |
206 |
531 |
63 |
0.85879 |
|
6 |
0.10 |
404 |
63 |
333 |
0.82848 |
|
|
7 |
0.15 |
404 |
52 |
344 |
0.78488 |
|
|
8 |
0.20 |
406 |
48 |
346 |
0.77473 |
|
|
9 |
1000 |
0.05 |
256 |
102 |
442 |
074785 |
|
10 |
0.10 |
560 |
216 |
24 |
0.80289 |
|
|
11 |
0.15 |
218 |
534 |
48 |
0.86311 |
|
|
12 |
0.20 |
256 |
225 |
319 |
0.86122 |
|
Table 4. The results of the K-Means test
|
Number k |
Epoch |
Number of Data in Clusters |
DBI K-Means |
||
|
Cl |
C2 |
C3 |
|||
|
1 |
500 |
301 |
321 |
178 |
0.8950 |
|
2 |
292 |
225 |
283 |
0.7612 |
|
|
3 |
513 |
143 |
144 |
0.7807 |
|
|
4 |
287 |
319 |
194 |
0.8234 |
|
|
5 |
750 |
200 |
253 |
347 |
0.8488 |
|
6 |
234 |
163 |
403 |
0.8585 |
|
|
7 |
300 |
52 |
448 |
0.8049 |
|
|
8 |
381 |
48 |
371 |
0.8570 |
|
|
9 |
1000 |
351 |
102 |
347 |
0.7709 |
|
10 |
278 |
216 |
306 |
0.8429 |
|
|
11 |
292 |
534 |
-26 |
0.8331 |
|
|
12 |
256 |
295 |
249 |
0.8912 |
|
Table 3 displays SOM that there is a significant change in the DBI when k varies from 1 to 12. Additionally, the rate at which the DBI changes with k slows down when k > 4. K-Means experienced reduced errors in clusters 4 to 8, and the optimal number of clusters must be 4 to 6. As k increases, the DBI value rises steadily; the more significant the grouping effect, the smaller the DBI value. SOM can be seen that the most optimal cluster of each experiment is found in combination 9 with a learning rate parameter value of 0.05 and epoch 1000 and a DBI value of 0.74785 is obtained with the total distribution of data in each cluster namely cluster 1 totaling 256 data, cluster 2 destroying 102 data, and cluster 3 totaling 442 data. Otherwise, Table 4 shows K-Means produces a higher DBI than the result in SOM. K-Means depends on the value of k and the centroid update contain in 0.7709, so That requires more iterations.
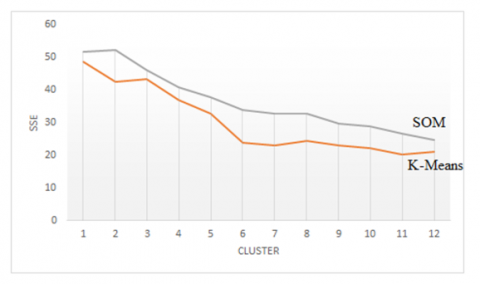
Figure 4 shows the test results based on changes in the number of clusters k, which vary from 1 to 12, based on the SSE value. The results show that in the SOM and K-Means methods, after the number of clusters reaches 4, the SSE has experienced a sharp decline, meaning that the higher the cluster value, the lower the SSE value.
The SSE value for each of the best performances is k = 12, the SOM algorithm is 1.988, and the K-Means is 1.545, both of which have experienced a decline. A comparison of the two reveals that the results of cluster analysis have more remarkable similarities within clusters and more noticeable differences between clusters.
Figure 4. Clustering performance comparison with SSE
4.3 Discussion
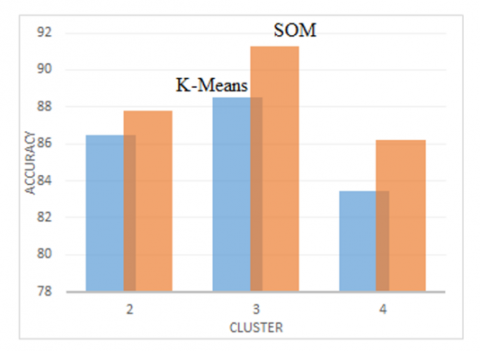
The most optimal combination among the other combinations because it produces the lowest DBI value, where the lower the DBI value, the better the clusters obtained from grouping. The test results on the selected combination are good because it has a significant epoch value, where the greater the number of epochs, the training takes a long time but will produce good enough cluster data. Still, conversely, the smaller the number of epochs, the training process requires a relatively short time but will produce cluster data that has yet to be grouped optimally. Then the smallest learning rate value is selected, where the more significant the learning rate, the faster the training process becomes unstable, and the cluster results must be better grouped. The optimal cluster results obtained are evaluated based on SSE, which is used to assess the accuracy of predictions made by the model. So, the difference between SOM and K-Means is based on cluster differences, as shown in Figure 5.
Figure 5. Accuracy value of the ranking of each cluster
Figure 5 explain experiments on clusters 1, 2, and 3 of test scenario three were carried out using different priority weights in each cluster with six criteria: the number of workers, average turnover, average production costs, type of business difficulty, getting credit, and needing external loans. These weights are obtained from the results of the consistency test on the AHP method, where the results of these weights get different CI and CR values. The details of the results of the AHP priority weights are shown in Table 5.
Experiments on clusters 1, 2, and 3 of test scenario two were carried out using the same priority weight with six criteria, namely number of workers = 0.031, average turnover = 0.38, average production costs = 0.255, type of business difficulty = 0.192, get credit = 0.08, and need external loans = 0.063. These weights were obtained from the consistency test on the AHP method, where the weight results received a CI value of 0.09 and a CR of 0.072. The usage AHP priority weight results were obtained with different CR values for each cluster originating from the questionnaire containing priority weights, as shown in Table 5. Even though different CR values were obtained, namely cluster 1 = 0.072, cluster 2 = 0.026, and cluster 3 = 0.052, all of these CR values indicate that the resulting priority weights are consistent because the CR value is ≤ 0.1 or ≤ 10%. The process of ranking the data by the system shows the results with the highest preference value in each cluster are influenced by the decision value factor at the time of calculation, resulting in the data distance from the near-positive ideal solution. Therefore, the data gets a high preference value.
(1) Most of cluster 1 shown SME are with individual businesses, the business field sector in other service activities, with an average number of workers, turnover, and high production costs; all companies in this cluster cannot get credit and do not need external.
(2) Most of cluster 2 shown SME are in Sampang with UD businesses, the business field sector in trade, with an average number of workers, turnover, and moderate production costs. Companies in this cluster get credit but do not need external loans.
(3) The majority in cluster 3 of SME are in Pamekasan with individual businesses and UD, the business field sector in other service activities and food and beverage accommodation, with an average number of workers, turnover, and production costs which are relatively low, in this cluster the dominant businesses do not get credit, but all companies need outside loans.
Table 5. AHP priority weight for SOM and K-Means
|
C |
Criteria |
w |
SOM-AHP |
K-Means-AHP |
||
|
CI |
CR |
CI |
CR |
|||
|
1 |
Number of certifications |
0.031 |
0.09 |
0.072 |
0,02 |
0.05 |
|
Average turnover |
0.38 |
|||||
|
Average cost of production |
0.255 |
|||||
|
Total workforce |
0.192 |
|||||
|
Get Credit |
0.08 |
|||||
|
Requires external loans |
0.063 |
|||||
|
2 |
Number of certifications |
0.047 |
0.03 |
0.026 |
0.01 |
0.04 |
|
Average turnover |
0.27 |
|||||
|
Average cost of production |
0.356 |
|||||
|
Total workforce |
0.214 |
|||||
|
Get Credit |
0.058 |
|||||
|
Requires external loans |
0.055 |
|||||
|
3 |
Number of certifications |
0.043 |
0.06 |
0.052 |
0.07 |
0.06 |
|
Average turnover |
0.241 |
|||||
|
Average cost of production |
0.191 |
|||||
|
Total workforce |
0.341 |
|||||
|
Get Credit |
0.107 |
|||||
|
Requires external loans |
0.077 |
|||||
The choice of k influences the use of the clustering method, the parameters attached to the process, and the maximum iterations used to get better and optimal results. The higher the k value, the SSE tends to decrease. At the same time, the ranking results show that cluster 3 produces the highest accuracy in the interests of SMEs. The results of the research with detailed results for each test as follows:
(1) Clustering data using SOM, which has been carried out on 800 SMEs data in Madura, has produced an optimal cluster with a combination of the parameters of a learning rate of 0.05 and an epoch of 1000 based on the lowest DBI value of 0.74785 compared to other varieties. The learning rate values and epoch parameters affect the cluster results, where the optimal cluster is obtained, divided into three clusters with detailed data on cluster 1 totaling 256 data, cluster 2 destroying 102 data, and cluster 3 with a total of 442. The three clusters formed have the following characteristics: different characteristics.
(2) Determining priority recommendations for SME development in each cluster is done by ranking data using optimal data clusters. In comparing ranking results with the same priority weight in each cluster with a consistent Consistency Ratio (CR) value of 0.072, an accuracy of 86.33% was obtained. While comparing the best ranking results using different AHP weights in each cluster with a CR value in cluster 1 = 0.072, cluster 2 = 0.026, cluster 3 = 0.052 gets an accuracy of 93.33%.
This research still has many things that need to be improved for further research to get better and optimal results. The challenge changes greatly influence clustering results in parameters, so hyperparameters are required to produce better and optimal accuracy. Meanwhile, for Decision Support Systems using AHP criteria weighting, it depends on the expert's subjectivity regarding the current policies, so other more specific weightings are needed, for example, ANP, to produce better performance and support as required.
This research was funded by an independent grant, one of the internal programs of Madura Trunojoyo University, through Independent grant funding in research and Community Service institutions. This study collected data from the Cooperatives and SME offices in Bangkalan, Sampang, Pamekasan, and Sumenep districts. We are very grateful to various parties, Universities, and government agencies who helped make this research successful.
|
Wij(new) |
New weight |
|
Wij(old) |
Old weight |
|
α |
Learning rate |
|
α(new) |
New learning rate |
|
αold) |
Old learning rate |
|
β |
Scala Factor |
|
Xi |
Neuron input |
|
n |
the amount of data to be grouped |
|
k |
number of clusters |
|
DJ |
cluster distance |
|
xi |
cluster center data |
|
y |
The result output data |
|
i |
each data |
|
Yi |
data on each i-th data |
|
Ci |
new centroid i-th |
|
Si |
data i-th |
|
PVi |
The i-th priority weight value |
|
Xij |
Pairwise comparison matrix values |
|
n |
criteria |
|
EVij |
Eigen vector value |
|
K |
Pairwise comparison matrix values |
|
CI |
consistency index value |
|
λmax |
The average value of the consistency measure |
|
CR |
Consistency ratio value |
|
CI |
Consistency ratio value |
|
IR |
Index ratio value |
|
mi |
A lot of data in cluster i |
|
ci |
Cluster center i |
|
cj |
Cluster center j; for i ≠ j |
|
SSWij |
SSW value i-th or j-th |
|
SSBij |
SSB value i-th or j-th |
|
k |
Jumlah cluster |
[1] Hidayah, A. (2019). Implementing data clustering to identify capital allocation for small and medium sized enterprises (SMEs). ASEAN Marketing Journal, 10(1): 66-74. https://doi.org/10.21002/amj.v10i1.10627
[2] Wang, Y. (2023). Research on the evaluation of the growth level of SMEs clustering based on digitalization. In 2023 4th International Conference on Education, Knowledge and Information Management, Chengdu, China, pp. 283-291. https://doi.org/10.2991/978-94-6463-172-2_31
[3] Viloria, A., Lezama, O.B.P. (2019). Improvements for determining the number of clusters in K-Means for innovation databases in SMEs. Procedia Computer Science, 151: 1201-1206. https://doi.org/10.1016/j.procs.2019.04.172
[4] Wahdania, N.Z., Mustaniroh, S.A., Santoso, I., Purwaningsih, I. (2021). Clustering of potato chips SMEs in Batu City, Indonesia. IOP Conference Series: Earth and Environmental Science, 924(1): 012060. https://doi.org/10.1088/1755-1315/924/1/012060
[5] Anzellyta, T., Fittria, A. (2022). The effectiveness of the halal product guarantee law on business awareness in registration of halal certification in Indonesia. Walisongo Law Review (Walrev), 4(1): 97-120. https://doi.org/10.21580/walrev.2022.4.1.11272
[6] Qurniawati, R.S., Nurohman, Y.A. (2021). Performance and sustainability of halal food SMES. Journal of Finance and Islamic Banking, 4(1): 44-58. https://doi.org/10.22515/jfib.v4i1.3470
[7] Riveros, N.A.M., Espitia, B.A.C., Pico, L.E.A. (2019). Comparison between K-Means and self-organizing maps algorithms used for diagnosis spinal column patients. Informatics in Medicine Unlocked, 16: 100206. https://doi.org/10.1016/j.imu.2019.100206
[8] Vankayalapati, R., Ghutugade, K.B., Vannapuram, R., Prasanna, B.P.S. (2021). K-Means algorithm for clustering of learners performance levels using machine learning techniques. Revue d'Intelligence Artificielle, 35(1): 99-104. https://doi.org/10.18280/ria.350112
[9] Wahyudin, I., Djatna, T., Kusuma, W.A. (2016). Cluster analysis for SME risk analysis documents based on Pillar K-Means. TELKOMNIKA (Telecommunication Computing Electronics and Control), 14(2): 674-683. http://doi.org/10.12928/telkomnika.v14i2.2385
[10] Abushilah, S.F., Abbas, R.H. (2023). Performance evaluation of some clustering algorithms under different validity indices. Mathematical Modelling of Engineering Problems, 10(4): 1271-1280. https://doi.org/10.18280/mmep.100420
[11] Muslih, Erlando, A. (2019). SME competitiveness cluster analysis in east Java. Journal of Developing Economies, 4(2): 72-81. https://doi.org/10.20473/jde.v4i2.13298
[12] Maksum, I. R., Rahayu, A.Y.S., Kusumawardhani, D., (2020). Social enterprise approach to empowering micro, Small and Medium Enterprises (SMEs) in Indonesia. Journal of Open Innovation Technology Market, and Complexity, 6(50): 1-17. https://doi.org/10.3390/joitmc6030050
[13] Khasanah, A.U. (2016). A comparison study: clustering using self-organizing map and K-Means algorithm. Performa: Media Ilmiah Teknik Industri, 15(1): 51-58. https://doi.org/10.20961/performa.15.1.13754
[14] Daniati, E., Utama, H. (2019). Clustering K means for criteria weighting with improvement result of alternative decisions using SAW and TOPSIS. In 2019 4th International Conference on Information Technology, Information Systems and Electrical Engineering (ICITISEE), Yogyakarta, Indonesia, pp. 73-78. https://doi.org/10.1109/ICITISEE48480.2019.9003858
[15] Kasri, M.A., Jati, H. (2020). Combination of K-Means and simple additive weighting in deciding locations and strategies of university marketing. Khazanah Informatika: Jurnal Ilmu Komputer dan Informatika, 6(2): 132-141. https://doi.org/10.23917/khif.v6i2.11281
[16] Phaladisailoed, T., Numnonda, T. (2018). Machine learning models comparison for bitcoin price prediction. In 2018 10th International Conference on Information Technology and Electrical Engineering (ICITEE), Bali, Indonesia, pp. 506-511. https://doi.org/10.1109/ICITEED.2018.8534911
[17] Wella, Y. E., Okfalisa, O., Insani, F., Saeed, F. (2023). Service quality dealer identification: The optimization of K-Means clustering. SINERGI, 27(3): 433-442. https://doi.org/10.22441/sinergi.2023.3.014
[18] Raharja, M.A., Surya, I.K.A. (2022). Clustering customer for determine market strategy using K-Means and TOPSIS: Case study. In Proceeding International Conference on Information Technology, Multimedia, Architecture, Design, and E-Business, pp. 61-71.
[19] Wang, F., Franco-Penya, H.H., Kelleher, J.D., Pugh, J., Ross, R. (2017). An analysis of the application of simplified silhouette to the evaluation of K-Means clustering validity. In Machine Learning and Data Mining in Pattern Recognition: 13th International Conference, New York, USA, pp. 291-305. https://doi.org/10.1007/978-3-319-62416-7_21
[20] Hillerman, T., Souza, J.C.F., Reis, A.C.B., Carvalho, R.N. (2017). Applying clustering and AHP methods for evaluating suspect healthcare claims. Journal of Computational Science, 19: 97-111. https://doi.org/10.1016/j.jocs.2017.02.007
[21] Özcan, E.C., Ünlüsoy, S., Eren, T. (2017). A combined goal programming–AHP approach supported with TOPSIS for maintenance strategy selection in hydroelectric power plants. Renewable and Sustainable Energy Reviews, 78: 1410-1423. https://doi.org/10.1016/j.rser.2017.04.039
[22] do Nascimento, G.B., dos Santos, M. (2022). Performance evaluation of machine learning algorithms for network anomaly detection: An approach through the AHP-TOPSIS-2N method. Procedia Computer Science, 214: 164-171. https://doi.org/10.1016/j.procs.2022.11.162
[23] Collan, M., Fedrizzi, M., Luukka, P. (2013). A multi-expert system for ranking patents: An approach based on fuzzy pay-off distributions and a TOPSIS–AHP framework. Expert Systems with Applications, 40(12): 4749-4759. https://doi.org/10.1016/j.eswa.2013.02.012
[24] Komatsu, H., Kimura, O. (2019). A combination of SOM-based operating time estimation and simplified disaggregation for SME buildings using hourly energy consumption data. Energy and Buildings, 201: 118-133. https://doi.org/10.1016/j.enbuild.2019.07.036
[25] Bu, Y., Liu, S. (2023). Customer value evaluation model for smes based on K-Means clustering algorithm. In Proceedings of the 2023 6th International Conference on Software Engineering and Information Management, Palmerston, North New Zealand, pp. 165-170. https://doi.org/10.1145/3584871.3584895
[26] Taherdoost, H., Madanchian, M. (2023). Multi-Criteria Decision Making (MCDM) Methods and Concepts. Encyclopedia, 3: 77–87. https://doi.org/10.3390/encyclopedia3010006
[27] Abdullah, A., Saraswat, S., Talib, F. (2023). Barriers and strategies for sustainable manufacturing implementation in SMEs: A hybrid fuzzy AHP-TOPSIS framework. Sustainable Manufacturing and Service Economics, 2: 100012. https://doi.org/10.1016/j.smse.2023.100012
[28] Sekhar, C., Patwardhan, M., Vyas, V. (2015). A Delphi-AHP-TOPSIS based framework for the prioritization of intellectual capital indicators: A SMEs perspective. Procedia-Social and Behavioral Sciences, 189: 275-284. https://doi.org/10.1016/j.sbspro.2015.03.223