Raziya Begum*![]() | Thummala Pavan Kumar
| Thummala Pavan Kumar![]() | Manda Rama Narasinga Rao
| Manda Rama Narasinga Rao![]()
© 2023 IIETA. This article is published by IIETA and is licensed under the CC BY 4.0 license (http://creativecommons.org/licenses/by/4.0/).
OPEN ACCESS
Parkinson’s Disease (PD) is a progressive neurological disorder that develops through several stages, including suggestive symptoms, stage 1, stage 2, and stage 3. Identifying the severity of PD and predicting its progression can be challenging due to the limitations of medical settings. Consequently, there is a need for novel techniques to facilitate early-stage classification of PD, potentially addressing the financial and time constraints associated with determining disease stages. Recent research has focused on employing supervised and unsupervised machine learning algorithms for the reliable diagnosis of PD, stage identification, and trajectory prediction using clinical and preclinical data. The diagnosis of PD may be improved by incorporating various techniques, including deep learning and machine learning approaches. This study proposes a Deep Convolutional Neural Networks (DCNN) approach based on MRI data to enhance the accuracy of PD classification. The paper presents several key contributions. Initially, a DCNN model was developed to classify Parkinson’s Disease. Subsequently, the main objective was to identify the network topology that yielded optimal accuracy and recall. To achieve this, various network structures were examined, and several topological variants were determined. The proposed model was trained using features from the Parkinson's Progression Markers Initiative (PPMI) database, achieving an accuracy of 95% for the PPMI data. The results obtained through applying the proposed model on the PPMI datasets demonstrate its superior performance compared to traditional methods.
Parkinson’s Disease, magnetic resonance imaging, deep convolutional neural network, classification, ensemble classifier, image acquisition, feature extraction
Parkinson's vascular dementia is a frequent neurological illness in the world's older population (PD). In Parkinson’s Disease, a neurotransmitter known as dopamine acts as a messenger between neurons. The brain's nerve cells that produce pathways in the brain are responsible for its generation in the body. Muscle rigidity, tremor, and a lack of coordination and balance are common symptoms of Parkinson’s Disease [1]. As the population in the world increases, the demand for early detection methods for PD is imperative as this is the second largest neurological disorder prevalent in the country. The most frequently performed diagnostic technique in the initial phases of Parkinson’s Disease is a brain MRI scan.
Stages of Parkinson’s Disease
A patient with Parkinson's will have different effects, and not every day every patient experience all the signs of PD. If the patient suffers from PD, not all symptoms of PD may or may not occur in the same order of magnitude. PD has a pattern that can be divided into different stages.
First stage
In this phase, there will be minor symptoms the patient can experience in their routine. One side of the body experience tremor, and the signs of posture, movement, and facial expression may change.
Second stage
The signs/indications in this phase are affected by tremors, stiffness, and gestures abnormalities. Walking and postures differ from regular and routine duties and can be difficult at this stage.
Third stage
Loss of balance and inactive movements are the symptoms of this stage. Mishaps are somewhat although they are independent. However, symptoms like dressing and eating can be difficult in this stage. However, assessing symptoms solely through behavioral assessments may be deceptive because the disease manifests differently in different patients. As stated above about various stages of PD, anatomical information about the brain's subcortical structures is obtained by MRI scans. This information is used to look for aneurysms, which can aid in the early detection of many diseases. Regarding sub-cortical structures, the human eye cannot see all the intricate details and different qualities because the MRI is three-dimensional [2]. MRI scans, which use Magnetic Resonance Imaging technology, might be requested by doctors as part of a diagnostic procedure. A magnetic field and non-invasive radio waves are used to study bodily tissues in MRI scans, and the results can be pretty exact and detailed. It is possible to distinguish between different types of PD and distinct parkinsonian illnesses using MRI scans of human brains [3]. It is estimated that diagnostic accuracy for PD was only 80.6% during the previous three decades [4]. Models have been considerably proven to be helpful in the diagnosis of brain disorders such as PD with current advances in machine learning. The effectiveness of classifying the disease can be enhanced by using various methodologies. The application of DL is growing enormously because of its success in different domains like object detection, image recognition, voice recognition, etc., and many other domains. Patients' scores or symptoms-based assessments [5] and other biomarkers have also been employed in several studies. For those in less developed nations, having an MRI scan to learn more about a patient's health is difficult or impossible because of the high cost and limited availability. There are other relevant measures, including symptom-based data assessments. Contrary to cancer or bone injuries, which specialist clinicians may recognize by using scanned images, there are no apparent visual discrepancies in PD MRI scans. Only two investigations [6] included patient assessments in their MRI data analyses, and each used only one patient assessment score. This research will assess the accuracy and efficiency of various machine-learning algorithms to classify images. Then, you must give all the information about machine learning techniques used to identify Parkinson’s Disease and show how each technique works. The following paragraphs give the importance of the usage of MRI images in the identification of PD.
1. MRI scans provide detailed anatomical information on the brain's subcortical structures, which can be utilized to detect aneurysms early in the course of various disorders. Because the MRI is three-dimensional, the human eye cannot see all the fine features and varied characteristics of sub-cortical structures [2].
2. Because the condition manifests differently in each patient, relying exclusively on behavioral measures may be misleading. Doctors often recommend an MRI scan using magnetic resonance imaging technologies as part of a diagnostic process. MRI scans employ a magnetic field and non-invasive radio waves to examine the body's tissues, and the results can be exact and detailed.
3. MRI scans of the human brain are essential to identify different kinds of Parkinson’s Disease [3].
4. Various methods have been studied to diagnose PD and its effect on patients using Models combining machine learning and deep learning [7]. In these models, neural networks such as CNN and SVM are utilized to process the data from MRI scans. Chakraborty et al. [8] conducted a study on this in 2020 using 3D CNNs. Similar studies have been done based on patient scores, symptoms-based assessments [5], and other biomarkers. ML methods are the main focus of this study. Current Deep Learning-based algorithms for detecting Parkinson's and schizophrenia diseases use MRI data from many sources, including the operational and anatomical side. Researchers have discovered that using new and inventive pre-processing techniques on MRI pictures improves the quality of images free from noise (extraction of features, feature selection, and classification). There has been some success with other machine learning models in diagnosing the disease [7]. The CNN and the SVM models are used in these studies to analyze MRI data. A study by Chakraborty et al. [8] in 2020looked into 3-dimensional (3D) CNNs. It is difficult or impossible for people in less developed countries to get an MRI scan to learn more about their health because of the technology's high cost and limited availability. Symptom-based data assessments are another critical measure (National Institute on Aging). A trained eye can only discern the visual differences between PD MRI scans and cancer or bone damage. Various machine learning methods have been tested in this study to ensure accuracy and efficiency in classifying photos. Many different machine learning approaches are used to identify PD, and these strategies must be explained in detail by the following previous research study. It has been widely recognized that the results generated by deep learning techniques are better compared to classical machine learning algorithms. However, some researchers have developed methods in deep learning for the prediction or classification of neurological disorders, but more research needs to be done in this domain. There are two research questions in this work the researchers would like to propose: They are: 1) Accurate Disease classification stage using DCNN and how to find and generate the exact architecture of the network for accurate PD classification. In this work, we are concerned with improving the classification results using DCNN to enhance classification performance. There are two main aims of this proposed research. The initial is to develop a DCNN-based model for the classification of PD. Its convolution and max pooling, Dense and Rectifier linear unit layers, and additional layers constitute most of this model. The second approach is performing an experimental study to discover the DCNN model's architecture and improve network parameters like the activation function, convolutional filter size, and the number of hidden layers. The extraction of features from the dataset of the Deep CNN models would be required for the structure.
In this section, many approaches and methods for improving the model's performance of the classifier are mentioned. For better recall and accuracy, some research investigations have applied methods for feature extraction and neural networks. Little research has been done for predicting and diagnosing the severity of Parkinson’s Disease, despite the importance of understanding its progression and its numerous stages. Many studies, on the other hand, have used a wide range of machine learning techniques to try to predict Parkinson’s Disease. Different classification systems have been developed earlier to diagnose Parkinson’s Disease [9]. Later, Adams et al. [10] developed a prediction system for Parkinson’s Disease with a Deep Learning technique using the CNN model. It is observed that Neural Networks were shown to be the most effective in classifying data by far. Actually, in earlier research, speech signal features have been considered for the prediction of PD. The Bagged Decision Trees improved PD prediction accuracy by 2% for patient voice recordings. Later research was given thrust on the feature selection process for the classification of PD. Cole did this, and his team where considered 40 characteristics to classify Parkinson’s Disease patients into four groups based on their UPDRS score, and nine of these features were picked using Local Learning Based Feature Selection (Healthy, Early, Intermediate, and Advanced). The degree of tremors and dyskinesia can be detected by dynamic machine-learning approaches [11] using wearable sensor data. Later research was done on wearable devices for brain-related diseases. Research related to this type was done by Angels et al. [12], where a wearable sensor device was designed and constructed to monitor the movement of their arms during Deep Brain Simulation Therapy. Imaging techniques also have been given importance in the research related to Parkinson’s Disease. Because of the lack of contrast in soft tissues (MRI), CT is less accurate at diagnosing Parkinson’s Disease (PD) than MRI for detecting it. This imaging method accurately depicts MSA, corticobasal degeneration, and progressive supranuclear palsy. A CT scan can be employed to rule out other possible disorders, such as focal, hidden lesions, where a CT scan can be employed [13]. According to Jankovic [14], clinical markers such as rest tremor, bradykinesia, and rigidity can all be used to detect Parkinson’s Disease, and in this regard, Skidmore et al. [15], as just a diagnosis and clinical diagnosis for Parkinson’s Disease, explored mri. Consequently, Challa et al. [16] used measures of CSF fluid to treat Parkinson’s Disease non-motor symptoms such as sleeping behavioral disorders and olfactory Loss while also detecting the standard. In a study by Prashanth R, Many SWEDD participants received ineffective treatment with severe side effects for many years.
In order to reduce defects in the MRI images, researchers would like to develop trained prediction models that can accurately assess the stages of Parkinson’s Disease patients concerning the same dataset of healthy patients. Despite the importance of understanding the disease's evolution and its various stages, little study has been done to establish a model for predicting and diagnosing the severity of Parkinson’s Disease. In several studies, different machine learning techniques are used to attempt to predict Parkinson’s Disease. Taking into cognizance of the earlier research, Parkinson’s Disease has had a diagnostic accuracy of just 80.6% over the preceding three decades, according to current estimates [4]. Models have indeed been received from various in identifying neurological conditions like Parkinson’s Disease with recent machine learning developments. MRI data analysis only included two studies by Archer et al. [8] that included patient assessments; each study utilized a single patient assessment score. Using an ANN model to detect PD is presented in this paper. The deep neural learning network model, i.e., CNN was used for this challenge (CNN). No image segmentation or feature extraction is required because it learns directly from the images [9]. PD has been diagnosed using a variety of classification methods [10]. It was found that neural networks were far and away the most effective method of classifying data. The extent of PD has recently been predicted utilizing speech signal parameters.
The Based classifier decision tree algorithm improved prediction accuracy in PD patient voice recordings by 2%. An estimated 40 features were used to classify PD patients into four groups based on their UPDRS score, and nine of these characteristics were selected using local learning-based feature selection (Healthy, Early, Intermediate, and Advanced). According to Cole et al. [11], who used wearable sensor data, dynamic machine-learning methods can determine the extent of tremors and dyskinesia. In order to do Deep Brain Simulation Therapy, Angeles et al. [12] developed embedded sensors. Imaging techniques can be used to pinpoint the presence of PD. MRI is more accurate for PD diagnosis because of its excellent contrast in soft tissues (compared to CT). MSA, corticobasal degeneration, and progressive supranuclear palsy can all be clearly shown with this imaging technique. A CT scan can confirm no additional issues, including local or regional atrophy, concealed tumors, and vascular issues [13]. An illness or medical condition is rarely diagnosed with contrast media. Clinical indicators such as rest tremor, bradykinesia, and rigidity, according to Jankovic [14], can all be utilized to detect PD disease. Studying fMRI as an indicator of PD biomarker or diagnostic tool. In the study of persons who were "off medicine" at the time of the study, PD was detected. Sleep difficulty and olfactory Loss are two non-motor symptoms of Parkinson’s Disease that can be treated with CSF fluid measures, as was given by Challa et al. [16]. Analyzing images with a CNN model to detect PD is described in this proposed research.
3.1 Deep Convolutional Neural Network
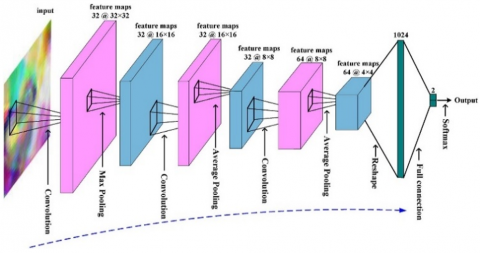
For a long time, several types of disease diagnosis and prognosis have been developed utilizing machine learning techniques, mainly ANNs. ANN’s are known to be the best intelligent models because of their parallelism involved with them. These networks provide the relationship between the input parameters of the PD disease and the stage of the disease the patient is suffering from. Mathematical algorithms often define the connection between input and output parameters. Deep Learning technology has been used for various types of applications in the medical domain for diagnosis and prediction purposes during the last few years. Many results have shown to be accurate enough, which were better than Machine Learning algorithms. The parallelism of the Neural Networks mimics the human brain functioning because of the multiple hidden layers in the networks where the knowledge gained by the networks is represented in the form of synaptic weights. The applications of Deep Convolutional Neural Networks in classifying the patient stage of Parkinson’s Disease are still in their infancy stage, and investigations have been proposed in the usage of deep learning networks for performing the classification task. As shown in Figure 1, a typical CNN does have a convolutional layer that takes input in the shape of a vector and includes information on Parkinson’s Disease. This layer has significance since it generates feature maps by convolving the content provided while preserving the spatial information of the features. Filters (kernels) using Rectifier Linear Unit as an activation function on the input images will generate the features map or activation map. The second layer group would then undergo a subsampling procedure whereby the feature map components are combined and decreased to one value based on a predefined condition.
Figure 1. Working model of DCCN
The deep structure in order to extract features at a higher level, CNN uses convolution and pooling layers differently, dependent on factors like filter size, depth, etc. This enables the removal of each subsequent characteristic. This is one of the main justifications for our usage of CNN. Moreover lastly, the subsampling layer may be connected to a fully connected layer by being reduced to a single vector that contains all of its weights. This layer, coupled with the output layer and containing processing components for each class that may be achieved, allows our DCNN model to classify the input roughly.
3.2 The proposed Deep Convolution Neural Network for classification of Parkinson’s Disease
In this paper, we present our product, a Deep Convolutional Neural Network-based technique for detecting the stage of Parkinson’s Disease. A vector may serve as the input to the DCNN to identify the stage of a disease prediction. A standard deep feed-forward neural network structure used in image recognition is CNN. CNNs can extract the knowledge and represent it as synaptic weights. Images from the PPMI database are used in Figure 1 to demonstrate the proposed technique. Segmentations of pretty quick and putamen areas are generated and submitted as input to the deep neural network (DCNN).
The suggested methodology shown in Figure 2 can be implemented to discriminate between individuals with Parkinson’s Disease (PD) and healthy controls once DCNN has been trained on the dataset [17].
Figure 2. Methodology suggested using MRI images from the PPMI database
The procedure for determining the degree of PD using conventional learning is shown in Figure 3. In the first stage, speech data of PD patients were collected for analysis. The min-max approach is then used to normalize the data that's been obtained. The next stage is creating a DCNN with an input, hidden, and output layer. Two neurons in the output layer corresponding to the two classes: "severe" and "non-severe," whereas the number of neurons in the input layer is fixed for the number of characteristics. The suggested DCNN has been provided with the normalized data as input both for training and testing.
Figure 3. Proposed DCNN model
3.3 DCNN for classification
Deep Convolution Neural Network has been used for classification in the proposed research. The basic architecture of DCCN contains an input layer, two levels of connected levels of hidden layers, and one output layer. Every layer used one activation function to get to know the behavior of the network. The output layer was created with neurons using the Soft Max activation function. There were five layers, and each layer's output was used as input by another layer, which then displayed the input properties. When five 2D kernels swept across input topologies in convolution layers, they transformed them into feature maps. Convolution uses a two-step stride and padding to ensure the output feature maps are consistent with the input data set. This was done with the help of the Rectifier Linear Unit function (ReLu), giving output in a nonlinear fashion. In the output layer, there were five neurons, each depicting the state of the disease. There are five stages with which we can identify the stage of Parkinson’s Disease. These five stages have been considered as five individual classes: control, prodromal, and stage one, two, and three. The normalized data was fed into the DCNN model for training and testing, and the predictive probability was calculated using Soft Max activation on the output layer.
3.4 Cross validation with K-fold expansion
The effectiveness of the DCNN model has been evaluated using the K-fold cross-validation method. This procedure partitioned the entire dataset into ten equal sections, or samples, with a k-value of 10. The model is tested with a tenth sample after being trained with the previous nine, and its performance is evaluated. Similarly, the DCNN model is evaluated using the ninth sample after training with samples 1 through 8 and 10. This procedure is repeated until all samples required for the model's training and testing have been used. This method has been utilized to evaluate the model's performance since the data set is constrained.
4.1 About the database
In order to identify Parkinson’s Disease, it is essential to collect the database and which is given to the input to the model. In this, we used the PPMI dataset. This dataset contains information about different patients with and without PD. The database has 161 files and is stored in CSV format.
In addition to the study documents, the files include bio-specimens, Curetted data cutting, enrolling, imaging, internal medical history, non-motor evaluations, motor assessments, and remote data collecting.
4.2 Data pre-processing
More than 700 patients have been documented, with 465 males and 250 females. There are 213 healthy controls, 421 Parkinson's patients, and 81 SWEDD (Scans without evidence of dopaminergic deficit). Given below, the Table 1 related to Parkinson's patient data and classification is based on the collected MRI images.
Table 1. Patient details
|
Sl. No |
Attribute description |
Number of attributes |
|
1 |
Healthy control |
213 |
|
2 |
Parkinson’s Disease |
421 |
|
3 |
Scans without evidence of a dopaminergic deficit |
81 |
4.3 Image acquisition
It is hoped that biomarkers discovered using new imaging techniques will help doctors better treat PD. These biomarkers have been developed in nations like the USA, Australia, Israel, and some European nations.
200 DAT MRI scans, both standard and those of people with Parkinson’s Disease, are included in the collection. Parkinson’s Disease (PD) was identified at the initial stages using images captured during the disease's premonitory and first visit stages.
4.4 Feature extraction
The pre-processed MRI photos are accessible in the PPMI database. A database stores the axial slices from top to bottom of each MRI image. In this experiment, slices 38–43 showed that the ROI was much more distinctive than the remaining slices (in most cases, the 40th axial slice). Unsharp masking improves the MRI pictures' sharpness while keeping the Gaussian filter's standard deviation. In the image, the caudate and putamen regions are segmented by combining the results of improved, active contour and the Sequential Grass-Fire method. Edges can be detected in photographs with a background that is not uniformly bright and has a wide range of intensity fluctuations thanks to adaptive dynamic thresholding algorithms. A weighted average of each neighborhood is considered when subtracting the offset in this case. This technique results in the formation of the putamen and creates binary areas. The adaptive median filtering approach is then employed to reduce noise. While filtering and smoothing the data, this approach retains the image's refined structure, e.g., edges and edges. It is possible to overcome discretization concerns in existing skeletonization techniques by employing the active contour method that extracts curvature extreme and constant curvature arches to select boundary information for a Euclidean skeleton. This is followed by the sequential grass fire technique, which identifies pixels with high similarity. The scanning begins at the top left and concludes at the bottom right of the screen. To begin with, it sets the matching input pixel to 0 and then proceeds to identify the item of output as 1.
If an object pixel is found, the search is extended to the pixel's four to eight adjacent neighbors. Border pixels from the left and right caudate values are indicated for display by applying a red color (255, 0, 0: RGB) to them. A heuristic graph search technique is employed to find the region within the bounds. The total area of the connected pixels is saved for future study.
Brain MRI data is used to detect Parkinson’s Disease with these models. This was done by gathering and normalizing MRI images from PD sufferers using the min-max normalization technique. Once the data had been pre-processed, further analysis could begin.
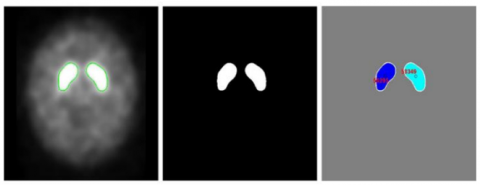
Automatic or manual marking of the fast and hindbrain boundaries occurs after the MRI pictures have been pre-processed. When the margins of the ROI segments are discovered, their area is determined. Sectioned MRI images and their binary equivalents and binary image area values are illustrated in Figure 4. Below are the images where we can find the ROI of the Normal Subject's binary image and ROI area.
Figure 4. The Region of Interest (ROI), the normal subjects binary image, and the ROI area
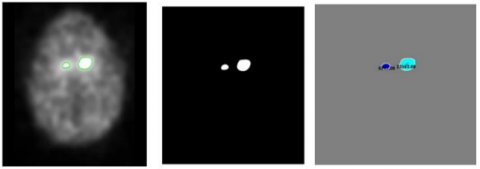
The quick and putamen regions of MRI images in binary form can be identified most successfully using the variable threshold approach. When the left and right sides of the brain were considered, the segmented MRI images for Parkinson’s Disease test subjects revealed ROI values ranging from 100 to 30000 pixels. Its left hemisphere's pixels ranged from 100 to 2000, and the other hemisphere's pixels ranged from 1000 to 39000 when the two hemispheres were analyzed separately. When the left and right hemispheres were assessed jointly, there was an extensive range in the ROI values for healthy patients, and there was a wide range in the ROI values when the left and right hemispheres were studied separately as shown in Figure 5. The data about the computed left and right area values are stored in a database. Parkinson's patients lack dopamine transporters in the putamen and caudate areas of the brain, as shown by the disease's diminished area.
Figure 5. Region of Interest, Parkinson’s Disease patient, and area of interest in a binary image
The left and right hemispheres of the brain's caudate and putamen area values from MRI images are input into a standard neural network to create a prediction model. The trained model is then given the test data. If the anticipated values are more similar to PDs, then average values are more likely than values closer to 1. Subjects can access their allocated prediction zone based on their anticipated values shown in Table 2.
Table 2. The output of CNN for a sampled input
|
PD / normal |
Area right |
Area left |
Scaled right |
Scaled right |
Prediction value |
|
N |
43253 |
43305 |
0.67 |
0.68 |
0.003 |
|
P |
254 |
24224 |
0.0003 |
0.38 |
0.996 |
5.1 Results of the Deep Convolutional Neural Networks
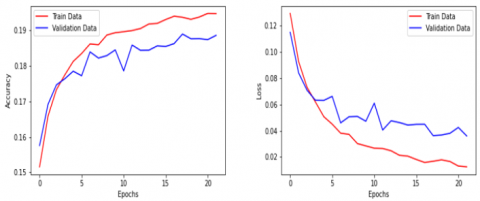
Here, the classification of CNN's data is explored. Figures 3 and 4 employ accuracy and loss measurements to display development (a). Accuracy, Loss, precision, recall, and f1-score were among the evaluation criteria. After 60 iterations, CNN had an accuracy of 0.95 and a 10-fold average loss of 0.179. The effectiveness of the DCNN model as measured by Precision, Recall, and F1 Score is shown in the Table 3. The performance of the model was evaluated using the following equations.
Accuracy $=\frac{T P+T N}{T P+T N+F P+F N}$
Precision $=\frac{T P}{T P+F N}$
Recall $=\frac{T P}{T P+F N}$
$F-$ measure $=\frac{2 *(\text { precision } * \text { Recall })}{(\text { precision }+ \text { Recall })}$
Table 3. DCNN model performance
|
|
Precision |
Recall |
F1-score |
Support |
|
0 |
0.95 |
0.91 |
0.92 |
700 |
|
1 |
0.92 |
0.91 |
0.91 |
375 |
|
2 |
0.93 |
0.95 |
0.96 |
1345 |
|
3 |
0.87 |
0.86 |
0.88 |
484 |
|
4 |
0.98 |
0.98 |
0.98 |
1860 |
Figure 6. DCNN models performance: Epochs vs. Accuracy and Epochs vs. Loss
If you experiment with different AUC/ROC values, you can determine how accurate a classification model is shown in Figure 6. It shows how well the model can stratify and divide groups. If the model has a high AUC, it finds classes. The AUC measures the model's ability to distinguish between different PD stages and categories. This deep learning model evaluation parameters like precision, recall, f1 score values are shown in Table 3. The TP and FP rates are shown above the graph. The performance of the DCNN model has been compared with an Ensemble model, and the model performance has been given below. Comparison of our proposed model to the ensemble classifier model, in terms of accuracy is shown in the Table 4.
Table 4. Comparison of the proposed model with an existing model
|
Model |
Accuracy |
|
Ensemble classifier [18] |
0.7617 ± 0.0041 |
|
DCCN (Proposed) |
0.94 |
This study proposes a Deep Convolution Neural Network for Parkinson’s Disease stage classification. In our first main contribution, we have constructed a DCNN model to classify different stages of Parkinson’s Disease efficiently. This model receives a vector representation of the input where the input has been considered from synthetic data. Furthermore, we have identified the architecture of the DCNN model, giving a better performance in classifying the particular stage of PD. The proposed model has been trained and tested with a dataset of patients with PD and without PD. Thus, it has presented an accuracy of 95% for different inputs. Similarly, in the second contribution, An architecture of the model is identified that best classifies the stage of the disease accurately. The experiments from the above method performed well using the PPMI database, and it could be an enhancement from the earlier methods giving less than the accuracy of the current method, which is 95%. The DCNN model has a prediction accuracy of 95% based on MRI data. Parkinson’s Disease has been detected using Conventional Neural Networks compared to control datasets. The DCNN model has performed well concerning Epochs and Accuracy levels. Researchers have observed that performance improves as the number of epochs rises on training and validation datasets. Regarding the scenario of Epochs vs. Loss, the DCNN model has performed well in that Loss keeps getting smaller as the number of Epochs increases. Whenever the proposed DCNN model's performance was compared to that of various classifiers, this was observed that DCNN exceeded the ensemble model, giving an accuracy of 95% and 76.17% with a learning rate of 0.001. This research suggests a classification method for Parkinson’s Disease detection that could be applied to diagnosing the condition. The around every and reticular formation regions of interest for the experiment were created using an image processing technique, and ROI area values were determined afterward. People living with Parkinson’s Disease can also be rehabilitated, and experts have studied this procedure. Clinical trials that take days or weeks to complete can be replaced with quick tests and consultations with a doctor using this time-saving artificial neural network technology. More data and information acquired from MRI scans will be used in the future to raise the level of accuracy even more. From our perspective, the suggested strategy can assist in Parkinson’s Disease detection and treatment, allowing healthcare providers to make more informed decisions more quickly.
|
PD |
Parkinson’s Disease |
|
DCNN |
Deep Convolutional Neural Networks |
|
ML |
Machine Learning |
|
DL |
Deep Learning |
|
SVM |
Support Vector Machine |
|
AUC |
Area under the Curve |
|
TP |
True Positive |
|
FP |
False Positive |
|
TN |
True Negative |
|
FN |
False Negative |
|
ROI |
Region of Interest |
|
MRI |
Magnetic Resonance Imaging |
[1] Aich, S., Joo, M.I., Hee-Cheol, K., Park, J. (2019). Improvisation of classification performance based on feature optimization for differentiation of Parkinson’s Disease from other neurological diseases using gait characteristics. International Journal of Electrical and Computer Engineering, 9(6): 5176-5184. https://doi.org/10.11591/ijece.v9i6.pp5176-5184
[2] Bakator, M., Radosav, D. (2018). Deep learning and medical diagnosis: A review of literature. Multimodal Technologies and Interaction, 2(3): 47. https://doi.org/10.3390/mti2030047
[3] Heim, B., Krismer, F., De Marzi, R., Seppi, K. (2017). Magnetic resonance imaging for the diagnosis of Parkinson’s Disease. Journal of Neural Transmission, 124: 915-964. https://doi.org/10.1007/s00702-017-1717-8
[4] Rizzo, G., Copetti, M., Arcuti, S., Martino, D., Fontana, A., Logroscino, G. (2016). Accuracy of clinical diagnosis of Parkinson disease: A systematic review and meta-analysis. Neurology, 86(6): 566-576. https://doi.org/10.1212/WNL.0000000000002350
[5] Prashanth, R., Roy, S.D., Mandal, P.K., Ghosh, S. (2016). High-accuracy detection of early Parkinson’s Disease through multimodal features and machine learning. International Journal of Medical Informatics, 90: 13-21. https://doi.org/10.1016/j.ijmedinf.2016.03.001
[6] Archer, D.B., Bricker, J.T., Chu, W.T., et al. (2019). Development and validation of the automated imaging differentiation in parkinsonism (AID-P): A multicentre machine learning study. The Lancet Digital Health, 1(5): e222-e231. https://doi.org/10.1016/S2589-7500(19)30105-0
[7] Saha, R. (2019). Classification of Parkinson’s Disease using MRI data and deep learning convolution neural networks. Theses & dissertations, College of Business.
[8] Chakraborty, S., Aich, S., Kim, H.C. (2020). Detection of Parkinson’s Disease from 3T T1 weighted MRI scans using 3D convolutional neural network. Diagnostics, 10(6): 402. https://doi.org/10.3390/diagnostics10060402
[9] Das, R. (2010). A comparison of multiple classification methods for diagnosis of Parkinson disease. Expert Systems with Applications, 37(2): 1568-1572. https://doi.org/10.1016/j.eswa.2009.06.040
[10] Adams, M.P., Yang, B., Rahmim, A., Tang, J. (2018). Prediction of outcome in Parkinson’s Disease patients from DAT SPECT images using a convolutional neural network. In 2018 IEEE Nuclear Science Symposium and Medical Imaging Conference Proceedings (NSS/MIC), Sydney, NSW, Australia, pp. 1-4. https://doi.org/10.1109/NSSMIC.2018.8824369
[11] Cole, B.T., Roy, S.H., De Luca, C.J., Nawab, S.H. (2014). Dynamical learning and tracking of tremor and dyskinesia from wearable sensors. IEEE Transactions on Neural Systems and Rehabilitation Engineering, 22(5): 982-991. https://doi.org/10.1109/TNSRE.2014.2310904
[12] Angeles, P., Tai, Y., Pavese, N., Wilson, S., Vaidyanathan, R. (2017). Automated assessment of symptom severity changes during deep brain stimulation (DBS) therapy for Parkinson’s Disease. In 2017 International Conference on Rehabilitation Robotics (ICORR), London, UK, pp. 1512-1517. https://doi.org/10.1109/ICORR.2017.8009462
[13] Wippold II, F.J., Brown, D.C., Broderick, D.F., et al. (2015). ACR appropriateness criteria dementia and movement disorders. Journal of the American College of Radiology, 12(1): 19-28. https://doi.org/10.1016/j.jacr.2014.09.025
[14] Jankovic, J. (2008). Parkinson’s Disease: Clinical features and diagnosis. Journal of Neurology, Neurosurgery & Psychiatry, 79(4): 368-376. http://dx.doi.org/10.1136/jnnp.2007.131045
[15] Skidmore, F.M., Yang, M., Baxter, L., von Deneen, K.M., Collingwood, J., He, G., White, K., Korenkevych, D., Savenkov, A., Heilman, K.M., Gold, M., Liu, Y. (2013). Reliability analysis of the resting state can sensitively and specifically identify the presence of Parkinson disease. Neuroimage, 75: 249-261. https://doi.org/10.1016/j.neuroimage.2011.06.056
[16] Challa, K.N.R., Pagolu, V.S., Panda, G., Majhi, B. (2016). An improved approach for prediction of Parkinson’s Disease using machine learning techniques. In 2016 International Conference on Signal Processing, Communication, Power and Embedded System (SCOPES), Paralakhemundi, India, pp. 1446-1451. https://doi.org/10.1109/SCOPES.2016.7955679
[17] Holi, M.S. (2013). Automatic detection of neurological disordered voices using Mel cepstral coefficients and neural networks. In 2013 IEEE Point-of-Care Healthcare Technologies (PHT), Bangalore, India, pp. 76-79. https://doi.org/10.1109/PHT.2013.6461288
[18] Mostafa, T.A., Cheng, I. (2020). Parkinson’s Disease detection using ensemble architecture from MR images. In 2020 IEEE 20th International Conference on Bioinformatics and Bioengineering (BIBE), Cincinnati, OH, USA, pp. 987-992. https://doi.org/10.1109/BIBE50027.2020.00167