Muhammad Arifin*![]() | Widowati Widowati
| Widowati Widowati![]() | Farikhin Farikhin
| Farikhin Farikhin![]()
© 2023 IIETA. This article is published by IIETA and is licensed under the CC BY 4.0 license (http://creativecommons.org/licenses/by/4.0/).
OPEN ACCESS
The prediction of student academic performance with high accuracy is of paramount importance in improving educational outcomes and developing tailored learning methodologies. It also serves as a preventative measure against student dropouts. This study is centered on enhancing the precision of such predictions by optimizing hyperparameters in machine learning techniques. In pursuit of optimal performance, a range of machine learning techniques is compared, and the most accurate one selected for hyperparameter optimization. The adopted method for this optimization is the Grid Search (GS) technique. It is found that hyperparameter optimization in the Gradient Boosting Regression Tree (GBRT) using the GS method bolsters the accuracy of predictions pertaining to student academic performance. The results obtained in this study are validated using a five-fold cross-validation method. This rigorous validation ensures the robustness of our findings. Thus, the study presents a critical contribution to the effective prediction of student academic performance, potentially informing the development of more efficient and personalized educational strategies.
gradient boosting regression trees, grid search, hyperparameter, regression, student performance
1.1 Research background
A critical aspect of higher education is the achievement of satisfactory academic performance, as institutions are under the expectation to cultivate competent graduates [1]. The prediction of student academic performance offers opportunities for monitoring academic progress [2], identifying at-risk students for intervention [3], and refining educational strategies, all while optimising resource allocation. Early prediction also enables timely action and the design of learning approaches to boost student success rates [4].
The relevance of predicting student academic performance effectively has been underscored in prior research. For instance, Ragab et al. [2] introduced a model that aids educators in understanding their students better, pinpointing areas of improvement, crafting learning styles, and curtailing dropout rates. This ensemble model, which leverages learning system data, reportedly yields superior accuracy in comparison to traditional models and offers insights to administrators for refining teaching methodologies and student outcomes [2]. Musaddiq et al. [5] proposed a machine learning model that uses historical student data to forecast final grades, enhance passing rates, and establish an early warning system to mitigate dropout rates. They found that the LSTM deep learning model surpassed other machine learning algorithms in accuracy [5].
For decision-making and reducing the risk of prediction failure, it is imperative to have a sophisticated, highly accurate machine [6]. Typically, several methods are evaluated to obtain optimal prediction accuracy [7], and it is crucial to compare multiple algorithms to determine the most effective one for predicting academic performance [8].
Previous studies have employed various techniques to predict student performance. Hellas et al. [9] used a classification model that drew on student enrollment data and activity data from the university's learning management system (LMS). The model used four algorithms: Nive-Bayes, J48, SMO, and JRip. The study concluded that no single method demonstrates superior performance across all aspects of predicting student performance, but the combination of J48 and JRip showed significant promise [9].
Several studies have compared the effectiveness of different algorithms. Aluko et al. [10] found that the support vector machine (SVM) outperformed logistic regression (LR) in accuracy, while Kumar and Salal [11] reported that the decision tree (DT) algorithm was the best with an accuracy of 98.86% compared to neural network (NN), naive bayes (NB), k-nearest neighbor (K-NN), and SVM. Other researchers, such as Mengash [12] and Yaacob et al. [13], found that the artificial neural network (ANN) and the NB algorithm, respectively, were superior. Miguéis et al. [14] concluded that the random forests (RF) were superior to other classification techniques after comparing them using a dataset of 2459 students. In regression models, Yağcı [15] achieved an accuracy of 70-75% when using several machine learning methods to predict the final exam scores of 1854 Turkish language students. Suleiman and Anane [16] found that the support vector regression (SVR) algorithm performed the best when predicting CGPA at the end of the year in Nigerian universities. Meanwhile, Arifin et al. [8] reported that the gradient boosting regression tree (GBRT) algorithm showed the best performance with an RMSE value of 1.443. Hussain et al. [17] also found that deep learning (DL) outperformed linear regression with an MAE value of 1.61.
Despite numerous methods used to enhance prediction accuracy or reduce errors, the optimization of the algorithm method has not been utilized extensively in predicting students' academic performance. Hooda et al. [18] pointed out the potential of optimizing methods to improve prediction accuracy. This research seeks to enhance the accuracy of predicting student academic performance by integrating hyperparameter optimization into machine learning algorithms to reduce prediction errors. We anticipate comparing multiple prediction methods, and selecting the one with the highest accuracy for hyperparameter optimization using the GS algorithm.
1.2 Conceptual review
1.2.1 Method for predicting student academic performance
The method or model for predicting student academic performance can be approached in two ways. The first approach is through classification, which involves grouping the target feature (GPA) into certain categories. Examples of such categories include good and bad classifications [1, 10], pass and fail [19], as well as excellent, very good, good, average, and poor [12]. The second approach to predicting student academic performance involves using a regression model, in which the target variable is in numerical form, or the original value of the GPA/CGPA without being grouped into certain classes. Various methods that are often employed in this model approach include GLM, DL, DT, SVR, RF, GBRT, NB, k-NN, and so on. In this study, we employ the second approach, which uses the target feature in the form of a numeric value, specifically the original value of the GPA feature. We are aware that many methods have been used to predict student academic performance, but we will restrict our comparison to the six prediction methods frequently used in prior research: GLM, DL, DT, SVR, RF, and GBRT. Subsequently, the prediction method with the smallest error will be selected for hyperparameter tuning.
1.2.2 Hyperparameters
Machine learning algorithms pick up new information independently and change their internal parameters based on what they've learned. These are called "model parameters" or "parameters" for short. However, some arrangements must be made before the learning process can begin. Such parameters are frequently referred to as "hyperparameters." The model parameters show how the input data are transformed into the intended output. Meanwhile, the hyperparameters show how the model is organized. Machine learning models are subject to hyperparameter choices and values that can significantly impact their performance.
The model obtains parameter values during training by learning from the provided data. This value cannot be set manually. Model parameters include the model coefficients in a linear regression model [20]. On the other hand, hyperparameter models do not derive their values from the data. Therefore, researchers must manually set it. At a particular model build, the researcher always sets values to the hyperparameters (for example, before the training process) [20]. The model parameters are subject to control by the model hyperparameters. In other words, model performance can be impacted by model hyperparameters. Therefore, the model hyperparameter values must be modified to produce the optimal or best model output. Even simple models frequently have two or more hyperparameters. Thus, all these values must be seen to get the ideal value for each hyperparameter. Hyperparameter optimization is determining the perfect set of model hyperparameters (tuning). Due to many hyperparameters and their wide range of values, it is impossible to do this manually. Hyperparameter search space is crucial to the process of tweaking the hyperparameters. All possible combinations of the user-defined hyperparameter values can be found in the search space. An example of a 2-dimensional search space for two separate hyperparameters, max_depth and min_samples_split, is shown in Figure 1.
Figure 1. Two-dimensional hyperparameters space
The Figure 1 indicates that the max_depth parameter has a range of 1 to 10, while the min_samples_split parameter has a range of 10 to 50. To determine the correct parameter values manually, researchers would need to test each one individually, starting with a max_depth of 1 and a min_samples_split of 10, and then gradually increasing the min_samples_split value until the max_depth value reaches 10 and the min_samples_split value reaches 50. In other words, the researcher would have to conduct 50 experiments. However, manual experiments are considered ineffective, and therefore, automatic experiments can be carried out using the grid search method to determine the best parameters for a machine learning model.
The search space is three-dimensional if there are three different hyperparameters. Likewise, when the number of hyperparameters rises, the search space may become high-dimensional. In general, it should be realized that the number of hyperparameters depends on the number of dimensions in the search space (for example, two dimensions and two hyperparameters). A specific point in the search space defines each combination of hyperparameter values. Points (30, 7) describe a max_depth value of 7 and a min_samples_split value of 30.
1.2.3 Hyperparameters tuning technique
We recognize many hyperparameter tuning techniques but chose GS. GS is a simple and easy method [21]. This method is most often used by researchers to perform optimization and is proven to improve accuracy [22-33]. GS is a technique for searching the search space for all possible combinations of the hyperparameters given by the user. When the search space is high-dimensional and has many value combinations, it will generally require a lot of processing resources and a long execution time. This approach works best when there are few hyperparameters and a finite (fixed) number of values for each. GS is a method that has traditionally been used by looking through all of the potential parameter combinations. The entire parameter space is considered and partitioned into squares when conducting a grid search. The grid's points are then each assessed as hyper-parameters. The technique is simple and easy to use [21].
1.2.4 Validation and evaluation
K-fold cross-validation is a standard method for assessing the performance of prediction algorithms. Some studies suggest multiple k-fold cross-validations because a reliable accuracy estimate will have low variance. The K-fold cross-validation method involves dividing the initial random sample into K sub-samples. K sub-samples are used as training data, while one sub-sample is used as validation data to evaluate the model. Each K sub-sample is used once as validation data, carried out K times. After that, make a single estimate by averaging (or combining) the K results from the folds [34]. Cross-validation validation [35]. The correlation between the estimated accuracy of multiple k-fold cross-validation replications is their factual accuracy often remarkably high. Evaluate the performance of prediction algorithms using K-fold cross-validation with many folds, and few replications should be used [36]. Generally, researchers use ten-fold or five-fold [20, 37]. This study uses five-fold.
One must determine how well the predictions match the actual data to evaluate a model's performance on a data set. mean absolute error (MAE) and mean squared error (MSE) are widely used metrics for model evaluation [38]. This metric has also been used to predict student performance [8, 16, 39, 40]. One popular method of doing this is finding the MSE [41, 42]. MSE is a metric that measures the difference between the value that is predicted and the actual value. Another method is the Root mean squared error (RMSE). RMSE is a test to measure the performance of a model by measuring the magnitude of the estimation error between the observed value and the prediction value. The lower the RMSE value, the more accurate the model [43]. RMSE is also referred to as the accuracy of a recommendation system. RMSE provides results that have a more significant penalty for a more considerable difference between the actual result and the prediction [44], The lower value of MAE, MSE, and RMSE implies higher accuracy of a regression model [39].
Prediction model validation using K-fold cross-validation, which works as follows:
1. Randomly divide a dataset into k nearly equal "folds."
2. Select the fold that will act as the holdout set. Fit the model to the remaining k-1 folds. Calculate the test MSE based on the observations in the held-out fold.
3. Repeat this process k times with each holdout set to change.
4. Calculate the overall test MSE and the average of the k-test Mses.
Cross-validation with k=5 is used to validate the chosen algorithm.
2.1 Dataset
Predicting student academic performance using data related to education. A university in Indonesia is the place for this research. The first stage in data preparation is data collection, data obtained from an online learning system or learning management system (LMS), namely the Modular object-oriented dynamic learning environment (Moodle), and academic data for one semester.
Moodle data consists of 20,231,298 records from 8,500 active students who attended lectures for 19 weeks, and academic data has 8200 records. The next step is data extraction, which looks for information table structure, contents, and data prediction requirements. Table 1 is the LMS log data from Moodle, consisting of nine columns. The first, third, eighth, and ninth columns are the information about access times, users, access media, and user IP addresses. The second column is the student id and name; this column is the primary key of the data. The second column has the same data because this column records all user activities. The fourth to seventh columns describe and detail the activities carried out by students at the LMS. The academic data includes student id, name, department, faculty, cumulative grade point average (CGPA), and student entry year. Data requirements for predictions are CGPA data and detailed data on the number of each student activity at LMS. The next stage of data preparation is selection and transformation. The selection stage selects the target students to be predicted, namely those entering 2018 and 2019. Select the student id column, description column, and activity details from the LMS data, while from the academic data, select the id column, year of entry, and CGPA column. The transformation stage is the process of changing raw data into data that is ready to be used. At this stage, the descriptive data and details of student activities are converted into numerical form and counted. The data is combined and cleaned, and values inconsistent with the data are removed, for example, students with CGPA below 1, students with very little LMS participation, students with CGPA but no LMS record, and so on. The final result of the data preprocessing is 4435 records with the columns shown in Table 2. This data will be used to predict student academic performance. Figure 3 shows the data structure that is ready to use. This study chose CGPA as the target feature. CGPA is most often used as a prediction target [12], research using LMS data and using a regression model chose CGPA as the target [16, 45].
2.2 Comparison of prediction methods
The results of the experimental comparison of several prediction models with the processed data, it was found that the GBRT model had the lowest error rate and the highest correlation when compared to the other models, shown in Table 3.
The comparison of prediction models reveals that GBRT has the smallest error value. Therefore, the hyperparameters of this model will be optimized using the GS method. Kim and Park [46] have successfully performed the process of optimizing the GBRT hyperparameters with GS. They predicted and investigated the factors that have the most significant impact on student learning scores. Their research findings indicate that optimizing GBRT parameters using the GS method improves prediction accuracy.
There are a lot of hyperparameters in the GBRT that can be changed to change both the whole ensemble (like the learning rate) and each decision tree (like the number of leaves on the tree or its maximum depth). Because the relationships between hyperparameters are complicated, it is hard to tell which combination will work best from theory alone. So, hyperparameter tuning is necessary because trying many combinations on a dataset is the only way to determine the best hyperparameter values.
The model ensemble parameters are divided into three categories: A tree-specific parameter that defines min samples split, min samples leaf, min weight fraction leaf, max depth, max leaf nodes, and max features. The second is the boosting parameter to set the boosting, namely learning rate, n estimators, and subsamples. And the third is the other parameter. Various parameters affect overall functionality: loss, init, random state, verbose, warm start, and presort [47]. In this study, we will do tuning on four parameters, namely n_estimators, learning_rate, max_depth, and subsample, as has been done [48, 49] for tuning GBRT.
n_estimators is a parameter used to consider the number of improvement steps. A large number usually results in better performance as the gradient boost is sufficiently resistant to overfitting. The value must be in the range [1.0, infinity]. learning_rate is the parameter contribution of each tree which decreases as learning_rate increases. There is a trade-off between the learning_rate and n_estimator. The value must be between the range [0.0, infinity]. max_depth is a parameter used to determine the depth of a tree. In general, interactions of order h can be captured by a tree with depth h. If maximum depth=h, complete binary trees of depth h will be generated. At most, such trees will have 2**h leaf nodes and 2**h - 1 split nodes. A subsample is the percentage of the sample that will be used for each base learner's fitting. If the value is less than 1.0, Stochastic Gradient Boosting occurs, and the parameters affected by the subsample are n_estimators. Increased bias and decreased variance result from selecting subsamples smaller than 1.0. The value must fall within this range (0.0, 1.0).
Table 1. LMS log data
|
Time |
User full name |
Affected user |
Event context |
Component |
Event name |
Description |
Origin |
IP address |
|
6/06/22,23:59 |
202111597 QONITAL |
- |
As signment:Pengum |
As signment |
Course module vi |
The user with i |
web |
192.168.1.45 |
|
6/06/22,23:59 |
202051172 YAASINTA |
- |
Course:PENGEMB AN |
System |
Course viewed |
The user with i |
web |
192.168.1.45 |
|
6/06/22,23:59 |
201911341 DITA AYU |
- |
Front page |
System |
Course viewed |
The user with i |
web |
192.168.1.45 |
|
6/06/22,23:59 |
202051172 YAASINTA |
- |
Front page |
System |
Course viewed |
The user with i |
web |
192.168.1.45 |
|
6/06/22,23:59 |
202111597 QONITAL |
- |
File: Latihan Soal Uji |
File |
Course module vi |
The user with i |
web |
192.168.1.45 |
|
6/06/22,23:59 |
202051162 DANENDR |
- |
As signment:Decision |
As signment |
Course module vi |
The user with i |
web |
192.168.1.45 |
|
... |
... |
... |
... |
... |
... |
... |
... |
... |
|
... |
... |
... |
... |
... |
... |
... |
... |
... |
|
... |
... |
... |
... |
... |
... |
... |
... |
... |
|
... |
... |
... |
... |
... |
... |
... |
... |
... |
|
... |
... |
... |
... |
... |
... |
... |
... |
... |
|
... |
... |
... |
... |
... |
... |
... |
... |
... |
|
... |
... |
... |
... |
... |
... |
... |
... |
... |
|
... |
... |
... |
... |
... |
... |
... |
... |
... |
|
... |
... |
... |
... |
... |
... |
... |
... |
... |
|
... |
... |
... |
... |
... |
... |
... |
... |
... |
|
6/06/22,00:00 |
202151157 VIAN NIBR |
- |
As signment: Collecti |
As signment |
Course module vi |
The user with i |
web |
192.168.1.45 |
|
6/06/22,00:00 |
201911542 RIZOJNAZIL |
- |
Course:ETIKA BISNIS |
System |
Course viewed |
The user with i |
web |
192.168.1.45 |
|
6/06/22,00:00 |
202052004 MOCHAM |
- |
Course:PROGRAMM |
System |
Course viewed |
The user with i |
web |
192.168.1.45 |
Table 2. Data ready to use
|
No. |
NIM |
Total_login |
N access forum |
N access didactic units |
Total assignments |
Total assignments submitted |
N access questionnaires |
N attempts questionnaires |
|
1 |
202011233 |
97 |
715 |
216 |
228 |
26 |
142 |
122 |
|
2 |
201911631 |
63 |
2 |
24 |
122 |
7 |
1 |
0 |
|
3 |
202011216 |
121 |
1490 |
296 |
569 |
42 |
225 |
192 |
|
4 |
202011036 |
111 |
208 |
261 |
384 |
41 |
225 |
214 |
|
5 |
202011199 |
105 |
824 |
182 |
376 |
32 |
172 |
158 |
|
6 |
202011192 |
96 |
481 |
148 |
284 |
32 |
210 |
201 |
|
... |
... |
... |
... |
... |
... |
... |
... |
... |
|
... |
... |
... |
... |
... |
... |
... |
... |
... |
|
... |
... |
... |
... |
... |
... |
... |
... |
... |
|
... |
... |
... |
... |
... |
... |
... |
... |
... |
|
... |
... |
... |
... |
... |
... |
... |
... |
... |
|
... |
... |
... |
... |
... |
... |
... |
... |
... |
|
... |
... |
... |
... |
... |
... |
... |
... |
... |
|
44 34 |
202053164 |
95 |
776 |
123 |
345 |
32 |
129 |
115 |
|
44 35 |
202032091 |
118 |
924 |
152 |
244 |
22 |
389 |
323 |
|
No. |
N answered questions |
N questionnaire views |
N questionnaires submitted |
N reviews questionnaire |
Days first access x |
N entries course x |
CGPA |
|
|
1 |
14 |
136 |
3 |
284 |
1 |
444 |
3.43 |
|
|
2 |
3 |
1 |
0 |
278 |
4 |
146 |
2.62 |
|
|
3 |
15 |
221 |
2 |
439 |
1 |
865 |
3.55 |
|
|
4 |
15 |
221 |
2 |
116 |
2 |
645 |
3.61 |
|
|
5 |
15 |
168 |
2 |
434 |
1 |
558 |
3.64 |
|
|
6 |
13 |
206 |
2 |
218 |
7 |
432 |
3.68 |
|
|
... |
... |
... |
... |
... |
... |
... |
... |
|
|
... |
... |
... |
... |
... |
... |
... |
... |
|
|
... |
... |
... |
... |
... |
... |
... |
... |
|
|
... |
... |
... |
... |
... |
... |
... |
... |
|
|
... |
... |
... |
... |
... |
... |
... |
... |
|
|
... |
... |
... |
... |
... |
... |
... |
... |
|
|
... |
... |
... |
... |
... |
... |
... |
... |
|
|
44 34 |
15 |
125 |
2 |
362 |
1 |
468 |
3.82 |
|
|
44 35 |
16 |
379 |
5 |
300 |
9 |
396 |
3.84 |
|
Table 3. Prediction model comparison
|
Model |
RMSE |
|
Deep Learning (DL) |
0.412 |
|
Support Vector Machine (SVM) |
0.433 |
|
Random Forest (RF) |
0.407 |
|
Generalized Linear Model (GLM) |
0.445 |
|
Gradient Boosted Regression Trees (GBRT) |
0.378 |
|
Decision Tree (DT) |
0.461 |
2.3 Hyperparameters tuning
In the previous stage, collecting and preprocessing student academic performance data was carried out. The next step is to predict using the GBRT model with GS tuning techniques. Each hyperparameter tuning technique has other parameters. Therefore, before using it, knowing what parameters must be understood and determining each parameter's value or value range is necessary.
A scikit-learn library in Python called Gridsearchcv is used for hyperparameter tuning methods. The score of each model is then calculated using the scoring index after all parameters have been estimated. The ideal model and parameter combination are then identified. It is no longer required to adjust settings manually to increase development efficiency. However, the Gridsearchcv technique of parameter tuning takes more time. Additionally, time consumption increases as the number of factors and potential values increases. As a result, the critical parameter ranges are often defined in advance and refined. An estimator (first parameter) is a machine-learning model from Scikit-learn. In other words, this is a fundamental model. As previously mentioned, param_grid is a Python dictionary of search space. In the 4-dimensional search space, there are 256 (4×4×4×4) possible combinations, which means using Grid Search to train 256 different models.
Table 4. Parameters for GridSearchCV
|
Parameters |
Values/Ranges |
|
|
estimator |
GradientBoostingRegressor |
|
|
Scoring |
neg_mean_squared_error |
|
|
n_jobs |
-1 |
|
|
Cv |
5 |
|
|
param_grid |
n_estimators |
[50,100,200,300] |
|
Subsample |
[0.9, 0.5, 0.2, 0.1] |
|
|
learning_rate |
[0.1,1,1.5,2] |
|
|
max_depth |
[2,8,12,16] |
|
Grid search will run n parallel jobs; n jobs with a value of -1 indicate that all CPU cores are used. As a result, the execution process will run faster. The execution process will go more quickly as a result. The usual range for the cross-validation fold count is 5, 10, and 15. In this case, as the CV is 5, each hyperparameter combination is repeated five times. Therefore, there have been 1280 iterations (256×5). As for the vulnerable parameters, we set them as follows in Table 4.
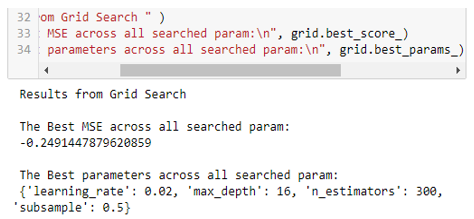
The results of the experiment used the parameters in Table 1. The best parameters are n_estimators: 50, max_depth: 12, subsample: 0.5, and learning_rate: 0.1, with the best MSE value of -0.249. The code snippets and results are shown in Figure 2.
Figure 2. Best parameters from GridSearchCV-GBRT
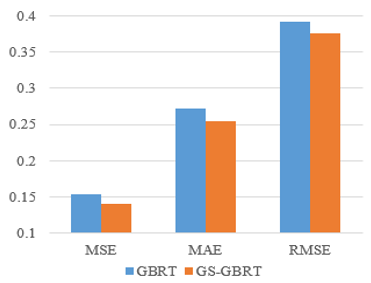
Results of our research on using the GBRT method with GS hyperparameter optimization to predict student performance with less error. Our findings show that our proposed model is effective in reducing prediction errors. All model performance evaluations show smaller error values after optimization; MSE decreases by 0.013, MAE by 0.018, and RMSE by 0.017, as shown in Figure 3.
Figure 3. Comparison of GBRT with GS-GBRT
Cross-validation with k=5 in all model evaluations between validations have almost the same value, as shown in Table 5; this indicates that the proposed model has good reliability, and the distribution of academic performance data used in each validation has a relatively constant value.
Table 5. Validation model
|
K-Validation |
MSE |
MAE |
RMSE |
|
1 |
0.130309 |
0.254369 |
0.360984 |
|
2 |
0.135093 |
0.249349 |
0.367549 |
|
3 |
0.145931 |
0.258957 |
0.38201 |
|
4 |
0.152121 |
0.25944 |
0.390027 |
|
5 |
0.140935 |
0.248987 |
0.375413 |
The GridSearchCV-GBRT technique has the lowest MSE, MAE, and RMSE values compared to GBRT without hyperparameter tuning. Figure 3 shows that hyperparameter tuning affects minimizing the percentage error of the prediction algorithm. Palkhiwala et al. [39] used GS tuning hyperparameters to predict student scores; they used the Math and Portuguese datasets and several machine learning algorithms. Their experiments showed that the MSE value of the k-NN algorithm after optimization decreased by 0.025, DT by 0.041, and SVM by 0.108. In the Math k-NN data, the MSE value decreased by 0.025, DT by 0.04, and SVM by 0.108.
In this research, we look at techniques to optimize machine learning to predict student academic performance using GS. The results of our research show that our model can predict academic performance with a smaller error value than the model without using hyperparameter optimization. Our discussion includes how our results influence existing knowledge and how the results can be applied to specific problems. Our results show that machine learning optimization techniques can effectively minimize errors in predicting student academic performance. This implies that this model can identify students at risk for academic failure, prevent them from dropping out or graduating late, improve educational outcomes, and assist instructors in allocating resources and instruction more accurately. We suggest further research to improve the model's reliability and explore other applications.
This research presents a promising predictive model for student academic performance using a regression model. Based on the comparison of six prediction models, the GBRT model outperformed the others with the smallest error value. Furthermore, the GBRT model was optimized for hyperparameters using the GS method, which led to improved prediction accuracy. The best parameters result from GS to GBRT is n_estimators: 50, max_depth: 12, subsample: 0.5, and learning_rate: 0.1. The validation of the model using cross-validation with k=5 showed good reliability and consistent distribution of academic performance data. Overall, the GBRT model with hyperparameter tuning using the GS method can be a valuable tool for identifying students at risk of academic failure, preventing dropouts or late graduation, and improving educational outcomes.
However, this study only used the GS method to optimize hyperparameters, and future research can explore other hyperparameter techniques for comparison. Additionally, researchers can add variations of hyperparameter setting values in the future to further enhance the model's performance.
This work is supported by the Diponegoro University and Muria Kudus University.
[1] Jenitha, T., Santhi, S., Jeba, J.M.P. (2021). Prediction of students' performance based on academic, behaviour, extra and co-curricular activities. Webology, 18(SI01): 262-279. https://doi.org/10.14704/WEB/V18SI01/WEB18058
[2] Ragab, M., Abdel Aal, A.M., Jifri, A.O., Omran, N.F. (2021). Enhancement of predicting students performance model using ensemble approaches and educational data mining techniques. Wireless Communications and Mobile Computing, 2021: 6241676. https://doi.org/10.1155/2021/6241676
[3] Nachouki, M., Abou Naaj, M. (2022). Predicting student performance to improve academic advising using the random forest algorithm. International Journal of Distance Education Technologies (IJDET), 20(1): 296702. https://doi.org/10.4018/ijdet.296702
[4] Alyahyan, E., Düştegör, D. (2020). Predicting academic success in higher education: literature review and best practices. International Journal of Educational Technology in Higher Education, 17(1): 3. https://doi.org/10.1186/s41239-020-0177-7
[5] Musaddiq, M.H., Sarfraz, M.S., Shafi, N., Maqsood, R., Azam, A., Ahmad, M. (2022). Predicting the impact of academic key factors and spatial behaviors on students’ performance. Applied Sciences, 12(19): 10112. https://doi.org/10.3390/app121910112
[6] Shreem, S.S., Turabieh, H., Al Azwari, S., Baothman, F. (2022). Enhanced binary genetic algorithm as a feature selection to predict student performance. Soft Computing, 26(4): 1811-1823. https://doi.org/10.1007/s00500-021-06424-7
[7] Kumar, P., Sehgal, V.K., Chauhan, D.S. (2012). A benchmark to select data mining based classification algorithms for business intelligence and decision support systems. International Journal of Data Mining & Knowledge Management Process (IJDKP), 2(5): 25-42. https://doi.org/10.5121/ijdkp.2012.2503
[8] Arifin, M., Wibowo, A., Warsito, B. (2021). Comparative analysis on educational data mining algorithm to predict academic performance. In 2021 International Seminar on Application for Technology of Information and Communication (iSemantic), Semarangin, Indonesia, pp. 173-178. https://doi.org/10.1109/iSemantic52711.2021.9573185
[9] Hellas, A., Ihantola, P., Petersen, A., et al. (2018). Predicting academic performance: a systematic literature review. In Proceedings Companion of the 23rd Annual ACM Conference on Innovation and Technology in Computer Science Education, Larnaca, Cyprus, pp. 175-199. https://doi.org/10.1145/3293881.3295783
[10] Aluko, R.O., Daniel, E.I., Shamsideen Oshodi, O., Aigbavboa, C.O., Abisuga, A.O. (2018). Towards reliable prediction of academic performance of architecture students using data mining techniques. Journal of Engineering, Design and Technology, 16(3): 385-397. https://doi.org/10.1108/JEDT-08-2017-0081
[11] Kumar, M., Salal, Y.K. (2019). Systematic review of predicting student's performance in academics. International Journal of Engineering and Advanced Technology, 8(3): 54-61
[12] Mengash, H.A. (2020). Using data mining techniques to predict student performance to support decision making in university admission systems. IEEE Access, 8: 55462-55470.
https://doi.org/10.1109/ACCESS.2020.2981905
[13] Yaacob, W.F.W., Nasir, S.A.M., Yaacob, W.F.W., Sobri, N.M. (2019). Supervised data mining approach for predicting student performance. Indonesian Journal of Electrical Engineering and Computer Science, 16(3): 1584-1592. https://doi.org/10.11591/ijeecs.v16.i3.pp1584-1592
[14] Miguéis, V.L., Freitas, A., Garcia, P.J., Silva, A. (2018). Early segmentation of students according to their academic performance: A predictive modelling approach. Decision Support Systems, 115: 36-51. https://doi.org/10.1016/j.dss.2018.09.001
[15] Yağcı, M. (2022). Educational data mining: prediction of students' academic performance using machine learning algorithms. Smart Learning Environments, 9(1): 11. https://doi.org/10.1186/s40561-022-00192-z
[16] Suleiman, R., Anane, R. (2022). Institutional data analysis and machine learning prediction of student performance. In 2022 IEEE 25th International Conference on Computer Supported Cooperative Work in Design (CSCWD), Hangzhou, China, pp. 1480-1485. https://doi.org/10.1109/CSCWD54268.2022.9776102
[17] Hussain, S., Gaftandzhieva, S., Maniruzzaman, M., Doneva, R., Muhsin, Z.F. (2021). Regression analysis of student academic performance using deep learning. Education and Information Technologies, 26: 783-798. https://doi.org/10.1007/s10639-020-10241-0
[18] Hooda, M., Rana, C., Dahiya, O., Shet, J.P., Singh, B.K. (2022). Integrating LA and EDM for improving students Success in higher Education using FCN algorithm. Mathematical Problems in Engineering, 2022: 7690103. https://doi.org/10.1155/2022/7690103
[19] Karalar, H., Kapucu, C., Gürüler, H. (2021). Predicting students at risk of academic failure using ensemble model during pandemic in a distance learning system. International Journal of Educational Technology in Higher Education, 18: 63. https://doi.org/10.1186/s41239-021-00300-y
[20] Ma, H., Yang, X., Mao, J., Zheng, H. (2018). The energy efficiency prediction method based on gradient boosting regression tree. In 2018 2nd IEEE Conference on Energy Internet and Energy System Integration (EI2), Beijing, China, pp. 1-9.
https://doi.org/10.1109/EI2.2018.8581904
[21] Bergstra, J., Bengio, Y. (2012). Random search for hyper-parameter optimization. Journal of machine learning research, 13(2): 281-305.
[22] Shekar, B.H., Dagnew, G. (2019). Grid search-based hyperparameter tuning and classification of microarray cancer data. In 2019 Second International Conference on Advanced Computational and Communication Paradigms (ICACCP), Gangtok, India, pp. 1-8. https://doi.org/10.1109/ICACCP.2019.8882943
[23] Liashchynskyi, P., Liashchynskyi, P. (2019). Grid search, random search, genetic algorithm: A big comparison for NAS. arXiv preprint arXiv:1912.06059
[24] Villalobos-Arias, L., Quesada-López, C., Guevara-Coto, J., Martínez, A., Jenkins, M. (2020). Evaluating hyper-parameter tuning using random search in support vector machines for software effort estimation. In Proceedings of the 16th ACM International Conference on Predictive Models and Data Analytics in Software Engineering, USA, pp. 31-40. https://doi.org/10.1145/3416508.3417121
[25] Villalobos-Arias, L., Quesada-López, C. (2021). Comparative study of random search hyper-parameter tuning for software effort estimation. In Proceedings of the 17th International Conference on Predictive Models and Data Analytics in Software Engineering, Athens, Greece, pp. 21-29. https://doi.org/10.1145/3475960.3475986
[26] Andonie, R., Florea, A.C. (2020). Weighted random search for CNN hyperparameter optimization. arXiv preprint arXiv:2003.13300
[27] Florea, A.C., Andonie, R. (2020). Weighted random search for hyperparameter optimization. arXiv preprint arXiv:2004.01628
[28] Wong, J., Manderson, T., Abrahamowicz, M., Buckeridge, D.L., Tamblyn, R. (2019). Can hyperparameter tuning improve the performance of a super learner? A case study. Epidemiology, 30(4): 521-531. https://doi.org/10.1097/EDE.0000000000001027
[29] MacKay, M., Vicol, P., Lorraine, J., Duvenaud, D., Grosse, R. (2019). Self-tuning networks: Bilevel optimization of hyperparameters using structured best-response functions. arXiv preprint arXiv:1903.03088
[30] Duarte, E., Wainer, J. (2017). Empirical comparison of cross-validation and internal metrics for tuning SVM hyperparameters. Pattern Recognition Letters, 88: 6-11. https://doi.org/10.1016/j.patrec.2017.01.007
[31] Putatunda, S., Rama, K. (2019). A modified Bayesian optimization based hyper-parameter tuning approach for extreme gradient boosting. In 2019 Fifteenth International Conference on Information Processing (ICINPRO), Bengaluru, India, pp. 1-6. https://doi.org/10.1109/ICInPro47689.2019.9092025
[32] Putatunda, S., Rama, K. (2018). A comparative analysis of hyperopt as against other approaches for hyper-parameter optimization of XGBoost. In Proceedings of the 2018 International Conference on Signal Processing and Machine Learning, Shanghai, China, pp. 6-10. https://doi.org/10.1145/3297067.3297080
[33] Joy, J., Selvan, M.P. (2022). A comprehensive study on the performance of different Multi-class Classification Algorithms and Hyperparameter Tuning Techniques using Optuna. In 2022 International Conference on Computing, Communication, Security and Intelligent Systems (IC3SIS), Kochi, India, pp. 1-5. https://doi.org/10.1109/IC3SIS54991.2022.9885695
[34] Jiang, P., Chen, J. (2016). Displacement prediction of landslide based on generalized regression neural networks with K-fold cross-validation. Neurocomputing, 198: 40-47. https://doi.org/10.1016/j.neucom.2015.08.118
[35] Schratz, P., Muenchow, J., Iturritxa, E., Richter, J., Brenning, A. (2019). Hyperparameter tuning and performance assessment of statistical and machine-learning algorithms using spatial data. Ecological Modelling, 406: 109-120. https://doi.org/10.1016/j.ecolmodel.2019.06.002
[36] Wong, T.T., Yeh, P.Y. (2019). Reliable accuracy estimates from k-fold cross validation. IEEE Transactions on Knowledge and Data Engineering, 32(8): 1586-1594. https://doi.org/10.1109/TKDE.2019.2912815
[37] Rohani, A., Taki, M., Abdollahpour, M. (2018). A novel soft computing model (Gaussian process regression with K-fold cross validation) for daily and monthly solar radiation forecasting (Part: I). Renewable Energy, 115: 411-422. https://doi.org/10.1016/j.renene.2017.08.061
[38] Hodson, T.O. (2022). Root-mean-square error (RMSE) or mean absolute error (MAE): when to use them or not. Geoscientific Model Development, 15(14): 5481-5487. https://doi.org/10.5194/gmd-15-5481-2022
[39] Palkhiwala, S., Shah, M., Shah, M. (2022). Analysis of Machine learning algorithms for predicting a student's grade. Journal of Data, Information and Management, 4: 329-341. https://doi.org/10.1007/s42488-022-00078-2
[40] Yang, S.J., Lu, O.H., Huang, A.Y., Huang, J.C., Ogata, H., Lin, A.J. (2018). Predicting students' academic performance using multiple linear regression and principal component analysis. Journal of Information Processing, 26: 170-176. https://doi.org/10.2197/ipsjjip.26.170
[41] Cai, J., Xu, K., Zhu, Y., Hu, F., Li, L. (2020). Prediction and analysis of net ecosystem carbon exchange based on gradient boosting regression and random forest. Applied Energy, 262: 114566. https://doi.org/10.1016/j.apenergy.2020.114566
[42] Willmott, C.J. (1982). Some comments on the evaluation of model performance. Bulletin of the American Meteorological Society, 63(11): 1309-1313. https://doi.org/10.1175/1520-0477(1982)063<1309:SCOTEO>2.0.CO;2
[43] Chai, T., Draxler, R.R. (2014). Root mean square error (RMSE) or mean absolute error (MAE)? Arguments against avoiding RMSE in the literature. Geoscientific Model Development, 7(3): 1247-1250. https://doi.org/10.5194/gmd-7-1247-2014
[44] Gunawan, A.A.S., Tania, Suhartono, D. (2016). Developing recommender systems for personalized email with big data. In 2016 International Workshop on Big Data and Information Security (IWBIS), Jakarta, Indonesia, pp. 77-82. https://doi.org/10.1109/IWBIS.2016.7872893
[45] Hasan, R., Palaniappan, S., Raziff, A.R.A., Mahmood, S., Sarker, K.U. (2018). Student academic performance prediction by using decision tree algorithm. In 2018 4th International Conference on Computer and Information Sciences (ICCOINS), Kuala Lumpur, Malaysia, pp. 1-5. https://doi.org/10.1109/ICCOINS.2018.8510600
[46] Kim, C., Park, T. (2022). Predicting determinants of lifelong learning intention using Gradient Boosting Machine (GBM) with grid search. Sustainability, 14(9): 5256. https://doi.org/10.3390/su14095256
[47] Datta, P., Das, P., Kumar, A. (2022). Hyper parameter tuning based gradient boosting algorithm for detection of diabetic retinopathy: An analytical review. Bulletin of Electrical Engineering and Informatics, 11(2): 814-824. https://doi.org/10.11591/eei.v11i2.3559
[48] Alhakeem, Z.M., Jebur, Y.M., Henedy, S.N., Imran, H., Bernardo, L.F.A., Hussein, H.M. (2022). Prediction of ecofriendly concrete compressive strength using gradient boosting regression tree combined with GridSearchCV hyperparameter-optimization techniques. Materials, 15(21): 7432. https://doi.org/10.3390/ma15217432
[49] Rijsdijk, J., Wu, L., Perin, G., Picek, S. (2021). Reinforcement learning for hyperparameter tuning in deep learning-based side-channel analysis. IACR Transactions on Cryptographic Hardware and Embedded Systems, 2021(3): 677-707. https://doi.org/10.46586/tches.v2021.i3.677-707