Sukamto*![]() | Hadiyanto
| Hadiyanto![]() | Kurnianingsih
| Kurnianingsih![]()
© 2023 IIETA. This article is published by IIETA and is licensed under the CC BY 4.0 license (http://creativecommons.org/licenses/by/4.0/).
OPEN ACCESS
The medical preeclampsia dataset emphasizes the possession of very large data by a majority class, compared to a minority class. This condition often leads to imbalanced classes in the training datasets, which then affects model prediction negatively. However, a standard classifier is likely to perform adequately on a balanced sample. Asides from the imbalance class issue, another problem in the medical dataset is irrelevant features, which cause poor model accuracy. In this case, several techniques such as SMOTE, as well as random oversampling and undersampling (ROS and RUS) have been used as problem-solving approaches, although they also contained some negative impacts, such as overfitting, loss of information, and overlapping. Therefore, this study aims to propose a model, which combines Features selection, a Hybrid Resampling technique, and a K-Nearest Neighbor algorithm (FHR-KNN), to overcome this problem. This model was implemented to the imbalanced datasets, with the average values of the accuracy, precision, and recall of the FHR-KNN obtained at 99%, 95%, and 95%, which is 0.03% higher than another classifier, respectively. Based on the results, the strategy implemented consistently outperformed other methods and classifiers regarding performance levels. The accuracy of individual classifiers showed the elevation of almost all classifier appropriateness. Additionally, an increase was observed within the average accuracy indices FHR-KNN algorithm compared to the traditional oversampling technique.
FHR-KNN, hybrid, imbalance, preeclampsia, resampling
The prediction of preeclampsia and its disorders has been highly considered during the last two decades [1, 2]. Preeclampsia (PE) is one of the main contributors to global maternal mortality [3]. Several models have reportedly been implemented and validated in some modal studies [4]. Some analytical experts have also applied different machine learning algorithms, but without solving the problem of imbalanced medical datasets. In this case, the majority class contains very large data, compared to the minority group, leading to imbalanced classes in the training datasets [5]. The binary and multi-class datasets with imbalanced data problems [6] also negatively affect model prediction [7], enable ineffective and difficult learning [8], as well as wrongly predict the minority class. This indicates that classifiers support and neglect the majority and minority classes, respectively.
The class overlapping problem has reportedly increased the difficulty of appropriately classifying the minority class samples [9]. This shows that imbalanced dataset learning is one of the challenging issues in data mining. In this model, the acquisition of the best model assessment measures is almost the main experimental issue [10]. However, a standard classifier is likely to have a very good performance on a balanced dataset [11]. Traditional classification algorithms also commonly assume the similarities of samples in each class [12]. Asides from the imbalanced class issue, another medical dataset problem is irrelevant features, which cause reduced model accuracy. The problem-solving methods for imbalanced data classification issues mainly prioritized the algorithm and data levels [13, 14], although other perspectives focus on three categories, namely data-level, algorithmic, and ensemble learning-based solutions. Using the algorithm and data-level approaches, the methods proposed for imbalanced learning are broadly classified [15]. In all the described categories, the data-level solution is also relatively popular due to its easy implementation, feasibility, execution, high accuracy, and proficiency [16].
At the data level, class imbalances are decreased or increased by changing the sample distribution of the dataset, toward the presentation of a balanced output. This technique is easier to use than the algorithm-level approach, regarding the amendment of the datasets before being trained by classifiers [17]. The main benefit of the data-level method also prioritizes its high and wide application, due to being non-dependent on the classifier used. In addition, the option to pre-process all datasets and use them to train various classifiers is also highly considered. This explains the importance of resolving the imbalance of the medical dataset at the data level. The technique (data level) also has three common approaches, namely undersampling, oversampling, and hybrid sampling (oversampling-undersampling). These approaches are quite effective in different problem conditions [18], with the combination of oversampling and undersampling capable of achieving better classifier performance for the minority and majority classes [19]. One of the most common data-level algorithms is random oversampling, which equalizes the distribution of information by randomly copying minority samples. However, blind copying often leads to overfitting [20]. The popular method of oversampling approach is also the ROS (random oversampling) method, which randomly duplicates the minority class samples to balance the class distribution. This is the simplest oversampling method [21]. which simply copies minority instances to generate a balanced training set. The drawback of ROS also generates the overfitting of the classification model, whose problem is effectively solved by SMOTE. Synthetic minority oversampling technique (SMOTE) is used to generate artificial samples, by replicating the dataset with the fewest and most dominant information. This algorithm has a track record of success in improving sample dispersion. However, it frequently has unfavorable effects and even works against itself when written. This is mostly due to the possession of sample overlapping issues, which cause the formation of new minority samples. These samples are observed to highly consider the size and closeness of existing minority classes.
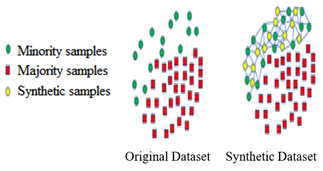
Based on Figure 1, noise, boundary, and overlapping samples were the issues observed for the SMOTE-based minority classes. However, SMOTE is found to easily synthesize noise, boundary, and overlapping samples, as well as overfitting. To balance the class distribution, the majority of class samples are randomly removed using the RUS (random under-sampling) method [22]. Using undersampling techniques, the trading period of the learning model then becomes shorter, although risks losing important data. From these descriptions, Borderline SMOTE is suggested as a solution to the issue. This is because the synthetic samples are more conducive to learning, with the algorithm only determining the border samples of the minority classes to linearly interpolate. Meanwhile, the number of neighbours (k) needs to be highly considered when determining the boundary samples of the minority classes [23]. This suggests the patterns by which the scientific determination and judgment of k and the boundary samples need to be subsequently solved. The Adaptive SMOTE, also manages the distribution of synthetic minority samples, regarding the dataset distribution [24], although the algorithm causes the synthesized specimens of the majority classes [25]. This model combines a cluster-based algorithm, with SMOTE completely considering the characteristics among samples. This leads to the development of new problems, such as the loss of classes and new boundary samples [26].
As a data mining classifier, KNN is a popular approach for classifying data. This is a simple and highly accurate approach, which has been adequately used in several applications, especially in the Healthcare field [27]. It is also appropriately performed when selected features are employed [28]. Furthermore, KNN emphasizes the decisions made for k (the number of neighbours) and d (the percentage of points to be properly considered), which are crucial in addressing noise and outliers [29]. In this process, the selected k-value negatively affected the performance of this classification algorithm. This explains the need for an ideal set of k-instances, to obtain accurate classification outputs. The selection should also be very low, compared to the total number of objects in the datasets [30]. To under-sample the majority of class samples, KNN needs to be gradually and steadily used. In this process, the overlapping rates of each sample are initially detected, with those having the highest values removed for undersampling. This was conducted to alleviate the class imbalance problem [31]. The prediction phase of KNN is often slow for a larger dataset and insufficient when applied to high dimensional data, which are very sensitive to noisy and missing information, as well as outliers. In this case, an urgent issue prioritizes the patterns of enhancing model performance in imbalanced medical data.
Figure 1. Original and synthetic dataset
The feature level method is mostly used in the present classification techniques, for high-dimensional imbalanced datasets [32]. This shows that feature selection needs to be the first and most important step of a model design and feature selection using the filter method, Pearson Correlation Coefficient can improve accuracy [33]. In this process, automatic or manual selection depends on the characteristics that are most important to a prediction variable or desired outcome. This is based on the avoidance of irrelevant features, which reduce model accuracy. Moreover, the benefits of the selection process are numerous, including decrease overfitting and increases precision. Feature selection also significantly affects the performance level of a model. to obtain informative and relevant parameters for the improvement of classification efficiency [34]. This process is very helpful when encountering an imbalanced dataset. In the classification analysis, this problem often occurs when many more examples are observed from some classes than others [35]. Therefore, this study aims to develop a model, which combines Features selection, a Hybrid Resampling technique, and a K-Nearest Neighbor algorithm (FHR-KNN), to overcome the imbalanced medical preeclampsia dataset of the majority and minority classes.
The novel contribution of this article is the use of a hybrid random over sampling (ROS) and random under sampling (RUS) over K-Nearest Neighbor (FHR-KNN) to overcome the imbalanced majority and minority preeclampsia dataset. Precision, recall, accuracy, and F-1score are utilized to evaluate the model.
The remaining sections of the paper are organized as follows: The second section gives the materials and methods utilized to overcome an imbalanced dataset. In Section 3, the experiment analysis and evaluation of an imbalanced dataset are presented, followed by a discussion. In Section 3, this study is concluded.
2.1 K-nearest neighbour (KNN)
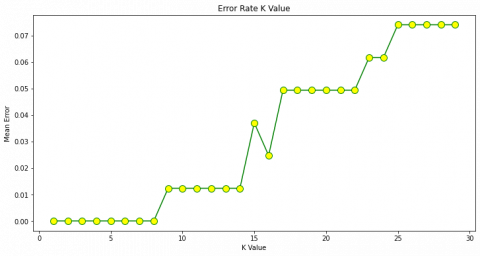
In a standard KNN classifier, K is often developed using cross-validation for a test sample and is frequently quite small when a fixed value. This classifier aims to reduce the cost of misclassification and is frequently used to construct probability estimation. To develop a statistically stable KNN classification strategy, the selection of the appropriate K for any test samples is very crucial. Figure 2 is the training and validation error rates using various K-values.
Figure 2. Error rate graph
Based on Figure 2, the error increased with the elevation of K and decreased when K is two. This condition is observed due to the closeness of any training data point to itself. For example, the model overfits the training data when K=1, causing a high error rate on the validation set. This indicated that the model performed poorly on the training and validation sets despite the high k-value. Therefore, this k-value is the ideal coefficient of the model, due to varying for different datasets.
2.2 Proposed FHR-KNN
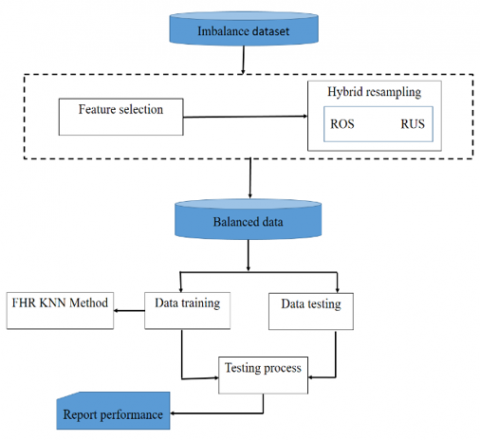
Figure 3. Proposed model FHR-KNN
Figure 3 shows the FHR-KNN architectural system for preeclampsia prediction, whose modelling performances are gradually observed. The modeling system also contained several steps, which were used to explain its operational patterns. In this system, only 1 individual classifier was used, namely KNN.
Based on Figure 2, feature selection was initially performed using matrix correlation to select irrelevant characteristics. This was accompanied by the use of the resampling technique and the operation of the FHR-KNN algorithm.
|
Algorithm FHR-KNN |
a. Feature selection processing A transformed dataset (Dx) with selected features is obtained. b. Resampling technique processing Apply (Dx) on the Hybrid resampling technique
|
2.3 Performance evaluation
In machine learning, the classifier is evaluated by a confusion matrix [36]. This emphasizes the use of precision, recall, F1-score, and accuracy to evaluate the performance of the model. Accuracy prioritizes the appropriate categorization of a classifier in a two-class issue, namely normal and abnormal. Meanwhile, the F1-score is used to evaluate the investigation outputs.
Precision is defined as the proportion of appropriately identified positive samples (True Positive) to the total number of accurate or inaccurate classified affirmative specimens. For recall, the proportion of Positive samples is often identified from all the possible affirmative predictions considered. This method measures the level to which the model is able to identify positive samples. In this case, the more positive samples are identified, the higher the recall values. In addition, F1-score is the weighted average of precision and recall, with accuracy being the most intuitive performance technique. It (accuracy) is also a ratio of appropriately predicted observation to the total observation. There are several preferred methods for scale the performance of the classification. These calculations are calculated using the confusion matrix. The most preferred metrics are Precision, Recall and Accuracy [37, 38].
Accuracy
Accuracy $=\frac{T P+T N}{T P+F P+F N+T N}$ (1)
Precision
Precision $=\frac{T P}{T P+F P}$ (2)
Recall
Recall $=\frac{T P}{T P+F N}$ (3)
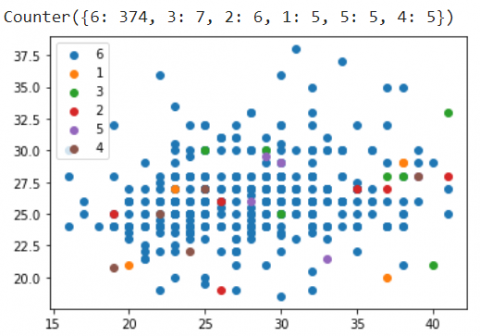
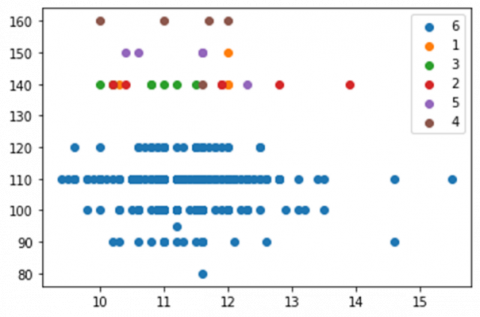
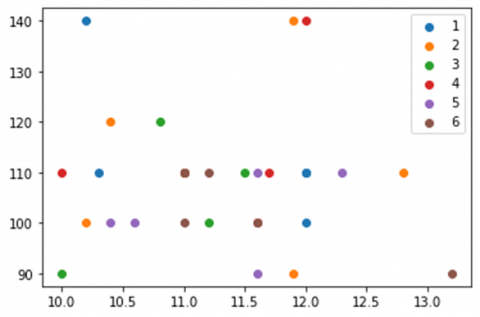
The distribution of imbalanced class is shown in Figure 4. Blue color depicts chronic hypertension represented with class number 1. While, orange color depicts hypertension in pregnancy represented with class number 2. Furthermore, green color depicts preeclampsia represented with class number 3. Red color depict severe preeclampsia represented with class number 4. Then, purple color depicts superimposed preeclampsia represented with class number 5. Finally, brown color depicts healthy pregnant women represented with class number 6. This emphasized the data on Healthy Pregnant Women (374), Preeclampsia (7), Pregnancy and Chronic Hypertension (6 and 5), as well as Severe and Superimposed Preeclampsia (5 each). Regarding this analysis, the imbalanced dataset negatively affected the prediction of the model and caused difficulties of an effective model learning. The differences in the sum of data between classes also led to the inability of the classification model to appropriately predict the minority class. To overcome this condition, the balancing of data through the SMOTE method was highly necessary.
Figure 4. Original data distribution
2.4 Experimental design
This analysis was divided into 4 experimental stages, namely (1) Feature selection (2) The test with several machine learning (ML) algorithms, which were selected based on the several references having good performance, are shown in Table 1 (3) The test with the random oversampling and undersampling methods (ROS and RUS), NearMiss, Borderline, and the SMOTE technique, and (4) The test with the Hybrid method (oversampling-undersampling). Firstly, the ML algorithm using the ensemble method (Bagging, AdaBoost, and Random Forest) was tested to determine the performance of each classifier. Secondly, testing was carried out using the ROS, RUS, and SMOTE methods. Thirdly, the analysis used the Hybrid method. At each experimental stage, the verification of the ML algorithm was carried out to ensure diagnostic prediction, whose performance was measured using a confusion matrix. In this case, the results obtained were analyzed to select an ML algorithm with good performance. This algorithm emphasized the combination of Feature selection, ROS, RUS, and FHR-KNN, which was used to classify and predict imbalanced preeclampsia medical data.
3.1 Dataset
We analyzed the data from a cohort of 402 pregnant women between the years 2015 and 2019. The data that was originally recorded in the handwritten pregnancy cohort book was imported into an Excel datasheet. The fifteen features of a cohort described in Table 1.
Table 1. Feature of data pregnancy description from some resources
|
No |
Features |
Description |
|
1 |
Maternal age |
The mother's age at the time of delivery |
|
2 |
Maternal arm circumference (Lila) |
The number of months between the birth of the index child and the next live delivery |
|
3 |
Haemoglobin (Hb) |
Hb is a protein that transports oxygen in red blood cells. |
|
4 |
Systolic |
is the phase of the cardiac cycle in which the heart muscles are contracted |
|
5 |
Diastolic |
The relaxed condition of the heart is the opposite phase in the cardiac cycle. |
|
6 |
Protein in urine |
A high level of proteins in the urine |
|
7 |
Parity |
The number of pregnancies with a gestational age of 24 weeks or more after childbirth |
|
8 |
Birth intervals |
The number of months between the index birth and the next live delivery |
|
9 |
Height (TB) |
Height of body |
|
10 |
Weight (BB) |
Weight of body |
|
11 |
History of preeclampsia |
The mother of the patient suffered from preeclampsia |
|
12 |
History of diabetes |
The mother of the patient suffered from diabetes |
|
13 |
History of hypertension |
The mother of the patient suffered from hypertension |
|
14 |
Mean arterial pressure (MAP) |
A cardiac cycle's average arterial pressure, including systole and diastole |
|
15 |
Diagnosis (Preeclampsia label) |
This is the target attribute to classify |
3.2 Data pre-processing
3.2.1 Feature selection
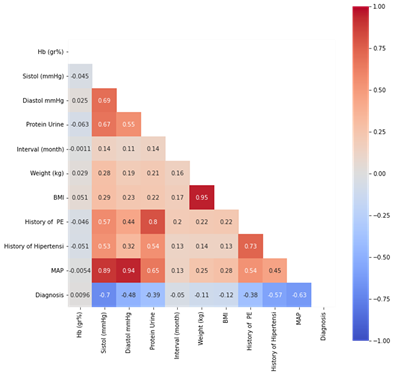
Figure 5. Pearson’s ranking of several features
Feature Selection is the method of reducing the input variable to your model by using only relevant data and getting rid of noise in data. Correlation is a measure of the linear relationship between two or more variables. Prediction of a variable can be done using correlation. Initially, we selected features using Pearson correlation to find out the strength of the correlation between the two variables such as shown Figure 5. Feature selection process is carried out based on value Pearson's highest and get the best features selected based on Pearson's score. Following is the formula for Pearson's coefficient.
$\rho(X, Y)=\frac{E[(X-\mu x)(Y-\mu y)]}{\sigma x, \sigma y}$ (4)
Based on this formula, the p-value was between -1 and +1. This indicated that the value closest to +1 and -1 showed the presence of a strong positive and negative relationship between X and Y, respectively. Meanwhile, the value closest to 0 exhibited the absence of any relationship between X and Y.
3.2.2 Resampling technique
Resampling is a preprocessing approach that balances the distribution of an unbalanced dataset before it is sent to any classifiers. Resampling methods are designed to change the composition of a training data set for an imbalanced classification task [39]. This approach is divided into three categories, namely oversampling, undersampling, and hybrid sampling (oversampling-undersampling). In this case, undersampling is the commonly used resampling technique, which randomly selects and integrates a majority class sample into a minority group, leading to the formulation of a new training dataset. However, oversampling often increases the minority class samples toward the level of the other majority groups by random duplication [40]. Random undersampling is also used to generate the random subsamples of majority class instances [41] This subsequently shows that undersampling is a method that randomly selects and integrates a majority class sample into a minority group, leading to the formulation of a new training dataset. The simplest implementation of ROS is to duplicate random records from the minority class, which can cause overfitting. In RUS, the simplest technique involves removing random records from the majority class, which can cause loss of information.
The experiment was also carried out by applying the ROS method to the dataset, to develop a replication of the minority data. This indicated the development of synthetic data, which were used to duplicate minor information.
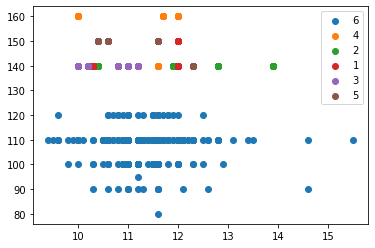
Figure 6. Data distribution after feature selection
According to Figure 6, the distribution of data between the minority and majority classes was balanced through the values of healthy pregnant women, preeclampsia, pregnancy and chronic hypertension, as well as severe and superimposed preeclampsia after feature selection. this emphasized the data on healthy pregnant women (93.035%), chronic hypertension (1.244%) preeclampsia (1.741%), hypertension in pregnancy (1.493%), superimposed preeclampsia (1.244%) and severe preeclampsia (1.244%).
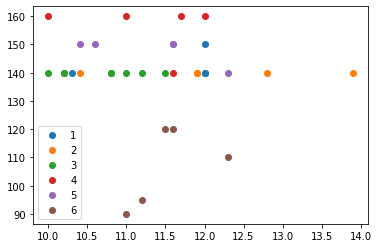
Figure 7. Data augmentation of ROS
Based on Figure 7, the data were observed in an imbalanced condition after ROS. This emphasized the data on healthy pregnant women (74.378%), preeclampsia (74.378%), pregnancy (74.378%), and chronic hypertension (74.378%), as well as severe and superimposed preeclampsia (74.378%).
Figure 8. Data augmentation of RUS
Based on Figure 8, the data were observed in an imbalanced condition after RUS. This emphasized the data on healthy pregnant women (1.244%), preeclampsia (1.493%), pregnancy (1.741%), and chronic hypertension (1.741%), as well as severe and superimposed preeclampsia (1.741%).
Figure 9. Data augmentation of hybrid resampling
Based on Figure 9 hybrid resampling techniques were used to balance the distribution of data in the minority and majority classes, at 93.035%. Compared to the ROS results which have an average of 74.378% for all types, it can be seen that there is an increase in the percentage of samples of 18.657%. whereas when compared with the results of RUS which has an average decrease in sample to 1.592% for all types of sample data, there is an increase in sample of around 91.443%.
3.3. Comparative experiment of verification
3.3.1 Traditional classifier comparison using variance threshold
The variance threshold method is method that eliminates that feature has a variance below a certain limit. This experiment has done using difference variance threshold to exam perform of classifier before using our proposed method. Experiment result shown at Table 2.
Table 2. Classifier performance using variance threshold
|
Algorithm |
0.5 |
0.7 |
0.8 |
0.9 |
0.95 |
0.99 |
|
Decision Tree |
0.90 |
0.94 |
0.95 |
0.95 |
0.95 |
0.95 |
|
Random Forest |
0.90 |
0.90 |
0.90 |
0.90 |
0.90 |
0.90 |
|
Gradient Boosting |
0.94 |
0.94 |
0.94 |
0.94 |
0.94 |
0.94 |
|
Linear SVM |
0.94 |
0.97 |
0.97 |
0.97 |
0.97 |
0.96 |
|
Ada Boost |
0.93 |
0.93 |
0.93 |
0.93 |
0.95 |
0.95 |
|
Logistic |
0.93 |
0.96 |
0.98 |
0.95 |
0.98 |
0.99 |
|
KNN |
0.94 |
0.95 |
0.94 |
0.94 |
0.94 |
0.94 |
|
Radial SVM |
0.95 |
0.96 |
0.96 |
0.97 |
0.97 |
0.97 |
From looking at these results, some classifiers get a possibility of a slight improvement in accuracy after removing features that are correlated. The improvement in accuracy can be illustrated with graphs such as depicted in Figure 8.
3.3.2 Traditional resampling algorithms comparison
To show the superiority of the proposed method, a comparative and verification analysis was conducted with five traditional oversampling algorithms. Using oversampling methods such as ROS, RUS, NearMiss, BorderLine, and SMOTE to address the imbalanced learning issue, various study areas were subsequently observed, such as Table 3.
Table 3. Traditional resampling comparison
|
Balancing Algorithm |
Under/ Over Sampling |
Accuracy |
Precision |
Recall |
|
ROS |
Over Sampling |
0.61 |
0.67 |
0.61 |
|
RUS |
under-sampling |
0.67 |
0.72 |
0.67 |
|
Borderline |
Over Sampling |
0.96 |
0.58 |
0.58 |
|
SMOTE |
Over Sampling |
0.96 |
0.56 |
0.58 |
|
Propose |
FHR-KNN |
0.99 |
0.95 |
0.95 |
The average values of the Accuracy indexes of the ROS and RUS are 0.64%, while Borderline and SMOTE are 0.96% and our algoritm acchived 0.99%. It is concluded that the imbalance of the data greatly affects the classification performance of the balancing algoritm. The KNN method has the best classification effect on the datasets after the oversampling of FHR-KNN algorithm, and improves the robustness of the algorithm. From the horizontal comparison that the Precision and Recall indexes of the propose method is better than another. It can be seen that feature selection, FHR-KNN is another method to solve the imbalance problem of sample classes.
3.3.3 Another ensemble method comparison
This analysis emphasized the use of three ensemble methods on the medical preeclampsia datasets, namely Accuracy, Precision, and Recall. These methods subsequently used four integration techniques, namely Bagging, Adaboost, SGB, and Random Forest (RF). Table 4 shows the classification of the ensemble methods on the dataset.
Table 4. Performance evaluation comparative with an ensemble
|
Algorithm |
Accuracy |
Precision |
Recall |
|
Bagging |
0.99 |
0.92 |
0.92 |
|
RF |
0.99 |
0.75 |
0.83 |
|
Adaboost |
0.95 |
0.49 |
0.50 |
|
SGB |
0.973 |
0.603 |
0.991 |
|
FHR-KNN |
0.99 |
0.95 |
0.95 |
The accuracy of individual classifiers and ensemble learning with hybrid-KNN are shown in Table 5. This indicated an increase in almost all classifier accuracy. From the algorithm comparison with an ensemble classifier, the Accuracy of Bagging, RF, and FHR-KNN are the same (0.99), while the Precision of FHR-KNN is higher (0.95) than another, but for the Recall of FHR-KNN is a little lower than SGB.
Table 5. Performance evaluation
|
Algorithm |
Accuracy |
Precision |
Recall |
|
ROS |
0.61 |
0.67 |
0.61 |
|
RUS Bagging |
0.67 0.99 |
0.72 0.92 |
0.67 0.92 |
|
Borderline |
0.96 |
0.58 |
0.58 |
|
RF |
0.99 |
0.75 |
0.83 |
|
SMOTE |
0.96 |
0.56 |
0.58 |
|
FHR-KNN |
0.99 |
0.95 |
0.95 |
According to several previous reports [5, 6, 42], some classifiers obtained lower results than the proposed Hybrid-KNN model. From the algorithm comparison, the Accuracy of Bagging, RF, and FHR-KNN are equal (0.99) and better than another algorithm, but for Precision and Recall (0.95), FHR-KNN is higher. For Table 5, the prediction of preeclampsia showed the elevation of precision, recall, and accuracy, using several FHR-KNN algorithms.
3.3.4 Algorithm and hyperparameters
In this research we consider a KNN algorithm as implemented in scikitlearn. The parameter ranges that are considered are taken from the automatic machine learning package auto-sklearn. The ranges for KNN can be found in Table 6.
Table 6. Hyperparameter ranges for FHR-KNN
|
Hyperparameter |
Description |
Value |
|
n_neighbors |
A number of neighbors to use by default for kneighbors queries. |
2 |
|
weights |
Weight function used in prediction |
uniform |
|
algorithm |
The algorithm used to compute the nearest neighbors |
Auto |
|
Metric sampling strategy |
Metric to use for distance computation Sampling information to resample the data set |
Minkowski all |
Based on the problem of medical data imbalance, this study proposed the Feature Hybrid Resampling KNN (FHR-KNN) algorithm. In this framework, the contained feature selection method was used to initially select high analytical characteristics. This was accompanied by the use of the Hybrid Resampling method, to balance the datasets for synthesis. These balanced datasets were then classified using KNN. Additionally, the experiment was initially carried out by feature selection and KNN, which optimized the k-value, indicating that the FHR-KNN algorithm was significantly better than some traditional and related resampling models.
In the future, different strategies such as algorithm types (cost-sensitive and active learning), will be discussed to solve the classification problem of multi-class correlation data. In particular, for the medical information of preeclampsia with imbalance.
This research was supported by the Doctoral Program of Information Systems, School of Postgraduate Studies, Diponegoro University, for supporting this research under Postgraduate Incentive Research Grant, Vote No.345-39/UN7.6.7/PP/2022 and Department of Electrical Engineering Politeknik Negeri Semarang Semarang. The authors would like to thank the reviewers for their valuable comments and suggestions that contributed to the improvement and also to Dr. Melyana, Prayitno, Ph.D., who have contributed to a prepared private dataset in this research.
|
TP |
True positive |
|
TN |
True Negative |
|
FP FN |
False Positive False Negative |
|
Dx |
Dataset |
|
Greek symbols |
|
|
μx |
is the mean of X |
|
μy |
is the mean of Y |
|
σx |
{\displaystyle X}is the standard deviation of X |
|
σy |
is the standard deviation of Y |
|
ρ E |
ρ (rho) is population correlation coefficient is the expectation |
[1] Musyoka, F.M., Thiga, M.M., Muketha, G.M. (2019). A 24-hour ambulatory blood pressure monitoring system for preeclampsia management in antenatal care. Informatics in Medicine Unlocked, 16: 100119. https://doi.org/10.1016/j.imu.2019.100199
[2] Costa, M.L., Cecatti, J.G. (2018). Preeclampsia in 2018: revisiting concepts, physiopathology, and prediction. Obstetrics and Gynecology International, 2018: Article ID 6268276. https://doi.org/10.1155/2018/6268276
[3] Zhang, J., Li, H., Zhao, L., Tian, Z., Chen, Y., Zhao, X. (2019). Early prediction of preeclampsia and small-for-gestational-age via multi-marker model in Chinese pregnancies: A prospective screening study. BMC Pregnancy and Childbirth, 19(1): 1-10. https://doi.org/10.1186/s12884-019-2455-8
[4] Jhee, J.H., Kim, K.C., Joo, J.K., Kim, J.T., Kim, Y.K., Park, H.K. (2019). Prediction model development of late-onset preeclampsia using machine learning-based methods. PLoS One, 14(8): e0221202. https://doi.org/10.1371/journal.pone.0221202
[5] Belarouci, S., Chikh, M.A. (2017). Medical imbalanced data classification. Advances in Science, Technology and Engineering Systems, 2(3): 116-124. https://doi.org/10.25046/aj020316
[6] Fahrudin, T., Buliali, J.L., Fatichah, C. (2019). Enhancing the performance of SMOTE algorithm by using attribute weighting scheme and new selective sampling method for imbalanced data set. International Journal of Innovative Computing, Information and Control, 15(2): 423-444. https://doi.org/10.24507/ijicic.15.02.423
[7] Ali, H., Salleh, M.N.M., Saedudin, R., Hussain, K., Mushtaq, M.F. (2019). Imbalance class problems in data mining: A review. Indonesian Journal of Electrical Engineering and Computer Science, 14(3): 1552-1563. https://doi.org/10.11591/ijeecs.v14.i3.pp1552-1563
[8] Chen, Z., Duan, J., Kang, L., Qiu, G. (2021). A hybrid data-level ensemble to enable learning from highly imbalanced dataset. Information Sciences, 554: 157-176. https://doi.org/10.1016/j.ins.2020.12.023
[9] Nwe, M.M., Lynn, K.T. (2020). KNN-based overlapping samples filter approach for classification of imbalanced data. In A. Nagar (Ed.), Proceedings of the International Conference on Computational Intelligence and Data Science, pp. 43-54. https://doi.org/10.1007/978-3-030-24344-9_4
[10] Sun, Y., Wong, A.K.C., Kamel, M.S. (2009). Classification of imbalanced data: A review. International Journal of Pattern Recognition and Artificial Intelligence, 23(4): 687-719. https://doi.org/10.1142/S0218001409007326
[11] Piri, S., Delen, D., Liu, T. (2018). A synthetic informative minority over-sampling (SIMO) algorithm leveraging support vector machine to enhance learning from imbalanced datasets. Decision Support Systems, 106, 15-29. https://doi.org/10.1016/j.dss.2017.11.006
[12] Xu, Z., Shen, D., Nie, T., Kou, Y. (2020). A hybrid sampling algorithm combining M-SMOTE and ENN based on Random forest for medical imbalanced data. Journal of Biomedical Informatics, 107, 103465. https://doi.org/10.1016/j.jbi.2020.103465
[13] Wang, Y.W., Feng, L.Z., Zhu, J.M., Li, Y., Chen, F. (2022). Improved AdaBoost algorithm using misclassified samples oriented feature selection and weighted non-negative matrix factorization. Neurocomputing, 508: 153-169. https://doi.org/10.1016/j.neucom.2022.08.015
[14] Zhao, H., Li, X. (2017). A cost sensitive decision tree algorithm based on weighted class distribution with batch deleting attribute mechanism. Information Sciences, 378: 303-316. https://doi.org/10.1016/j.ins.2016.09.054
[15] Hussein, A.S., Li, T., Yohannese, C.W., Bashir, K. (2019). A-SMOTE: A new preprocessing approach for highly imbalanced datasets by improving SMOTE. International Journal of Computational Intelligence Systems, 12(2): 1412-1422. https://doi.org/10.2991/ijcis.d.191114.002
[16] Upadhyay, K., Kaur, P. (2021). A review on data level approaches to address the class imbalance problem. In Proceedings of the International Conference on Challenges in Engineering, Science and Technology, pp. 1-5. https://doi.org/10.1145/3460319.3460328
[17] Han, H., Wang, W., Mao, B. (2005). Borderline-SMOTE: A new over-sampling method in imbalanced data sets learning. In Advances in Intelligent Computing, pp. 878-887. https://doi.org/10.1007/11538059_91
[18] Guo, H.X., Li, Y.J., Shang, J.F., Gu, M.Y., Huang, Y.Y., Gong, B. (2017). Learning from class-imbalanced data: Review of methods and applications. Expert Systems with Applications, 73: 220-239. https://doi.org/10.1016/j.eswa.2016.12.035
[19] Morais, R., Vasconcelos, G.C. (2017). Under-sampling the minority class to improve the performance of over- sampling algorithms in imbalanced data sets. In International Joint Conference on Artificial Intelligence (IJCAI 2017). Workshop on Learning in the Presence of Class Imbalance and Concept Drift, Melbourne, Australia.
[20] 20Sáez, J.A., Luengo, J., Stefanowski, J., Herrera, F. (2015). SMOTE-IPF: Addressing the noisy and borderline examples problem in imbalanced classification by a re-sampling method with filtering. Information Sciences, 291: 184-203. https://doi.org/10.1016/j.ins.2014.08.051
[21] Li, J., Zhu, Q., Wu, Q., Fan, Z. (2021). A novel oversampling technique for class-imbalanced learning based on SMOTE and natural neighbors. Information Sciences, 565: 438-455. https://doi.org/10.1016/j.ins.2021.03.041
[22] Bunkhumpornpat, C., Sinapiromsaran, K., Lursinsap, C. (2009). Safe-level-SMOTE: Safe-level-synthetic minority over-sampling technique for handling the class imbalanced problem. Lecture Notes in Computer Science, 5476: 475-482. https://doi.org/10.1007/978-3-642-01307-2_43
[23] García, V., Sánchez, J.S., Mollineda, R.A. (2012). On the effectiveness of preprocessing methods when dealing with different levels of class imbalance. Knowledge-Based Systems, 25(1): 13-21. https://doi.org/10.1016/j.knosys.2011.06.013
[24] He, H., Bai, Y., Garcia, E., Li, S. (2008). ADASYN: Adaptive synthetic sampling approach for imbalanced learning. In IEEE International Joint Conference on Neural Networks, 2008, IJCNN 2008, pp. 1322-1328. https://doi.org/10.1109/IJCNN.2008.4633969
[25] Zhu, C., Wang, Z. (2017). Entropy-based matrix learning machine for imbalanced data sets. Pattern Recognition Letters, 88: 72-80. https://doi.org/10.1016/j.patrec.2017.01.014
[26] Douzas, G., Bacao, F., Last, F. (2018). Improving imbalanced learning through a heuristic oversampling method based on k-means and SMOTE. Information Sciences, 465: 1-20. https://doi.org/10.1016/j.ins.2018.06.056
[27] Taunk, K., De, S., Verma, S., Swetapadma, A. (2019). A brief review of nearest neighbor algorithm for learning and classification. 2019 International Conference on Intelligent Computing and Control Systems, 1255-1260. https://doi.org/10.1109/ICCS45141.2019.9065747
[28] Alkhasawneh, M.S. (2022). Software defect prediction through neural network and feature selections. Applied Computational Intelligence and Soft Computing, 2022: 1-16. https://doi.org/10.1155/2022/2581832
[29] Islam, A., Belhaouari, S.B., Rehman, A.U., Bensmail, H. (2022). KNNOR: An oversampling technique for imbalanced datasets. Applied Soft Computing, 115: 108288. https://doi.org/10.1016/j.asoc.2021.108288
[30] Nair, P., Kashyap, I. (2020). Classification of medical image data using k nearest neighbor and finding the optimal k value. International Journal of Science and Technology Research, 9(4): 221-226.
[31] Beckmann, M., Ebecken, N.F.F., Pires de Lima, B.S.L. (2015). A KNN undersampling approach for data balancing. Journal of Intelligent Learning Systems and Applications, 7(4): 104-116. https://doi.org/10.4236/jilsa.2015.74010
[32] Wang, L., Han, M., Li, X., Zhang, N., Cheng, H. (2021). Review of classification methods on unbalanced data sets. IEEE Access, 9: 64606-64628. https://doi.org/10.1109/ACCESS.2021.3074243
[33] Shardlow, M. (2016). An analysis of feature selection techniques. University of Manchester, 14(1): 1-7.
[34] Chen, H.M., Li, T.R., Fan, X., Luo, C. (2019). Feature selection for imbalanced data based on neighborhood rough sets. Information Sciences, 483: 1-20. http://dx.doi.org/10.1142/S0218001409007326
[35] Liu, J., Zio, E. (2019). Integration of feature vector selection and support vector machine for classification of imbalanced data. Applied Soft Computing Journal, 75: 702-711. https://doi.org/10.1016/j.asoc.2018.11.045
[36] Bekkar, M., Djemaa, H.K., Alitouche, T.A. (2013). Evaluation measures for models assessment over imbalanced data sets. Journal of Information Engineering and Applications, 3(10): 27-38.
[37] Yildirim, M., Cinar, A. (2019). Classification of Alzheimer’s disease MRI images with CNN based hybrid method. Ingénierie des Systèmes d'Information, 25(4): 413-418. https://doi.org/10.18280/isi.250402
[38] Sajja, V.R., Kalluri, H.K. (2020). Classification of brain tumors using convolutional neural network over various SVM methods. Ingénierie des Systèmes d’Information, 25(4): 489-495. https://doi.org/10.18280/isi.250412
[39] Tarimo, C.S., Bhuyan, S.S., Li, Q., Ren, W., Mahande, M.J., Wu, J. (2021). Combining resampling strategies and ensemble machine learning methods to enhance prediction of neonates with a low apgar score after induction of labor in Northern Tanzania. Risk Management and Healthcare Policy, 14: 3711-3720. https://doi.org/10.2147/RMHP.S331077
[40] He, H., Zhang, W., Zhang, S. (2018). A novel ensemble method for credit scoring: Adaption of different imbalance ratios. Expert Systems with Applications, 98: 105-117. https://doi.org/10.1016/j.eswa.2018.01.012
[41] Rajesh, K.N.V.P.S., Dhuli, R. (2018). Classification of imbalanced ECG beats using re-sampling techniques and AdaBoost ensemble classifier. Biomedical Signal Processing and Control, 41: 242-254. https://doi.org/10.1016/j.bspc.2017.12.004
[42] Kumar, P., Bhatnagar, R., Gaur, K., Bhatnagar, A. (2021). Classification of imbalanced data: Review of methods and applications. IOP Conference Series: Materials Science and Engineering, 1099(1): 012077. https://doi.org/10.1088/1757-899X/1099/1/012077