Melly Elvira*![]() | Badrun Kartowagiran
| Badrun Kartowagiran![]() | Heri Retnawati
| Heri Retnawati![]() | Syamsir Sainuddin
| Syamsir Sainuddin![]() | Eli Rohaeti
| Eli Rohaeti![]()
© 2023 IIETA. This article is published by IIETA and is licensed under the CC BY 4.0 license (http://creativecommons.org/licenses/by/4.0/).
OPEN ACCESS
Diversity is a hot issue discussed in the world of education. With its diversity, Indonesia has great potential to study such things as the geographical diversity equalization factors that affect the quality of education. Implementation of national examinations (NE) as a benchmark and standards from primary to secondary education have a different condition for each location, such as Daerah Istimewa Yogyakarta (DIY) representing the West and Nusa Tenggara Timur (NTT) representing the western region of Indonesia. The focus of this research is to find out how much difference the ability of junior high school students in Indonesia in terms of geographical location. This study uses five DIF detection methods for mathematics NE 2013/2014 school year to analyze students' different abilities. The analysis results show that, in general, the NE questions for the 2013/2014 academic year benefit the focal group / NTT on Algebra, Geometry, and Statistics/Probability material, although with lower ability compared to group reference /DIY. With the analysis carried out, policymakers can take corrective steps to focus more on fixing problems, facilities, and resources teacher power so that problem inequality from aspect geographical there is no future again in Indonesia.
Differential item function, national examinations, bias geographic
Indonesia is a country that is rich in human resources, natural resources, ethnic groups, regional languages, islands, and many others. In addition, Indonesia is also a country intensively making efforts to equalize development in various sectors such as infrastructure development and various quality improvement efforts such as education to compete with other countries. Indonesian students actively participate in assessment activities to find out Indonesia's position at the international level [1]. Such as the Program for International Students Assessment (PISA) and Trends in International Mathematics and Science Study (TIMSS) to determine the ability of Indonesian students nationally. NAs are carried out periodically, evaluated, and standardized every year.
Various countries use individual data to determine the progress of learning outcomes for each student [2, 3]. One way that is done by several countries is to focus on the results of NE such as Japan, Bangladesh, Uruguay, and several other countries [4]. Of course, each country has a different standard and focus [5, 6]. In Indonesia, a national exam evaluates student learning outcomes implemented since 2005, focusing on language, math, and social science scores [7].
One of the subjects that focus on the NE in Indonesia is mathematics; Indonesia actively participates in activities and the national exam. However, assessments such as PISA TIMSS show that the scores obtained by Indonesia are consistently below the average [8]. According to PISA data, Indonesia only got a math score of 386 out of an average of 490 in 2015 [9]. TIMSS data shows that Indonesia got a score of 386 for an average 500 in 2011 [10]. This figure is still far different from neighboring countries such as Malaysia, Vietnam, and Thailand. This fact is a question mark for us because the quality of Indonesian education, especially the results of mathematics exams, is very far from the target in terms of international scale.
Indonesia has many potentials exciting to study education in various conditions, such as geography, ethnicity, and religion. With situations that are unique and diverse. The position also affects education in Indonesia, one of the gaps in the quality of education in geography terms [11]. The location between western Indonesia is close to the center of government compared with the eastern part of Indonesia [3]. So the NE into the pros and cons by various circles in Indonesia, mainly when used as the sole criterion NE graduation for students and the determination of the quality of education a particular area so that impact a variety of fraud [12]. It could be due to one of them because there is inequality in education quality mapping of geo. It can be seen from the test results of the subjects tested, especially the NE in 2013/2014. it is shown that the difference value of mathematics courses is striking between the provinces of Daerah Istimewa Yogyakarta (DIY)=6.25 and Nusa Tenggara Timur (NTT)=5.02. This information is based on data from the education assessment center in 2014.
According to Muttaqin [13], the Indonesian government has made various efforts, such as establishing a 12-year compulsory education policy, raising the standard for national exam scores, and decentralizing education. This effort aims to achieve the target of universally equitable education, but the goal of increasing access and quality of education, while reducing inequality, is still far from being expected. Some forms of inequality that occur in Indonesia include:
First, inequality in the group of students from rich and poor economic groups in the age range of 13 to 15 years, 96 percent of students from rich families complete their education in 7 years, while only 80 percent for students from poor households [13]. Second, in terms of access, there are still more than half a million children aged 7 to 15 years who have never set foot in school in their entire life, and a total of more than 1.7 million children drop out of school before completing the nine-year compulsory education [13]. Third, in terms of competence, 55 percent of Indonesian students scored below the average according to the Program for International Student Assessment (PISA), 43 percent averaged, and only 2 percent scored above the average [14]. Fourth, in terms of quality, national examination scores of students in private schools are still lower than their counterparts in public schools, and there is also large variation within and between Islamic private schools.
Based on this explanation, it is clear that the inequality that occurs generally comes from the quality and competence of students, but data from the education assessment center in 2014 shows that several regions, especially those from the western provinces of Indonesia, have better scores than the eastern regions of Indonesia. This is something that is interesting to study considering that there has been no special study that discusses the geographical factor of the education gap.
Since there is an educational gap in Indonesia, one of them is the student competency factor which is generally taken on average based on the UN scores. In fact, some western regions, such as DIY, which have good access to education, have an average math exam score above the national average, while eastern regions like NTT have an average math exam score below the national average the education assessment center in 2014. The mathematics exam given consists of four materials, namely arithmetic operations, geometry, algebra, and statistics and probability. The researcher wants to investigate what items are the source of bias between the western and eastern regions of Indonesia with several DIF detection methods.
The gap results of NE in western and eastern regions of Indonesia can occur because of bias in items about the NA. Discrimination occurs when an imbalanced item is an item about favorable score a particular group [6]. The gap results of the NE because of the inequality score between regions can be caused by test items and, therefore, not test items [15-17]. Inequality is caused by the test item that's called biased items. Hambleton et al. [18] express understanding that item bias of individuals who have the same abilities of different groups do not have the same probability of replying with the correct item [18], Items that could potentially bias then analyzed with logic and why these items are relatively more difficult for one group [19]. When an item is somewhat more difficult for a group, and these difficulties are irrelevant to construct tests, that item is biased [20]. Some experts are replacing the term bias items with names Differential Item Function (DIF) [17, 20, 21]. We can express biased items mathematically in terms of probability equations.
Inequality score strived reduced, or at least a significant detected and direction [22, 23]. The detection results can be used for correction or repair items in the past about dating. Thus the necessary measurement and analysis more in some material mathematical possibility of bias when answered by the students [24]. Terms in measuring the test device need to be valid and reliable to obtain the measurement results following what is calculated. To determine the quality of a measuring instrument psychometric test should be conducted on the devices [17, 25]. Experts have established psychometric criteria for a psychological measuring instrument to be declared a good measuring tool [15]. They can provide information that is not misleading.
Invariant identification of interesting measurements to be discussed today. Consistent or measure bias an item known as the Differential Item Functioning (DIF) [26] with a variety of methods that can be performed to identify the functioning of the different items to two or more distinct groups in a test/exam, e.g., methods Item Response Theory (IRT) and a non-IRT [27].
Conceptually, the DIF is said to appear on an item problem. Suppose participants have the same capability to construct measured by the test but from a different group. In that case, they have a different probability of answering the question correctly [28]. For example, measure the same construct only one ability or unidimensional and diverse groups such as men and women. Next [17] argued that an item shows DIF if the test taker has the same ability in a different group and does not have the same probability of responding well.
Various studies on DIF focus on gender bias, a second language, age, and culture [16, 29, 30], but little has been discussed about the geographical conditions. This layout lies within the region with the central government. A regional grouping in Indonesia was divided into three groups Western, Central, and East. This problem becomes a probability for researchers to look at the gap NE by regional groups.
Generally, there are two types of DIF [15] namely 1) uniform DIF and non-uniform DIF. Uniform DIF appears if the advantage of one group over another occurs at every level of ability, and 2) non-uniform DIF appears if the benefit of one group over another does not happen in every capacity. Suppose it is associated with interaction in the statistical analysis of variance. In that case, uniform DIF occurs if there is no interaction between the ability level of participants and group membership, and non-uniform DIF occurs if there is an interaction between the test participant's ability level and group membership [14]. To determine whether a DIF indicates an item or not, a DIF index is needed, which is an index that shows as strong as a DIF indication is in the item. In the context of item response theory, whether or not DIF occurs on a question item lies in the item response function (Item Response). Part) for the item in the group in question. The response function's curve is called the item response curve or characteristic curve. Research detects the existence of DIF on test items, with divided population into two groups, namely the focal group and the reference group. A focal group is a group that is investigated whether there are items that contain DIF in that group. A reference group is a comparison group.
Based on the conditions in the field, which show that the score inequality causes the gap in the quality of education to be one of the most exciting probabilities to study, namely the existence of a bias in the results or DIF NE items based on regional groupings. Furthermore, it is hoped that some items of NE questions that are biased between the western region will be represented from the NE results data for SMP DIY students and the eastern part represented by NTT. Of course, to obtain more accurate results, a DIF detection method will be carried out using the IRT and non-IRT methods.
The gap in the realm of education is a challenge in itself experienced by Indonesia, despite various efforts made, there are still some challenges in its application. In this study, the researchers attempted to analyze the gap in the math UN scores between the western region of Indonesia represented by DIY and the eastern region represented by NTT. The National Examination Response data for the 2013/2014 academic year by students from each region were analyzed for each item using the DIF detection method, both using the IRT and classical/non-IRT approaches. The results of the analysis then produce items that contain DIF, provide information on the effect/magnitude of DIF contained in each item, and provide information on the group that benefits from each item. The items that contain the DIF are analyzed further so that a complete picture is obtained of what materials need to be considered for the Mathematics National Examination questions and what steps need to be taken by policy makers. More complete results can be seen in the results and discussion in this paper.
A fair/good rating item, at least avoids three things, first, item impact, second, item differential function (DIF) and third, item bias [31]. Item impact is evidence that occurs when test takers from different groups have different opportunities to correctly answer an item, which is caused by differences in the actual ability of the two groups to measure the item. DIF appears when test takers from different groups show different opportunities to answer an item correctly, but their abilities match, or they have the same ability. Meanwhile, item bias arises when participants from one group are less likely to answer an item correctly than another group because a number of characteristics of the item or test situation are not relevant to the purpose of the test [32].
DIF arises when items are substantially more difficult for one group than for another, after all differences in the subject matter tested have been accounted for [32]. The DIF analysis is based on the principle of comparing the performance of a focus group (e.g. women) with items with a reference group (e.g. men), controlling for the knowledge being tested. DIF not only means that an item is more difficult for one group than for another but also if participants in one group tend to know more of the test subject than the other group, they will perform better on all test items. Therefore, once DIF is identified on an item, it can be associated with the emergence of item bias or item impact [33-35].
Several articles have attempted to identify several sources of item bias that cause DIF. Several previous studies related to DIF compared group performance based on ease of access [13], school status (private and public) [13, 36], and gender [32-34].
Generally, previous research only looked at the source of inequality only from differences in gender and school status, while many factors such as location/geography bias as a result of the uneven distribution of educational facilities and infrastructure between the western region which is close to the State Capital and the eastern part of Indonesia. This is what distinguishes the research study from previous research. The method used is adapted to the common DIF detection method, namely the IRT and Classical/non-IRT [15, 35, 36].
3.1 Research desig
This research is an explorative, descriptive study to determine how much a difference is in the ability of junior high school students in Indonesia in terms of geographical location. It refers to detecting differential item functioning (DIF) functional loadings with classical and modern methods (IRT) on the NA Junior High School test Mathematics in the 2013/2014 academic year.
The problem in this research is that the gap results of NE in the western and eastern regions of Indonesia can occur because of bias in the item about NA. Discrimination occurs when there is an imbalance item is an item about favorable score a particular group. The gap results of the NE because of the inequality score between regions can be caused by test items and therefore, not test items.
Based on field conditions that indicate lameness score cause gaps in the quality of education, one probability of bias or DIF result item-based NE regional grouping. Furthermore, the researcher will represent some of the Items Expected to be visible to The NE bias between the western region on the data results of the NE DIY junior high school students and the eastern part represented by NTT. Of course, to obtain more accurate results, the DIF analysis detection method uses IRT and non-IRT. From the analysis, results containing items will then be identified as indicators of DIF within the NE that has the inequality between western and eastern Indonesia.
3.2 Sample and data collection
The sample in this study was students from junior high schools in Yogyakarta and NTT who took the Mathematics National Examination for the 2013/2014 academic year. The sample selection was based on the representation of the western region of Indonesia, represented by the province of DIY, while the eastern region of Indonesia was represented by NTT. Another consideration is the average score of the Mathematics National Examination in DIY is more than the national average, while the average national exam score in NTT is below the national average. These two considerations are the reasons for choosing the two provinces as samples in this study. The data used in this study were obtained from responses from samples working on multiple choice objective mathematical problem items consisting of 40 dichotomous items. In this case, the NTT Group is the Focal group, while DIY is the reference group. In this study, the technique used in collecting data is the documentation technique, by collecting students' responses to the mathematics NE test in DIY and NTT. One thousand students each were selected based on the ability level for each region, which is 30% the lower group, 40% the moderate group, and 30% the upper group.
3.3 Data analysis
According to Cutright [27], methods for detecting DIF can be divided by the number of groups, approaches, and types of DIF itself. The DIF method consists of two groups; the first method is the classical/non-IRT approach. This method includes the mantle-haenzel method, standardization, SIBTEST, and logistic regression. This method uses the row score of each respondent and the second method uses the IRT approach, namely the LRT, Lord, and Raju methods. Any technique can be used without purification/purification. The following groupings DIF detection method we present in the Table 1:
Table 1. DIF detection Method using the R
|
Approach |
DIF shape |
Number of Groups |
|
|
2 |
>2 |
||
|
Non-IRT |
Uniform |
Mantel-Haenszel * Standardization * SUBSET Logistic regression * |
pairwise comparisons Generalized Mantel-Haenszel* |
|
Non-IRT |
Nonuniform |
Logistic regression * Breslow-Day * NU.MH NU.SUBSET |
pairwise comparisons |
|
ART |
Uniform |
LRT * Lord * Raju * |
pairwise comparisons Generalized Lord * |
|
ART |
Nonuniform |
LRT * Lord * Raju * |
pairwise comparisons Generalized Lord * |
* Means it can be applied to the package "DifR."
This procedure begins by dividing the data into several groups with a range of specific abilities (ability groups). Then the researchers create a table with two rows and two columns for each group's ability. Focal group (f) is a group harmed by the presence of DIF. In contrast, the reference group is the group that became the basis of comparison for assessing the presence of DIF. If there are M group's abilities, the researchers will compile the Table 1 above as M. The method of detecting DIF on this occasion uses three methods for non-IRT. Classical methods include the Mantel-Heanzel method, Standardization Method, and Logistic Regression Methods [28, 37]. Modern methods for utilizing the IRT approach are the method of Lord and Raju [28].
DIF detection methods were performed using the R program using the difR package [27, 28]. On this occasion, the data used dichotomy result NE Mathematics by comparing two groups of respondents, a group of students from NTT as a focal group and a group of students of Yogyakarta as the reference group. Researchers took 1000 samples from each group. In this Article, we analyze the 39 items because item 21 did not meet the analysis criteria (could not be answered correctly by the sample used) so it was excluded from the data analysis. The results of DIF analysis are continued by doing analysis UN items that contain DIF. Early analysis is to examine the DIF signification of each item in general and determine the category of difficulty based on the criteria presented in Table 2.
Table 2. Item difficulty category
|
Category |
Score Interval |
|
Very Difficult |
x>1.0 |
|
Difficult |
0.5<x≤1 |
|
Medium |
-0.5≤x≤0.5 |
|
Easy |
-1.0≤x<-0.5 |
|
Very Easy |
x<-1.0 |
Furthermore, DIF analysis is carried out specifically using five selected methods. The results of analysis that produce statistical values based on each DIF method are classified into three levels, namely A, B, and C. This level shows the effect / magnitude of the DIF loaded by each item. Table 3 describes the statistical value limits of the method used.
Table 3. DIF Level interpretation based on five methods
|
Level |
A |
B |
C |
|
|
Method |
MH |
|ΔMH|<1 |
1 ≤|ΔMH|<1.5 |
|ΔMH|≥ 1.5 |
|
STD |
|ΔSTD|<1 |
1 ≤|ΔSTD|<1.5 |
|ΔSTD|≥ 1.5 |
|
|
LOG |
ΔR2 < 0.35 |
0.35 ≤ ΔR2 < 0.70 |
ΔR2 ≥ 0.2 |
|
|
Lord |
|ΔLORD|<1 |
1 ≤|ΔLORD|<1.5 |
|ΔLORD|≥ 1.5 |
|
|
Raju |
|ΔRAJU|<1 |
1 ≤| ΔRAJU |<1.5 |
| ΔRAJU |≥ 1.5 |
|
|
DIF effect |
Low |
Medium |
High |
|
The item about the NE in the study is grouped into four subject matters: arithmetic operation, Algebra, Geometry, and Statistics / Probability. The analysis next is the categorization and count of the number of items that are experiencing DIF are based on the following criteria (Table 4):
Table 4. Categorization of items containing DIF by five methods
|
No |
Category |
Criteria |
|
1 |
No problem |
Item does not load DIF for all methods |
|
2 |
Less Problem |
There are 1-2 methods that declare items to load DIF |
|
3 |
Troubled Enough |
Three methods declare an item to load a DIF |
|
4 |
Troubled |
Four methods declare an item to load a DIF |
|
5 |
Very Troubled |
All methods declare items contain DIF |
3.4 Step analysis using the R. program
(1) Prepare data in extension *. CSV on Microsoft excel or can also be in the form of a file extension *. sav in the SPSS program on a specific file.
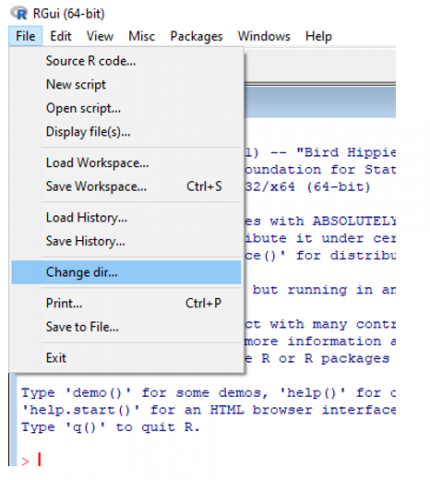
(2) Open the Program Application and settings directory by clicking FILE → Change dir as Figure 1. Find the folder that contains the folder that contains the files to be analyzed, then click OK.
Figure 1. Change directory
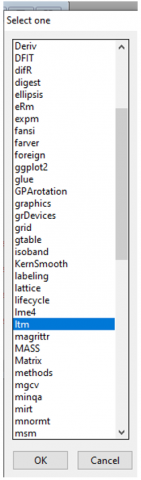
(3) Choose a Package that supports analysis difR, namely mirt, ltm, lme4, deltaPlotR; by clicking Packages → load package, a menu like a Figure 2 will appear. Then select the package to use and click Ok.
Figure 2. Selectable package download
(4) The next step is to import data by writing the following syntax: >data<-read.csv(file="DATA UN.csv ", header=T) #(data csv)>data<-read.spss(file="DATA UN.sav", to.data.frame =TRUE)#(SPSS data).
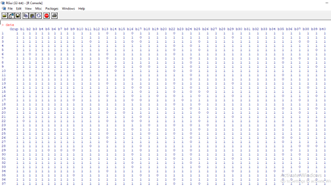
(5) Displays data by writing the following syntax: >data. Then the display will appear as shown in Figure 3:
Figure 3. Data analysis
(6) DIF analysis. The first method used is an analysis using the Mantel -Heanzel method. The syntax used is as follows: MH<-difMH (data, group="Group", focal.name=2, purify=TRUE, nrIter=20, save.output=TRUE, output=c("MHresults", "default")).
(7) Output analysis can be viewed by writing the following syntax in the R Console.
>MH
(8) R console output is as follows: >MH
Detection of Differential Item Functioning using Coat- Haenszel method with continuity correction and with item purification.
Results based on asymptotic inference
Convergence reached after five iterations
Matching variable: test score
No set of anchor items was provided
No p-value adjustment for multiple comparisons
Coat- Haenszel Chi- square statistics:
stats. P- value
it1 1.1462 0.2843
it2 13.7604 0.0002 ***
it3 1.6933 0.1932
it4 44.6885 0.0000 ***
it5 21.8019 0.0000 ***
it6 162.9540 0.0000 ***
it7 0.4404 0.5069
it8 12.7616 0.0004 ***
it9 0.0451 0.8318
it10 25.2172 0.0000 ***
it11 44.4657 0.0000 ***
it12 40.8461 0.0000 ***
it13 207.1702 0.0000 ***
it14 113.9957 0.0000 ***
it15 18.4669 0.0000 ***
it16 70.7143 0.0000 ***
it17 45.0143 0.0000 ***
it18 21.0977 0.0000 ***
it19 1.1558 0.2823
it20 0.0002 0.9886
it21 12.7633 0.0004 ***
it22 37.5032 0.0000 ***
it23 0.7144 0.3980
it24 6.2192 0.0126 *
it25 6.4163 0.0113 *
it26 3.1205 0.0773.
it27 35.7052 0.0000 ***
it28 53.8681 0.0000 ***
it29 0.1717 0.6786
it30 9.6330 0.0019 **
it31 87.9321 0.0000 ***
it32 20.9872 0.0000 ***
it33 0.3241 0.5691
it34 181.3080 0.0000 ***
it35 23.7732 0.0000 ***
it36 63.0233 0.0000 ***
it37 0.0006 0.9803
it38 0.0000 0.9952
it39 10.7247 0.0011 **
Significant. codes: 0 '***' 0.001 '**' 0.01 '*' 0.05 '.' 0.1 ' ' 1
Detection threshold: 3.8415 (significance level: 0.05)
Items detected as DIF items:
it2
it4
it5
it6
it8
it10
it11
it12
it13
it14
it15
it16
it17
it18
it21
it22
it24
it25
it27
it28
it30
it31
it32
it34
it35
it36
it39
Effect size (ETS Delta scale):
Effect size code:
'A': negligible effect
'B': moderate effect
'C': large effect
alphaMH deltaMH
it1 0.8700 0.3271 A
it2 0.6586 0.9813 A
it3 0.8486 0.3859 A
it4 0.4546 1.8524 C
it5 0.5767 1.2936 B
it6 0.2004 3.7775 C
it7 0.9176 0.2020 A
it8 0.6290 1.0896 B
it9 1.0307 -0.0711 A
it10 0.5474 1.4160 B
it11 0.4532 1.8600 C
it12 0.4558 1.8465 C
it13 0.1541 4.3941 C
it14 0.2633 3.1357 C
it15 0.5882 1.2471 B
it16 0.4045 2.1271 C
it17 0.4482 1.8860 C
it18 0.5965 1.2140 B
it19 0.8793 0.3023 A
it20 1.0085 -0.0200 A
it21 0.6523 1.0042 B
it22 1.9418 -1.5595 C
it23 1.1029 -0.2302 A
it24 0.7253 0.7548 A
it25 1.3416 -0.6907 A
it26 1.2263 -0.4795 A
it27 2.0019 -1.6311 C
it28 0.4218 2.0288 C
it29 1.0563 -0.1288 A
it30 1.4417 -0.8596 A
it31 3.2969 -2.8035 C
it32 1.6514 -1.1788 B
it33 1.0710 -0.1612 A
it34 0.12012 3.7683 C
it35 1.7805 -1.3556 B
it36 0.4083 2.1048 C
it37 1.0036 -0.0084 A
it38 0.9945 0.0130 A
it39 1.4475 -0.8692 A
Effect size codes: 0 'A' 1.0 'B' 1.5 'C'
(for absolute values of 'deltaMH')
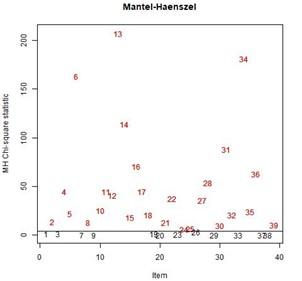
The first paragraph shows the DIF detection method used, using the Mantel -Heanzel method, and purification carried out for up to 5 iterations. Its output is the statistical value chi-square, p-value, and the significance level of the item containing the DIF. The second output shows the items containing the DIF. Moreover lastly, it shows the estimated value of alphaMH, deltaMH, and the effect category of DIF for each item.
(9) Visually, items containing DIF using the Mantel-Heanzel method can be observed using the following syntax: Plot (MH). So that the output appears as in Figure 4:
Figure 4. Coat– Haenszel statistics and detection threshold
The same way can be done to specify DIF and Graph values for other methods with the following syntax:
# DIF detection using standardization method
STD<-difStd (data, group="Group", focal.name=2, purify =TRUE, nrIter=20, save.output=TRUE, output=c("Stdresults", "default"))
# Graphics devices
plot (STD)
#DIF detection using logistics regression method
LOG<- difLogistic (data, group = "Group", focal.name = 2, purify = TRUE, nrIter = 20, save.output = TRUE, output = c(" Stdresults "," default "))
# Graphics devices
plot (LOG)
# DIF detection using Lord's chi-squared method
LORD<- difLord (data, group = "Group", focal.name = 2, model = "1PL", purify = TRUE,engine = "lme4", save.output = TRUE, output = c(" LordResults "," defaults "))
# Graphics devices
plot (LORD)
# DIF detection using Raju's area method.
RAJU1<- difRaju (data, group = "Group", focal.name = 2, model = "1PL", purify = TRUE,signed = TRUEsave.output = TRUE, output = c(" RAJUresults "," default "))
# Graphics devices
plot (RAJU)
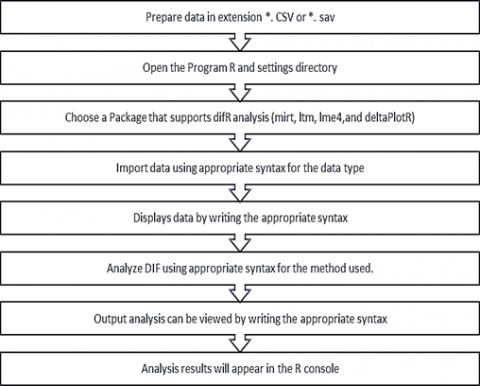
Briefly, the steps of DIF analysis using Program R are presented in the flow chart in Figure 5.
Figure 5. DIF analysis using Program R
The analysis results show the characteristics of the NE items used to detect DIF. The results of the DIF analysis using five different methods are presented in table y, a description of the abilities of NE participants, the relationship between the abilities of NE participants and the distribution of item difficulty, and finally shows the distribution of items containing DIF in NE material.
Table 5 shows that 26 significant items contain DIF, meaning that only 33.3% of items are free from the DIF. There is one very Easy item, nine easy items, 24 medium items, and five difficult items from the difficulty level. Judging from the composition of the level of difficulty of the UN, the NE test kit is quite good because 60% of the items have a level of difficulty in the medium category. In contrast, the other 40% are evenly distributed for other categories.
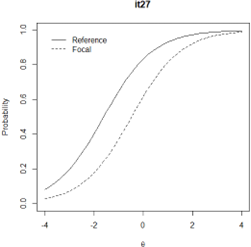
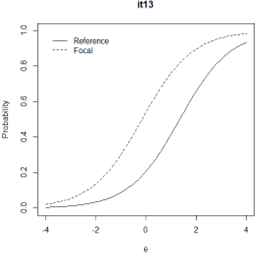
Table 6 shows the estimated DIF value and DIF load effect level for each item from five different methods that have been analyzed with the R program. In addition to the estimated DIF value, groups that benefit from items containing DIF are also presented based on the DIF value of each method. If the DIF value is positive, the focal group benefits from this item, while the DIF value is negative, the reference group benefits. Especially for the Logistics Regression method, the determination of the group that benefits can be observed by looking at the graph of each item. If the reference group's graph is above focal, as in Figure 6, vice versa, if chart group reference is at on group focal like Figure 7, it means group reference more benefited. If the graph intersects, the group with more wide area _ big more benefited. Full results about the chart of each item for Logistic method regression see the attachment.
Besides the item's characteristics, the researcher also describes ability focal and reference groups. Table 7 shows description ability group focal and reference covers average score, grade maximum, and minimum and deviation standards for each group. The presented score consists of a row or Mark raw of each student and scores on the logit scale.
Table 5. The results of DIF significance and item difficulty
|
Item Code |
Static Items |
Difficulty Items |
|||
|
Chisq |
p-value |
Significance of DIF Load |
Difficulty Index |
Level |
|
|
it1 |
1498,791 |
1.0000 |
Significant |
-0.7933 |
Easy |
|
it2 |
1817,417 |
0.9980 |
Significant |
-0.4638 |
Currently |
|
it3 |
1464,414 |
1.0000 |
Significant |
-0.7509 |
Easy |
|
it4 |
1542,721 |
1.0000 |
Significant |
-0.4613 |
Currently |
|
it5 |
1662,142 |
1.0000 |
Significant |
-0.5773 |
Easy |
|
it6 |
1505,309 |
1.0000 |
Significant |
-0.5679 |
Easy |
|
it7 |
1536,619 |
1.0000 |
Significant |
-0.5097 |
Easy |
|
it8 |
1383,174 |
1.0000 |
Significant |
-0.1254 |
Currently |
|
it9 |
2240,014 |
0.0000 |
Not significant |
0.0197 |
Currently |
|
it10 |
1642004 |
1.0000 |
Significant |
-0.3837 |
Currently |
|
it11 |
1496,025 |
1.0000 |
Significant |
-0.5256 |
Easy |
|
it12 |
1506.807 |
1.0000 |
Significant |
-0.2928 |
Currently |
|
it13 |
2135,392 |
0.0170 |
Not significant |
0.8324 |
Difficult |
|
it14 |
1558,552 |
1.0000 |
Significant |
-0.4065 |
Currently |
|
it15 |
1525.508 |
1.0000 |
Significant |
-0.3360 |
Currently |
|
it16 |
2374,379 |
0.0000 |
Not significant |
0.2671 |
Currently |
|
it17 |
2462,191 |
0.0000 |
Not significant |
0.5896 |
Difficult |
|
it18 |
2155,693 |
0.0080 |
Not significant |
0.3845 |
Currently |
|
it19 |
1925.017 |
0.8800 |
Significant |
0.2671 |
Currently |
|
it20 |
1753,388 |
1.0000 |
Significant |
-0.1614 |
Currently |
|
Item Code |
Static Items |
Difficulty Items |
|||
|
Chisq |
p-value |
Significance of DIF Load |
Difficulty Index |
Level |
|
|
it21 |
2968,048 |
0.0000 |
Not significant |
0.9288 |
Difficult |
|
it22 |
2064,715 |
0.1490 |
Significant |
-0.1093 |
Currently |
|
it23 |
2951,127 |
0.0000 |
Not significant |
0.5251 |
Difficult |
|
it24 |
2572.092 |
0.0000 |
Not significant |
0.8432 |
Difficult |
|
it25 |
2228,474 |
0.0000 |
Not significant |
0.3280 |
Currently |
|
it26 |
1650.607 |
1.0000 |
Significant |
-0.0574 |
Currently |
|
it27 |
1739,634 |
1.0000 |
Significant |
-0.5077 |
Easy |
|
it28 |
2213.45 |
0.0010 |
Not significant |
0.2345 |
Currently |
|
it29 |
1643,148 |
1.0000 |
Significant |
-0.2202 |
Currently |
|
it30 |
1630,804 |
1.0000 |
Significant |
0.0446 |
Currently |
|
it31 |
2099,081 |
0.0580 |
Significant |
-1.0948 |
Very easy |
|
it32 |
1840,876 |
0.9950 |
Significant |
0.0332 |
Currently |
|
it33 |
1906,943 |
0.9290 |
Significant |
0.0446 |
Currently |
|
it34 |
2869.114 |
0.0000 |
Not significant |
0.2439 |
Currently |
|
it35 |
1796,461 |
1.0000 |
Significant |
-0.5354 |
Easy |
|
it36 |
2361,682 |
0.0000 |
Not significant |
0.1585 |
Currently |
|
it37 |
1940,669 |
0.8210 |
Significant |
-0.2834 |
Currently |
|
it38 |
2521.012 |
0.0000 |
Not significant |
-0.6308 |
Easy |
|
it39 |
1899,488 |
0.9440 |
Significant |
-0.2065 |
Currently |
Table 6. MH, STD, Lord, and Raju Hasil results
|
Items |
MH |
STD |
LOG |
LORD |
RAJU |
DIF detect. results |
Adv. Group |
Material |
|||||
|
MH |
Lv |
Std |
Lv |
R 2 |
Lv |
Lord _ |
Lv |
Raju |
Lv |
||||
|
it1 |
0.33 |
- |
-0.19 |
- |
0.00 |
- |
-0.66 |
A |
-0.66 |
A |
2/5 |
Ref. |
Arit. |
|
it2 |
0.98 |
A |
0.59 |
- |
0.00 |
A |
0.34 |
- |
0.34 |
- |
2/5 |
Ref. |
Arit. |
|
it3 |
0.39 |
- |
-0.02 |
- |
0.00 |
- |
-0.59 |
A |
-0.59 |
A |
2/5 |
Ref. |
Arit. |
|
it4 |
1.85 |
C |
1.14 |
B |
0.01 |
A |
0.69 |
- |
0.69 |
- |
3/5 |
foc. |
Arit. |
|
it5 |
1.29 |
B |
0.65 |
- |
0.00 |
A |
0.33 |
- |
0.33 |
- |
2/5 |
foc. |
Arit. |
|
it6 |
3.78 |
C |
2.55 |
C |
0.04 |
B |
2.23 |
C |
2.23 |
C |
5/5 |
foc. |
Arit. |
|
it7 |
0.20 |
- |
-0.26 |
- |
0.00 |
A |
-0.86 |
A |
-0.86 |
A |
3/5 |
Ref. |
Arit. |
|
it8 |
1.09 |
B |
0.37 |
- |
0.00 |
- |
-0.48 |
A |
-0.48 |
A |
3/5 |
Ref. |
Arit. |
|
it9 |
-0.07 |
- |
-0.41 |
- |
0.02 |
A |
-0.54 |
A |
-0.54 |
A |
3/5 |
Ref. |
Arit. |
|
it10 |
1.42 |
B |
0.78 |
- |
0.00 |
A |
0.28 |
- |
0.28 |
- |
2/5 |
foc. |
Arit. |
|
it11 |
1.86 |
C |
1.16 |
B |
0.01 |
A |
0.73 |
- |
0.73 |
- |
3/5 |
foc. |
Alg. |
|
it12 |
1.85 |
C |
1.08 |
B |
0.01 |
A |
0.40 |
- |
0.40 |
- |
3/5 |
foc. |
Alg. |
|
it13 |
4.39 |
C |
3.90 |
C |
0.07 |
B |
3.86 |
C |
3.86 |
C |
5/5 |
foc. |
Alg. |
|
it14 |
3.14 |
C |
1.98 |
C |
0.02 |
A |
1.69 |
C |
1.69 |
C |
5/5 |
foc. |
Alg. |
|
it15 |
1.25 |
B |
0.58 |
- |
0.00 |
A |
-0.10 |
- |
-0.10 |
- |
2/5 |
foc. |
Alg. |
|
it16 |
2.13 |
C |
1.42 |
B |
0.03 |
A |
2.10 |
C |
2.10 |
C |
5/5 |
foc. |
Alg. |
|
it17 |
1.89 |
C |
1.25 |
B |
0.01 |
A |
1.61 |
C |
1.61 |
C |
5/5 |
foc. |
Alg. |
|
it18 |
1.21 |
B |
0.90 |
- |
0.00 |
A |
0.92 |
A |
0.92 |
A |
4/5 |
foc. |
Alg. |
|
it19 |
0.30 |
- |
0.11 |
- |
0.01 |
A |
-0.56 |
A |
-0.56 |
A |
3/5 |
Ref. |
Alg. |
|
it20 |
-0.02 |
- |
-0.29 |
- |
0.01 |
A |
-1.04 |
B |
-1.04 |
B |
3/5 |
Ref. |
Alg |
|
it21 |
1.00 |
B |
0.57 |
- |
0.01 |
A |
1.85 |
C |
1.85 |
C |
4/5 |
foc. |
Geo |
|
it22 |
-1.56 |
C |
-1.55 |
C |
0.04 |
B |
-2.12 |
C |
-2.12 |
C |
5/5 |
Ref. |
Geo |
|
it23 |
-0.23 |
- |
-0.70 |
- |
0.00 |
- |
0.38 |
- |
0.38 |
- |
0/5 |
- |
Geo |
|
it24 |
0.75 |
A |
0.46 |
- |
0.01 |
A |
0.50 |
- |
0.50 |
- |
2/5 |
foc. |
Geo |
|
it25 |
-0.69 |
A |
-0.89 |
- |
0.02 |
A |
-1.04 |
B |
-1.04 |
B |
4/5 |
Ref. |
Geo |
|
it26 |
-0.48 |
- |
-0.60 |
- |
0.02 |
A |
-1.42 |
B |
-1.42 |
B |
3/5 |
Ref. |
Geo |
|
it27 |
-1.63 |
C |
-1.52 |
C |
0.03 |
A |
-2.32 |
C |
-2.32 |
C |
5/5 |
Ref. |
Geo |
|
it28 |
2.03 |
C |
1.43 |
B |
0.01 |
A |
1.41 |
B |
1.41 |
B |
5/5 |
foc. |
Geo |
|
it29 |
-0.13 |
- |
-0.30 |
- |
0.01 |
A |
-1.12 |
B |
-1.12 |
B |
3/5 |
Ref. |
Geo |
|
it30 |
-0.86 |
A |
-1.03 |
B |
0.02 |
A |
-1.80 |
C |
-1.80 |
C |
5/5 |
Ref. |
Geo |
|
it31 |
-2.80 |
C |
-2.69 |
C |
0.05 |
B |
-3.27 |
C |
-3.27 |
C |
5/5 |
Ref. |
Geo |
|
it32 |
-1.18 |
B |
-1.14 |
B |
0.03 |
A |
-1.97 |
C |
-1.97 |
C |
5/5 |
Ref. |
Geo |
|
it33 |
-0.16 |
- |
-0.28 |
- |
0.01 |
A |
-0.92 |
A |
-0.92 |
A |
3/5 |
Ref. |
Geo |
|
it34 |
3.77 |
C |
3.26 |
C |
0.08 |
C |
3.85 |
C |
3.85 |
C |
5/5 |
foc. |
Geo |
|
it35 |
-1.36 |
B |
-1.48 |
B |
0.01 |
A |
-2.00 |
C |
-2.00 |
C |
5/5 |
Ref. |
stats. |
|
it36 |
2.10 |
C |
1.45 |
B |
0.02 |
A |
1.94 |
C |
1.94 |
C |
5/5 |
foc. |
stats. |
|
it37 |
-0.01 |
- |
-0.52 |
- |
0.00 |
A |
-0.71 |
A |
-0.71 |
A |
3/5 |
Ref. |
stats. |
|
it38 |
0.01 |
- |
-0.37 |
- |
0.00 |
- |
-0.12 |
- |
-0.12 |
- |
0/5 |
- |
stats. |
|
it39 |
-0.87 |
A |
-0.97 |
A |
0.01 |
A |
-1.47 |
B |
-1.47 |
B |
5/5 |
Ref. |
stats. |
Figure 6. Graph of probability and ability of focal group and Reference group Logistics Regression Method item 27
Figure 7. Graph of probability and ability of focal group and Reference group Logistics Regression Method item 13
Table 7. Description of the ability of the reference and focal group students
|
Descriptive |
Row Score |
Logit Scale |
||
|
Reference |
Focal |
Reference |
Focal |
|
|
n |
1000 |
1000 |
1000 |
1000 |
|
average |
23.43 |
17.01 |
0.42 |
-0.40 |
|
min |
4.00 |
3.00 |
-2.13 |
-2.42 |
|
max |
37.00 |
37.00 |
2.56 |
2.57 |
|
SD |
9.67 |
6.94 |
1.20 |
0.75 |
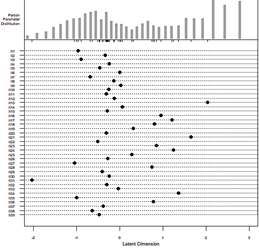
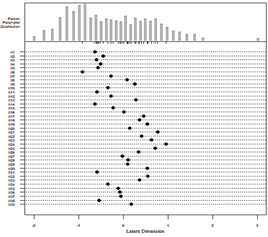
Connection Item characteristics and abilities of students from each group are presented in Figure 8 and Figure 9. Figure 8 shows group references have abilities ranging from -2.13 to 2.56 temporal logit scale index. The difficulty of the items is in the range of the interval -2.00 to 2.00. with index difficulty, set up NE test as it should measure with good ability students in groups reference. Temporary that, if compared to Figure 9, shows ability student is in the interval -2.00 to 2.00 while index Item difficulty is in the range of -1.00 to 1.00. index the difficulty of the item given to group reference it turns out no by significant capable describe with good ability group this, thing this because of existence significant difference _ Among ability student with the device the NE test is given. Some groups with ability tall and capable low no could reveal with effective device NE test.
Figure 8. Person-item map reference group
Figure 9. Focal group person-item map
Connection Among ability students and item difficulty index has implications for the advantaged group with device test this. Table 8 describes that generally, items that contain DIF are good group references. Although average ability _ from group reference is more suitable than a focal group, level success students in the focal group are more suitable than group reference to some items with the same ability level. This condition causes a unique case and can be studied more in using various other analyses in the future front.
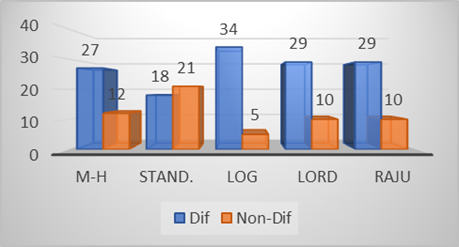
Figure 10. Number of Items containing DIF and non-DIF based on DIF detection method with R. program
Table 8. DIF function level results and Groups who benefit from the R. program
|
DIF Level |
CTT |
1PL IRT |
||||||||
|
MH |
STD |
LOG |
LORD |
RAJU |
||||||
|
Ref. |
foc. |
Ref. |
foc. |
Ref. |
foc. |
Ref. |
foc. |
Ref. |
foc. |
|
|
A |
3 |
2 |
1 |
0 |
15 |
14 |
8 |
1 |
8 |
1 |
|
B |
2 |
6 |
3 |
7 |
2 |
2 |
5 |
1 |
5 |
1 |
|
C |
3 |
11 |
3 |
4 |
0 |
1 |
6 |
8 |
6 |
8 |
|
Total |
8 |
19 |
7 |
11 |
17 |
17 |
19 |
10 |
19 |
10 |
Based on Figure 10, it can be seen that by using the non-IRT method/classical method, it was identified that the MH model detected 27 items containing DIF, the Standard model detected 18 items containing DIF. The logistic method identified 34 items containing DIF. Meanwhile, when viewed from the comparison of the three models above, it can be seen that there were 18 items detected containing DIF for the three non-IRT models used. Based on the data obtained, it can be seen that by using the IRT/Modern method with the 1PL model, it was identified that the Lord and Raju model detects DIF for all items, namely 29 items. Raju detected 34 items containing DIF. In the 3PL model, the estimation with Lord and Raju could not be detected because it failed to run the R program. Other information shows that the estimation method using the non-IRT approach has relatively different estimates between one method and another, while the IRT approach is all estimation methods used. Used using the 1PL model gives the same results for all items. Meanwhile, if we look at the items that contain DIF for all the methods used, there are 15 items, namely items 6, 13, 14, 16, 17, 23, 28,29, 31,32,33, 35, 36, 37, and 40. Of the 39 items, two items do not contain DIF for all methods used, namely items 24 and 39.
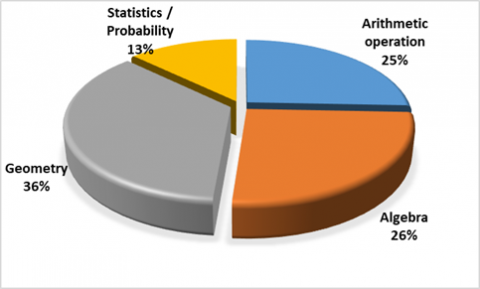
Besides the Item characteristics and abilities group, the important necessary _ shown is the material loaded on the NE test. The researcher has grouped the distribution of 2013/2014 NE material based on the material that can be used seen in Table 6. Based on Figure 11, NE questions are divided over four materials generals with the distribution of items that are not proportional for each material show that Theory geometry has a proportion compared to Theory other.
After done distribution material, the next step is to categorize items containing DIF with five methods based on the distribution of the material shown in Table 9.
Figure 11. Percentage and number of items on NE materials
Table 9 shows that the geometry material, which has a large proportion in the NA, has the highest number of items containing DIF, namely 12 items that are sufficient to be very problematic. Algebra material containing 9 item questions containing DIF in moderate to very problematic category. Statistics / The probability that even though the number of items is small. Almost all items have problems with DIF, namely 4 out of 5 contain DIF, while for the arithmetic operation material is balanced between items that contain DIF and not, namely five items that have problems while the other 5 are relatively less problematic.
Table 9. NE Material Analysis containing DIF
|
Material |
No Problem |
Less Problem |
Troubled Enough |
Troubled |
Very Troubled |
|
Arithmetic operations |
0 |
5 |
4 |
0 |
1 |
|
Algebra |
0 |
1 |
4 |
1 |
4 |
|
Geometry |
1 |
1 |
3 |
2 |
7 |
|
Statistics/Probability |
1 |
0 |
1 |
0 |
3 |
|
Amount |
2 |
7 |
12 |
3 |
15 |
Based on the results obtained, it can be seen that there is a very significant bias in the 2013/2014 NE item items. More than half of the NE questions contain DIF, which indicates that the NE questions tend to benefit the focal group [15, 38], in this case, for groups of students in NTT (representing the eastern region). Furthermore, disadvantaged students in DIY (representing the western region of Indonesia). This condition indicates that the NE questions contain a relative bias significant by location within [11]. Racial and ethnic group differences may reflect actual differences rather than measurement bias [38] know that ethnicity may influence learning culture and learning opportunities [38, 39].
Several things cause differences in the ability of DIY and NTT students to solve the NE questions in terms of this location, such as differences in educational facilities and facilities and infrastructure of the two regions [5, 40]. This situation can be supported by the fact that NTT is one of the target areas for the Bachelor of Education program in the Outermost, Frontier, and Disadvantaged Regions (SM3T) to improve the quality of education in that area. In addition, several studies have shown that differences in student backgrounds such as language [41], socioeconomic, and geography have contributed to students' abilities [5]. Geographical differences in Indonesia are generally the things that affect the primary language used. It may result in differences in students' abilities to understand some of the instructions in the NE questions given [41].
Low ability focal group can be caused by facility factors and several things that might cause a lot of NTT students not to solve the NE questions [3, 5]. Another factor is the still weak ability of students in several learning materials, namely Algebra [42, 43], Geometry [44, 45], and Statistics/probability [46, 47] material. Of course, this needs to be a focus for the education office, schools, teachers, and all stakeholders [48, 49] to focus and concentrate on these materials so that students at NTT can solve problems related to these materials in the future [50]. The material with a reasonably high DIF in this analysis is the same as the TIMSS results in 2011, where Indonesia has a below-expected value for the three materials. Indonesia only has an increase in the material for arithmetic operations [10]. Another study stated that the primary thing that affects students' ability to solve math problems is the content ability [51, 52]. it is necessary to carry out several policies to improve the content abilities of NTT students, such as improving the quality of learning to improve students' knowledge of mathematical content.
The exciting thing in the study is that with existing limitations, the general focal group /NTT has more opportunities than group /DIY reference for items containing DIF at the same capability level. This situation shows that with good guidance and educational support facilities, the ability focal group /NTT has potency significantly could increase in the future [5]. This condition naturally needs good cooperation Among the government center and region to support progress in several areas in eastern Indonesia.
Some of the limitations in this study can be used by further researchers, such as the sample used only using two provinces, namely DIY and NTT. In the future, analysis can be carried out for several areas involving more than two groups. In addition, the analysis carried out by researchers is still shallow to reveal the items and materials that contain DIF. In addition to geographical factors, many exciting things can be done to understand the bias of the NE items, such as differences in the primary language, learning opportunities, socioeconomics, other factors that are more interesting to study [3, 21, 38].
Geographical location bias is interesting to study in an archipelagic country like Indonesia, with complexities and educational problems. Mathematics NE as a benchmark for the quality of Education in Indonesia Generally profitable focal group /NTT. However, although reality, students' ability in groups is lower than group reference /DIY. This condition may be a consequence of several factors such as facility problems, condition socioeconomics, and knowledge of mathematical content (on Algebra, Geometry, and Statistics/ Probability materials). With the analysis, policymakers can take corrective steps to improve facilities and procure competent teachers. So that inferior math content problems in the focal group could be overcome for avoiding inequality from geographic aspect group in Indonesia.
This study looks at the other side of the gap in the quality of education, especially education in Indonesia, which is rich in pluralism and several problems. One of the problems that the researchers focus on is the geographical gap which is the impact of uneven development, especially educational facilities and infrastructure. Several previous studies have highlighted DIF based on gender, school status, and ease of access. Generally, researchers focus on gender and school status gaps, while only a few have looked at location/geographical aspects. With this research, it is hoped that it can provide a new picture of other aspects that have not been considered in the DIF study. This research can be used as a reference regarding the education gap for regions that have multiple characteristics, both from ethnic groups, cultures and islands such as Indonesia.
In general, the DIF analysis is considered the first step, the statistical step, to decide whether the item is biased towards a particular group. The emergence of DIF must first be seen as an impact, namely the real difference in ability of the two groups. This is important because if an item is detected as DIF, it does not necessarily mean the item is biased. In this case, it is important to consider whether the reason for the difference in group scores on the item is relevant or not, which depends on the object or purpose of the measurement. The first case, DIF is caused by the actual difference, and the second case is caused by bias
The researcher sees that DIF is a necessary condition for item bias to occur, but it is not a sufficient condition. Item impact and item bias both differ in group situations based on relevant characteristics or irrelevant test characteristics. However, if DIF occurs, then this event is not sufficient to prove the occurrence of a bias item; but furthermore, the item should be analyzed (e.g. by content analysis, field evaluation) to assess the presence of item bias in it. Thus, DIF refers to the way items function differently for individuals or groups of test takers of the same ability.
Item bias, a challenge to the validity of the test, causes systematic errors that can give incorrect interpretations of the conclusions made for certain group members. In other words, when an item unfairly favors one group over another, then item bias exists. The question is biased because the item itself contains certain sources of difficulty other than the construct being tested, and this difficulty factor is detrimental to the performance of the test taker. However, differences in performance or ability to answer items do not automatically prove item bias.
[1] Sulisworo, D. (2016). The contribution of the education system quality to improve the nation’s competitiveness of Indonesia. Journal of Education and Learning (EduLearn), 10(2): 127–138. https://doi.org/10.11591/edulearn.v10i2.3468
[2] Voss, R., Richards, T. (2016). Challenges related to teaching mathematics using social justice pedagogies: A secondary school experience. Journal of Education and Practice, 7(17): 68–73.
[3] Retnawati, H., Wutsqo, D.U., Listyani, E., Yp, K.R. (2014). The identifi cation of the diffi culties in solving mathematical problems of junior high school mathematics teachers in Nusa Tenggara Timur and Maluku Utara. Journal of Education, 7(1): 1–13.
[4] UNESCO. (2017). Global Education Monitoring Report 2017/18 (Second). United Nations Educational, Scientific and Cultural Organization. https://doi.org/10.1017/CBO9781107415324.004
[5] Özerk, K., Kerchner, C.T. (2014). Diversity and educational challenges in Oslo and Los Angeles - A metropolitan perspective nr 2. International Electronic Journal of Elementary Education, 6(3): 441–462.
[6] Edelen, M.O., Thissen, D., Teresi, J.A., Kleinman, M., Ocepek-Welikson, K. (2006). Identification of differential item functioning using item response theory and the likelihood-based model comparison approach: Application to the Mini-Mental State Examination. Medical Care, 44(11 SUPPL. 3): 134–142. https://doi.org/10.1097/01.mlr.0000245251.83359.8c
[7] Orlando Edelen, M.O., Thissen, D., Teresi, J.A., Kleinman, M., Ocepek-Welikson, K. (2006). Identification of differential item functioning using item response theory and the likelihood-based model comparison approach. Application to the Mini-Mental State Examination. Medical Care, 44(11 Suppl 3): S134-42. https://doi.org/10.1097/01.mlr.0000245251.83359.8c\r00005650-200611001-00019 [pii]
[8] Ferdhiana, R., Amri, K., Abidin, T.F. (2019). Clustering of districts in indonesia using the 2015 high school social sciences national examination results. ICICOS 2019 - 3rd International Conference on Informatics and Computational Sciences: Accelerating Informatics and Computational Research for Smarter Society in The Era of Industry 4.0, Proceedings, 3–6. https://doi.org/10.1109/ICICoS48119.2019.8982524
[9] Fahrurrazi, F., Rohiat, R., Somantri, M., Turdja’I, T. (2021). Biplot analysis for marking the quality of schools which compatible with national examination score. Journal of Physics: Conference Series, 1731(1). https://doi.org/10.1088/1742-6596/1731/1/012031
[10] OECD. (2016). PISA 2015: Results in focus. Pisa 2015, 67, 16. https://doi.org/10.1787/9789264266490-en
[11] IEA. (2012). Timss 2011 International Results in Science. In New directions for youth development (Vol. 2012, Issue 136). https://doi.org/10.1002/yd.20038
[12] Irawan, C. (2015). The national examination and the quality of education mapping. 2(1): 97-105.
[13] Muttaqin, T. (2018). Determinants of unequal access to and quality of education in Indonesia. Journal Perencanaan Pembangunan: The Indonesian Journal of Development Planning, 2(1): 1-23. https://doi.org/10.36574/jpp.v2i1.27
[14] BPS. (2021). Statistik Pendidikan 2021 (R. Sinang, R. Sulistyowati, R. Putrianti, G. Anggraeni, & F. W. R. Dewi (eds.)). Badan Pusat Statistik.
[15] OECD. (2012). PISA 2012 Results in Focus: What 15-year-olds know and what they can do with what they know. https://www.oecd.org/pisa/keyfindings/pisa-2012-results-overview.pdf
[16] Retnawati, H. (2017). The Dif identification in constructed response items using partial credit model. International Journal of Assessment Tools in Education, January, 73-89. https://doi.org/10.21449/ijate.347956
[17] Kottorp, A., Malinowsky, C., Larsson-Lund, M., Nygård, L. (2018). Gender and diagnostic impact on everyday technology use: A differential item functioning (DIF) analysis of the Everyday Technology Use Questionnaire (ETUQ). Disability and Rehabilitation, 1-7. https://doi.org/10.1080/09638288.2018.1472816
[18] Hambleton, R.K., Swaminathan, H., Rogers, D.J. (1991). Fundamentals of Item Response Theory (F. Diane S (ed.)). SAGE Publications, Inc.
[19] Simbolon, K., Supriyati, Y., Naga, D.S. (2019). Sensitivity of differential item functioning detection methods on national mathematics examination in north Sumatera Province, Indonesia. International Journal of Engineering and Advanced Technology, 8(5): 1538-1549. https://doi.org/10.35940/ijeat.E1226.0585C19
[20] Sudaryono, S. (2012). Sensitivity of differential item functioning (Dif) Sensitivitas Metode Pendeteksian Differential Item Functioning (Dif). Jurnal Evaluasi Pendidikan/Journal of Educational Evaluation, 3(1): 82-83. https://doi.org/https://doi.org/10.21009/JEP.031.07
[21] French, B.F., Finch, W.H., Antonio, J., Vazquez, V. (2016). Differential Item Functioning on mathematics items using multilevel SIBTEST. Psychological Test and Assessment Modeling, 58(3): 471-483.
[22] Jones, R.N. (2019). Differential item functioning and its relevance to epidemiology. Current Epidemiology Reports, 6(2): 174–183. https://doi.org/10.1007/s40471-019-00194-5
[23] Meyer, J.P. (2021). Differential Item Functioning. Applied Measurement with JMetrik, 89-101. https://doi.org/10.4324/9780203115190-13
[24] Reinius, M., Rao, D., Manhart, L. E., Wiklander, M., Svedhem, V., Pryor, J., Mayer, R., Gaddist, B., Kumar, S., Mohanraj, R., Jeyaseelan, L., Wettergren, L., Eriksson, L.E. (2018). Differential item functioning for items in Berger’s HIV Stigma Scale: An analysis of cohorts from the Indian, Swedish, and US contexts. Quality of Life Research, 27(6): 1647-1659. https://doi.org/10.1007/s11136-018-1841-4
[25] Alsmadi, Y., Alsmadi, A. (2009). Detecting differential person functioning in emotional intelligence. Journal of Instructional Psychology, December, 2014: 284-289.
[26] DeMars, C.E., Jurich, D.P. (2015). The interaction of ability differences and guessing when modeling differential item functioning with the rasch model: Conventional and tailored calibration. Educational and Psychological Measurement, 75(4): 610-633. https://doi.org/10.1177/0013164414554082
[27] Cutright, P. (1967). Inequality: A cross-national analysis. American Sociological Review, 32(4): 562-578.
[28] Fossett, M., South, S. J. (1983). The measurement of intergroup income inequality: A conceptual review. Social Forces, 61(3): 855-871.
[29] Hidayati, V.R., Subanji, S., Sisworo, S. (2020). Students’ Mathematical Connection Error in Solving PISA Circle Problem. JIPM (Jurnal Ilmiah Pendidikan Matematika)/JIPM (Scientific Journal of Mathematics Education), 8(2): 76. https://doi.org/10.25273/jipm.v8i2.5588
[30] Riyati, I., Suparman, S. (2019). Design student worksheets based on problem-learning to enhance mathematical communication. Asian Journal of Assessment in Teaching and Learning, 9(2): 9-17. https://doi.org/10.37134/ajatel.vol9.no2.2.2019
[31] Bauer, D.J. (2017). A more general model for testing measurement invariance and differential item functioning. Psychol Methods., 22(3): 507-526. https://doi.org/10.1037/met0000077.A
[32] Bauer, D.J. (The U. of N. C. (1997). A more general model for testing measurement invariance and differential item functioning. Psychological Methods, 2(4): 403–435. https://doi.org/10.1037/a0030641
[33] Magis, D., Béland, S., Tuerlinckx, F., de Boeck, P. (2010). A general framework and an R package for the detection of dichotomous differential item functioning. Behavior Research Methods, 42(3): 847-862. https://doi.org/10.3758/BRM.42.3.847
[34] Cervantes, V. H. (2017). DFIT: An R Package for Raju’s Differential Functioning of Items and Tests Framework. Journal of Statistical Software, 76(5). https://doi.org/10.18637/jss.v076.i05
[35] Zumbo, B.D. (1999). A handbook on the theory and methods of differential item functioning (DIF). Ottawa: National Defense Headquarters, January 1999, 1-57. http://www.researchgate.net/publication/236596822_A_handbook_on_the_theory_and_methods_of_differential_item_functioning_(DIF)_Logistic_regression_modeling_as_a_unitary_framework_for_binary_and_Likert-type_(ordinal)_item_scores/file/60b7d51830c07e4cbc.pdf
[36] Rahayu, W., Sinaga, O., Oktaviani, M., Zakiah, R. (2018). Analysis of mathematical ability of high school students based on item identification of national examination set. Advances in Social Science, Education and Humanities Research, 178(ICoIE 2018): 412–416. https://doi.org/10.2991/icoie-18.2019.88
[37] Susongko, P., Arfiani, Y., Kusuma, M. (2021). Determination of gender differential item functioning in tegal-students’ scientific literacy skills with integrated science (Slisis) test using rasch model. Jurnal Pendidikan IPA Indonesia, 10(2): 270-281. https://doi.org/10.15294/jpii.v10i2.26775
[38] Çepni, Z., Kelecioğlu, H. (2021). Detecting differential item functioning using SIBTEST, MH, LR and IRT methods. Eğitimde ve Psikolojide Ölçme ve Değerlendirme Dergisi, 12(3): 267-285. https://doi.org/10.21031/epod.988879
[39] Chen, K., Li, W., Wang, S. (2020). An easy‑to‑implement hierarchical standardization for variable selection under strong heredity constraint. Journal of Statistical Theory and Practice, 14(3): 1-32. https://doi.org/10.1007/s42519-020-00102-x
[40] Rodriguez, H.P., Crane, P.K. (2011). Examining multiple sources of differential item functioning on the clinician & group CAHPS ® survey. Health Services Research, 46(6 PART 1): 1778-1802. https://doi.org/10.1111/j.1475-6773.2011.01299.x
[41] Özerk, K. (2013). The norwegian educational system, the linguistic diversity in the country and the education of different minority groups. International Electronic Journal of Elementary Education, 6(1): 43-59.
[42] Sinharay, S., Dorans, N.J., Liang, L. (2009). First language of examinees and its relationship to differential item functioning. In Educational Testing Service (Issue March, pp. 1-65). ETS, Princeton, New Jersey.
[43] Powers, R.A., Craviotto, C., Grassl, R.M. (2010). Impact of proof validation on proof writing in abstract algebra. International Journal of Mathematical Education in Science and Technology, 41(4): 501-514. https://doi.org/10.1080/00207390903564603
[44] Winarti, D.W. (2018). Developing spatial reasoning activities within geometry learning. The 6th South East Asia Design Research International Conference.
[45] Arnis, F.M., Syahputra, E., Surya, E. (2019). Analysis of trajectory thinking of middle school students to complete the problem of spatial ability with realistic mathematical education learning. Journal of Education and Practice, 10(20): 103-109. https://doi.org/10.7176/JEP
[46] T, A.Y., Ningsih, K. (2019). Character education strengthening of students through the mathematical disposition strategy on statistics elementary. Journal of Education, Teaching, and Learning, 4(1): 1-5.
[47] Widakdo, W.A. (2017). Mathematical Representation Ability by Using Project Based Learning on the Topic of Statistics Mathematical Representation Ability by Using Project Based Learning on the Topic of Statistics. International Conference on Mathematics and Science Education (ICMScE).
[48] Miller, B.M. (2008). Problem-based conversations: Using preservice teachers’ problems as a mechanism for their professional development. Teacher Education Quarterly, 34(5): 77-98.
[49] Moyle, K. (2009). National conversations: listening to students’ views of learning with technologies. ACSA 2009 National Biennial Conference.
[50] Shanahan, E.M., Dallacqua, A.K. (2018). Action in teacher education moving beyond “Agreeable” texts and “Boring” tasks: pairing young adult literature and critical literacy in teacher education moving beyond “Agreeable” texts and “Boring” tasks: Pairing. Action in Teacher Education, 40(1): 38-57. https://doi.org/10.1080/01626620.2018.1424659
[51] Cohen, A.S., Gregg, N., Deng, M. (2005). The Role of extended time and item content on a high-stakes mathematics test. Learning Disabilities Research and Practice, 20(4): 225-233. https://doi.org/10.1111/j.1540-5826.2005.00138.x
[52] Shivaprasad, S., Sadanandam, M. (2021). Optimized features extraction from spectral and temporal features for identifying the Telugu dialects by using GMM and HMM. Ingénierie des Systèmes d’Information, 26(3): 275-283. https://doi.org/10.18280/isi.260304