Kulumani Subramanian Chandrasekaran* | Venkatachalam Mahalakshmi | Mallasamudram Ramanathan Anathapadmanabhan
© 2021 IIETA. This article is published by IIETA and is licensed under the CC BY 4.0 license (http://creativecommons.org/licenses/by/4.0/).
OPEN ACCESS
The problems of customers on seeking the commodities lead to a strong base for an investigation of Supply Chain Management which necessitates studies on the measurement and evaluation of sustainability. Big Data Analytical approach a hot research area in Computer Science Engineering provides sumptuous scope for handling supply chain management. Constant Support is critical to the creation and maintenance of supply chains competitiveness. Parameters like Demand, Market Values, Customer behavior, weather fluctuations, etc., are to be considered to make out a plan over supply criteria. The previous findings in the area considered now do not include factors like customer preferences, clearing complexity in the process, affordable revenue, time required, natural calamities etc., In this paper, it is proposed to make out an optimal strategy for maintaining the optimal supply chain. A Data set comprising cars influenced by attributes like age, market value, sale price, model, etc., are put into statistical investigation like Regression analysis and compared with Data Analytics algorithms output using feature selection and a contemplation for better prediction of the supply of cars, justifying the effect of the source code and under the realm of Big Data Analytics, a comparison of Big Data analytics is performed to estimate the parameter strategy in the supply chain handling. The Big Data implementation is less time consuming and is devoid of significant fluctuation in deciding the quotation and ordering of the goods. It is a green signal to the reflection of time spirit over the supply chain management. As part of this article, efforts are made to recognize the capabilities of Big-Data applications to make valuable forecasts by establishing a high degree of Reliability and implementing related data. By using the wrapper approach of feature selection, feature extraction is believed to be studied into the prediction model.
supply chain, data analytics, feature selection, demand supply, regression analysis
Agile and effective logistics procedures are crucial in the age of information technology and increasingly intricate technological and industrial processes. High logistical standards such as dependability, transparency, and adaptability, as well as adequate economic conditions, are the foundations of a proven business model or a supply chain. Technology that can cope up with the rising complexity of supply networks is required for dynamically changing processes. Data sets have grown in size and diversity as a result of the increase in data volume. Handling with standard, realistic management tools is inefficient or impossible in many cases. New methodologies and applications in the form of predictive analytics have been created to manage and assess these new and potentially lucrative data sets. Firms are increasingly relying on precision marketing to stay competitive and maintain or enhance profit margins. As a consequence, forecasting models are now frequently employed in precision marketing to better identify and address clients' wishes and expectations.
Supply chain management is concerned with the distribution of materials, commodities, and data from place of supply to consumers through a network of interconnected entities and activities. Delivery reliability, in fact, has the most significant impact on supply chain performance, affecting production planning, stock management, and logistics. In this perspective, forecasting is an important tool for tackling supply chain uncertainties.
Massive data analysis is becoming increasingly important as supply chains become more digitalized. A high volume of data (due to the huge number of suppliers, products, and customers) and high velocity (because to the enormous number of transactions continuously processed throughout supply chain networks) are generated by supply chain networks. To deal with the challenges posed by such complexity, classical (statistical) demand forecasting methodologies have been replaced with intelligent predictions that can learn from historical data and intelligently adapt to predict ever-changing demand. Large-scale data analytics techniques are used to extract forecasting principles by identifying the relationships between demand data across supply chain networks.
As well as demand force, company executives are looking for supply force. Seasonal factors, environmental influences, human objectives, and fashion difficulties influence the thinking viewpoints of business-management professionals. Prediction of a feasible demand from the commodities that control supply is called demand forecasting (or demand prediction). Processes in the supply chain are prone to concerned reactive impacts. In order to confirm the availability of items needed, planning executives execute quantum optimization, which involves observing the real disposal of goods on the sales window. It is not necessary to look at sales history when it comes to new and unique articles. But we have to endure the multiple important processes from basic attainment of goods to reasonable management to marketing support which involve skillful supply chain strategy. Commodities with short period of utility (short working condition) make the industries change their choice of goods at short intervals which would lead to difficulty in forecasting. There is a necessity for quick sale disposal by selling goods. These situations warrant the demand-supply observation process including testing fashion trends, climatic conditions, external reasons and previous history of the entire domain. But too many variable concepts as factors make an impact on the accuracy of the decision in forecasting and make the Demand-Supply with complexity of challenges to be met with. Apart from these practical issues, there is the realistic view of the human mind to comprehend the developmental task in this field. A scientific study of Data Analytics and classical statistical investigations are thought of for due comparison. Previous findings are observed as statistical investigations but they are subjected to complexity of customers as challenges are to be met with through a newly proposed study of Data Analytics.
Methodologies like statistical investigations and the newly proposed Data Analytics using Machine Learning algorithms are proposed in this paper and a data set of observed frequency of from a supply of cars with various attributes has been downloaded and experiment with due implementation is exhibited.
Reasoning parameters from the Data of supply of cars Age of cars, Number of owners, sale price, variant is taken with the respective observed frequencies. They are put into chi-square test to know the relations within attributes followed by a regression analysis to find out the feasibility of sufficient supply of cars to appreciate the outcome of Data Analytics. Feature selection as a tool with the algorithms is put into experimentation and deriving the output of prediction of supply-suited to big data.
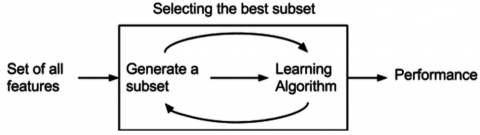
The chi-square test for independence of attributes has to be checked whether the reasoning parameters are interrelated as a stratagem for the supply of cars. It has to be followed by a multiple regression with a small sample from the Dataset using correlation coefficient matrix to be found by computing the correlation coefficients between mutual pairs of all the parameter variables considered. A multiple regression equation from the statistical analysis [1] is used with the use of matrix and determinants theory to compute the supply output. The statistical output and Data Analytics findings are to be compared with graphical exhibits the strategy of Data Analytics is to observe this approach as a utility and justifying factors in deciding accuracy and prediction of the objective variable supply to maintain supply chain. The entire paper has been organized with due abstract, introductory write up of the title of investigation, a perusal of previous findings in supply chain management with their short comings to be addressed with the outline of methodologies like statistical techniques and the newly proposed data analytics is introduced. A dataset of 6000 cars and sample of 100 cars from it are implemented with chi-square test and multiples regression analysis followed by feature selection algorithms, the output of supply is highlighted as accurate and good. Predictive module to establish that data analytics would influence good quality of research medium to innovative findings in the selected life materials and thereby increase the scope for more discoveries from the computer engineered applications. The following Figure 1 indicates the scope of this article.
Figure 1. Scope of this article
Recognition of the merit of Analytic methods to do better decision making in supply chain management has been perceived from the workings of previous researchers. From the Past findings [2] it is observed that they provide practical and admissible activities to avail the utility factors of data projected analytics. Statistical and machine learning for supply planning behaviour is supported by computer power [2]. The complexities due to illogical changes in customers’ preferences, time factor in execution and other environmental causes have to be taken into account. To improve and innovate a better method to minimise the limitations specified above has been contemplated in this paper. Feature Selection algorithms are used to handle the dataset under consideration. The scope for arousal of the issues to be addressed is also given in the following lines as challenges in the past in section 3 of this article. Traditional statistical forecasting with manual calculations for ages, and through the modern software also has contributed towards satisfactory forecasting, time-series forecasts for sales and trends [2]. The Statistical process in this field embraces with Excel and present Enterprise Resource Planning (ERP). They give scope for seasonality and knowledge of market trends to refine the outcomes. But there are hasty changes as per the customers views and they foresee when market saturation prevails in spite of these setbacks and there exist the best suited merits like planning, stability, demand and supply data etc. [2] The Machine learning for Demand-Supply planning behaviour is supported by computer power demand force. There is wide scope for sources of information. This leads to accurate Data based predictions [2]. The rise of machine learning algorithms [2] and new tools are available to achieve better performance in forecasting supply Data set pertaining to industry. A constructed machine learning algorithm will learn from a trained data set and project the learnt a perceptive mass on the exposed Data [2]. Machine learning forms a force for the apprehension of supply chain analytics in future supply forecasting depending on the efficiency of the companies in availing the Data at the manufacturing units. They face large amount of structured and unstructured data technologies and mine vast data pools providing accuracy. Manufacturing companies can use machine learning and Data analytics to become aware customer’s outlook regarding products [3]. The Machine Learning preserves sales activities maintaining cash stability [3]. Companies like soft drinks major PepsiCo, Cosmetic giant L’oreal use Machine Learning in their supply chain Management and are in the top ranks of Gartner [3] supply chain. Action on Neural Manufacturing, Smart Plant Maintenance, Agility in Rapid planning for Shut Downs, Maintaining quality control have been studied by experts from reputed organizations in this field [3].
Feature Selection a Research tool has been taken with different methods by previous researchers and it has been applied to a prediction model [4, 5]. As a result of this study, future research on BDA applications for demand forecasting in closed-loop supply chains (CLSCs) is highlighted [6-8].
As a result of this research, we have developed a hybrid decision-making model that may be replicated in other businesses. One can mix it with other analytic and mathematical models. It is also possible to utilise a stochastic simulation to evaluate the performance of enterprises [9-12]. "Demand forecasting" in supply chains is the subject of this meta-research (review of literature) work. In today's ever-expanding global supply chains, digitalization (and machine learning) is becoming more and more necessary for demand forecasting [13-16].
The negligence of taking note of customer’s preferences and occurrence of market saturation arises when statistical investigations are taken as trusting tool. Many numbers of influencing factors make the issue of complexity in the process. Forecasting accuracy is affected by manual adjustments which creates arousal of complexity due to habituation of traditional predictions. Efficient methods of processing power and highly well-chosen data are required to generate valuable predictions. Traditional forecasting techniques such as the Naive model, Moving Average model, Holt-Winters model, and Auto Regressive Integrated Moving Average (ARIMA) model measure few variables like trends, seasonality, and cycles. They fail to account for internal and external factors in the real-world that significantly causes impact on demand forecasting. It is necessary to the revenue involved in the process. It involves old legacy systems algorithms which are time consuming and impractical to anticipate the near future. The technological factors like new trends in technology, environmental strategies, natural calamities, legal constraints and new on the spot constraints of day-to-day vicissitudes are to be considered before taking the location of the investigation field.
4.1 Statistical investigation
Collection of Data and Information is processed from on-the-spot survey, Experimentation, Questionnaire, previous records and files. The parameters like Mean, Median, Standard Deviation, Correlation Coefficient, Coefficient of Variation and Regression Analysis are viewed and observed in the investigation. Then a Hypothesis is framed and is tested with the tests like chi-square, variance analysis, Randomized Block Design and Latin Square Designs. In the field of supply chain management Prediction of Demand, Quantum of sales are the two most important factors to be forecasted. The concept of stability is the focus of the process. But it is difficult to assess that whether it could cope up with progressive changes in the field to meet with fashion, order of the day and attitudes.
4.2 Machine learning
In Machine Learning computer power is enhanced with increase in the demand frame, and is built upon statistical models, Internal and external organizations are used to make out accurate prediction. The engines involved with Machine Learning can handle both structured and unstructured Data. Complex mathematical models can be used to locate demand signals, patterns and complicated relationships in the data-sets. The Machine Learning Algorithm will learn from trained Data sets and apply the relationship to the Test Data set. Here both the input set and expected output set are to be exhibited so that the Machine automatically understands the relationship between the input and output. Machine Learning Algorithms will learn patterns from the entire data and annihilate the best fit on each product. A supply chain manager has to perform demand forecast as basic entity based on a particular n- conjunctive periods of Demand and he has to draw out the demand during the ensuing future. A Layout of Demands for n-consecutive periods is framed as input and hence the demand for the immediate next period is learned. The list of situations in which machine learning definitely works better than traditional statistics includes:
4.3 Supply chain forecasting
Within all supply chains lies the question of planning. The better we evaluate the future, the better we can prepare ourselves. The question of future uncertainty, how to reduce it, and how to protect yourself against this unknown has always been crucial for every supply chain. From negotiating contract volumes with suppliers to setting safety stock targets, everything related to the ultimate question of planners demand planners will have to learn to work hand-in-hand with advanced ML-driven forecast models. Planners on demand of goods will be able to add value to those models as they understand the ML shortcomings [17].
A Dataset comprising attributes of about 6000 cars are observed and obtained with the following observed frequencies of number of cars.
Table 1. Observed frequency
|
Ai\Bj |
B1 |
B2 |
B3 |
B4 |
B5 |
B6 |
TOTAL ∑Bj |
|
A1 |
180 |
172 |
125 |
147 |
186 |
190 |
1000 |
|
A2 |
160 |
152 |
105 |
137 |
166 |
180 |
900 |
|
A3 |
190 |
182 |
195 |
157 |
196 |
180 |
1100 |
|
A4 |
200 |
212 |
205 |
188 |
198 |
197 |
1200 |
|
A5 |
140 |
142 |
108 |
127 |
145 |
138 |
800 |
|
A6 |
150 |
152 |
180 |
165 |
178 |
175 |
1000 |
|
TOTAL ∑Ai |
1020 |
1012 |
918 |
921 |
1069 |
1060 |
6000 |
(Ref-Data Set Downloaded from www.kaggle.com)
where, A1 = age of car, A2 = Number of owners of cars, A3 = Times viewed, A4 = KMs Run, A5 = Availability, A6 = Named Cars and B1 = Sale Price admissible, B2 = Spare parts good, B3 = City Exposure, B4 = Warranty, B5=Value, B6 = Variant. The Expected frequency in Table 2 is obtained by using the formulae [5] given by $E i j=\frac{\left(\sum A i \sum B j\right)}{N}$ where i ={1,2,3,4,5,6}, j={1,2,3,4,5,6} where Eij is the expected frequency of the ijth cell in the Table 2 (ith row, jth column element) and $\sum A i=$= sum of the ith row of ijth cell, $\sum B j=$= sum of the jth column of ijth cell and N = total frequency(sum of row totals=sum of column totals = N).
Using the above procedure, the following Table 2 of expected frequency of number of cars, is obtained corresponding to the observed frequency given in (Table 1) is given.
Table 2. Expected frequency of number of cars
|
Ai \Bj |
B1 |
B2 |
B3 |
B4 |
B5 |
B6 |
TOTAL ∑Bj |
|
A1 |
170 |
169 |
153 |
154 |
178 |
176 |
1000 |
|
A2 |
153 |
152 |
138 |
138 |
160 |
159 |
900 |
|
A3 |
187 |
186 |
168 |
169 |
196 |
194 |
1100 |
|
A4 |
204 |
202 |
184 |
184 |
214 |
212 |
1200 |
|
A5 |
136 |
134 |
123 |
122 |
144 |
141 |
800 |
|
A6 |
170 |
169 |
153 |
153 |
178 |
177 |
1000 |
|
TOTAL ∑ Ai |
1020 |
1012 |
918 |
921 |
1069 |
1060 |
6000 |
∑Eij = N = 6000. Chi-square test of independence of attributes is performed and it is found that the attributes taken for investigation are interrelated. Here the chi-square computed value using the following formula where
$X^{2}=\sum_{i=1}^{6} \sum_{j=1}^{6}\left[\frac{(O i j-E i j))^{2}}{O i j}\right]$
X2 is the chi-square value determining the independence or dependency between the reasoning parameters. Hence Oij = observed frequency ijth cell of ith row and jth column (Table 1) and Eij = Expected frequency ijth cell of ith row and jth column (Table 2).
Hence the parameters in the above investigation with supply process are taken for regression analysis. A Data Comprising of about 100 cars [16] are observed with the following attributes obtained in the years 2019,2020 and 2021 as given in Table 3.
Table 3. Computing arithmetic mean and standard deviation
|
Make\Attribute |
x1 |
x2 |
x3 |
x4 |
x5 |
x6 |
|
Hundai |
10 |
11 |
533 |
6 |
541 |
679 |
|
Maruthi |
67 |
19 |
316 |
2 |
321 |
397 |
|
Renault |
7 |
5 |
403 |
1 |
360 |
411 |
|
Toyota |
10 |
1 |
893 |
3 |
915 |
917 |
|
Ford |
6 |
19 |
937 |
1 |
952 |
1154 |
|
Mean |
20 |
11 |
616.4 |
2.6 |
617.8 |
711.6 |
|
Std.Dev |
23.55 |
7.27 |
253.78 |
1.85 |
268.50 |
292.68 |
(Attributes x1= no.of cars, x2= kilometers run, x3= sale price, x4= times reviewed, x5=broker quote, x6= Original price. 1 unit of x1= 1000 cars and 1 unit of x2,x3,x4,x5,x6= Rs.1000).
The statistical parameters namely Arithmetic mean and Standard deviation have been computed. Using the multiple regression equation.
$\mathrm{X}_{1}=\left\lfloor\frac{-\sigma 1}{w 1}\right\rfloor\left[\frac{x 2 w 12}{\sigma 2}+\frac{x 3 w 13}{\sigma 3}+\cdots+\frac{x n w 1 n}{\sigma n}\right]$
where, wij is the cofactor for each rij [5] General conventional mathematical equation has been given. Here X1 - Attribute of no.of cars, $\sigma 1, \sigma 2, \sigma 3, \sigma 4, \sigma 5, \sigma 6$ are the standard deviations of the attribute variables x1,x2,x3,...xn and w11,w12,...w16 are the cofactors of the respective elements rij (correlation matrix-Table 4). Cofactor = (-1)i+j x minor determinant value learning the concerned now and column of rijth element for each cofactor wij.
Table 4. Correlation matrix (rij)
|
Rij |
1 |
2 |
3 |
4 |
5 |
6 |
|
1 |
1.000 |
0.516 |
-0.594 |
-0.105 |
-0.553 |
-0.545 |
|
2 |
0.516 |
1.000 |
-0.144 |
-0.178 |
-0.115 |
0.073 |
|
3 |
-0.594 |
-0.144 |
1.000 |
-0.070 |
0.998 |
0.969 |
|
4 |
-0.105 |
-0.178 |
-0.070 |
1.000 |
-0.035 |
-0.025 |
|
5 |
-0.553 |
-0.115 |
0.998 |
-0.035 |
1.000 |
0.973 |
|
6 |
-0.545 |
0.073 |
0.969 |
-0.025 |
0.973 |
1.000 |
Elements of the first row of the correlation matrix given in Table 4 and on computing the value of x1, it has been arrived at as 17.87.
5.1 Feature selection
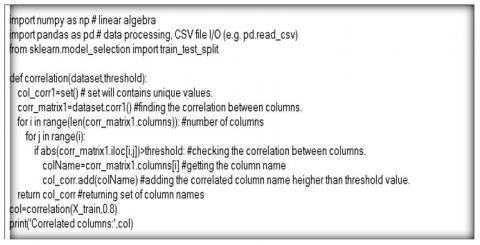
A feature is a type of information that a model has at its disposal to make a prediction (Figure 2). Though Statistical models are interesting, as they can show us the interactions between the different input variables and the output. Such models are easy to understand and to interpret. We could analyze them by simply looking at their level, trend, or seasonality over time. There are different definitions and ways to compute each feature’s importance. Feature (Figure 3) importance will be a useful technique to prevent our model from overfitting, as we are now able to see which feature brings an added value or not [16]. Now observing the Data Analytics output by considering the train and test data, we consider Feature extraction as one of the most promising techniques in Data Analytics for prediction output and it is a creditable process of picking out a subset of parameter variables besides avoiding irrelevant and unnecessary Details, Reducing complexity, reduction of over fitting, with speed and accuracy. There are methods like Wrapper method, Filter method and Embedded method [1]. We take up wrapper method (Figure 4) for our present work in supply chain using Data Analytics. Here we select a subset of variables and train the data with present multi regression relation of the supply chain depending on the sale price, Broker Quote, Original Price, Distance Coverage and Times Reviewed. The following code snippet using python numpi and the most important features from the training data set [17] have been extracted.
Figure 2. Wrapper method for feature selection
source: Wikipedia.com
Figure 3. Code showing the output of the feature selection
Figure 4. Wrapper method using forward feature selection
From the computerization process it is found that the output of the objective parameter, the supply quantity proves better prediction by its value 21.00 promising more accuracy.
The assertion of data analytics has to be made by a comparison of different methods and for statistical investigation a dataset of 6000 cars is taken with various attributes and frequency of cars are observed according to the attributes and is formed in Table 1. The theoretical (Expected frequencies are calculated as per the procedure given in sections and shown in Table 2. A null hypothesis is framed as “The attributes Ai and Bj shown in Table 1 are independent. The value of chi-square has been computed as 39.9 and the table value of chi-square for 25 degrees of freedom {(r-1)(c-1) [r-no.of rows, c- no.of columns]} at5% level of significance is found at 37.7. The computed value lies outside the region of independence. Hence there is significant difference between attribute parameters Ai and Bj and the Null-Hypothesis is rejected. That is the attributes are inter-related (show in Figure 5). A sample of 100 cars has been taken with different makes like Hundai, Ford, Maruti, etc., with six variable parameter attributes as shown in Table 3. Now the innovative strategy is to bring out that the yield parameter (X1) of no if cars in the supply quantum depends on the sub-parameter variables with x1,x2,x3,x4,x5,x6 as slated in Table 3 in section 5. Using the multiple regression equation as explained in section 5, the value of x1, the no.of cars(the yield parameter) in supply has been arrived at as 17.87. It is found that this value is close to the arithmetic mean of supply of cars as 20. (Table 3, section 5). Hence regression variable of the yield parameter of supply of cars is taken as x1=17.87 population mean ($\mu$). Now our aim is to find the reflection of our strategy that the arithmetic mean and population mean make no significant difference. For this we have executed z-test (normal probability integral – supplemental to normal probability distribution). $\mathrm{Z}=\frac{\overline{\mathrm{x}}-\mu}{\sigma}$ defined as standard normal variance and the $\mathrm{Z}-$ statistic $==\frac{\overline{\mathrm{x}}-\mu}{S . E}$, where $\overline{\mathrm{x}}=$ experimental mean of the data, $\mu=$population parameter means representing data set [16] (derived from regression analysis) S.E = standard deviation error which is the standard deviation of the sample distribution of a sample statistic $\sigma / \sqrt{n} .\sigma=$standard deviation of the data of supply of cars, n = no.of cars taken from the data set [16]. The value of z is arrived at 0.09. At 1% and 5% levels of significance the value of z as per z table are 2.58 and 1.96 respectively. Hence the computed value of z=0.09 is much less than 1.96 and 2.58 and the Null Hypothesis is accepted. There is no significant difference between the values x1 and x1 arrived at as population parameter and already it has been proved the parameter variables x1,x2,..x6 are interrelated by performing chi-square test. Hence the supply value of X1 depends on the other parameters used in table [3]. By applying featuring selection data analytics algorithm, a prediction of 95% accuracy and supply of 21000 cars are admissible with the implementation of the above algorithms. The following graph exhibits the promising and advantageous output of the data analytics algorithm.
It is arrived at Figure 5, that data analytical output from a large dataset proves to cope up with new trends in technological and environmental strategies. And the techniques of engineered computer technology get a mutual apprehension with the field of experiment in the materialistic and scientific requirements.
Figure 5. Bar diagram of performance output of various modules used for comparison
To summarize the depictions in the endeavor of data analytics on the beneficial aspect of supply chain management has been realized with the prediction and accuracy of the output. Data through the feature selection algorithm based on wrapper method which is promising better performance with the experimental data set [16] of cars by supply output compared to statistical conclusions made out through chi-squares and multi regression with the Z-test for establishing the population parameter as a feasible output in determining the supply of cars. Even though with data analytics there are problems like abstractness, identification while selecting features, feature subsets challenging at classification of algorithmic execution with computational complexity and in spite of prevalence of uncertainty under certain practical issues like unavailability of production of goods, the proposed experimentation in supply chain of used cars using data analytics, the wrapper algorithms have promised better prediction and accuracy. As a matter of further study with the practical applications, the gap between research and practice of experimentation with impact of the work should become connective domain. Data Science and open-source software should be utilized in research to bring out the mutual proportional reflection of growth rate, output function between computer science engineering and other life sciences.
[1] Gupta, S.C., Kapoor, V.K. (2000). Fundamentals of Mathematical Statistics. Tenth Revised Edition. Sultan Chand & Sons.
[2] Seyedan, M., Mafakheri, F. (2020). Predictive big data analytics for supply chain demand forecasting: Methods, applications, and research opportunities. Journal of Big Data, 7(53). https://doi.org/10.1186/s40537-020-00329-2
[3] Vivas, R., Sant’Anna, A.M.O., Esquerre, K.P.S.O., Freires, F.G.M. (2020). Integrated method combining analytical and mathematical models for the evaluation and optimization of sustainable supply chains: A Brazilian case study. Comput. Ind. Eng., 139: 105670. https://doi.org/10.1016/j.cie.2019.01.044
[4] Maka, K., Pazhanirajan, S., Mallapur, S. (2020). Selection of most significant variables to detect fraud in financial statements. Mater. Today Proc. https://doi.org/10.1016/j.matpr.2020.09.613
[5] Sharma, V., Kumar, A., Kumar, M. (2021). A framework based on BWM for big data analytics (BDA) barriers in manufacturing supply chains. Mater. Today: Proc., 47(1). https://doi.org/10.1016/j.matpr.2021.03.374
[6] Boone, T., Ganeshan, R., Jain, A., Sanders, N.R. (2019). Forecasting sales in the supply chain: Consumer analytics in the big data era. Int. J. Forecast, 35(1): 170-180. https://doi.org/10.1016/j.ijforecast.2018.09.003
[7] Mohammed, A.M., Duffuaa, S.O. (2020). A tabu search based algorithm for the optimal design of multi-objective multi-product supply chain networks. Expert Syst. Appl., 140: 112808. https://doi.org/10.1016/j.eswa.2019.07.025
[8] Guo, Z.X., Wong, W.K., Li, M. (2013). A multivariate intelligent decision-making model for retail sales forecasting. Decis Support Syst., 55(1): 247-55. https://doi.org/10.1016/J.DSS.2013.01.026
[9] Awwad, M., Kulkarni, P., Bapna, R., Marathe, A. (2018). Big data analytics in supply chain: a literature review. In: Proceedings of the International Conference on Industrial Engineering and Operations Management, 2018(SEP), pp. 418-25.
[10] Büyüközkan, G., Göçer, F. (2018). Digital supply chain: Literature review and a proposed framework for future research. Comput Ind., 97: 157-177. https://doi.org/10.1016/j.compind.2018.02.010
[11] Tang, C.S. (2016). Perspectives in supply chain risk management. Int J Prod Econ., 103(2): 451-88. https://doi.org/10.1016/J.IJPE.2005.12.006
[12] Wang, G., Gunasekaran, A., Ngai, E.W.T., Papadopoulos, T. (2016). Big data analytics in logistics and supply chain management: Certain investigations for research and applications. Int J Prod Econ., 176: 98-110. https://doi.org/10.1016/J.IJPE.2016.03.014
[13] Zhang, Y., Ren, S., Liu, Y., Si, S. (2017). A big data analytics architecture for cleaner manufacturing and maintenance processes of complex products. J Clean Prod., 142: 626-41. https://doi.org/10.1016/J.JCLEPRO.2016.07.123
[14] Varela, I.R., Tjahjono, B. (2014). Big data analytics in supply chain management: trends and related research. In: 6th Inter-National Conference on Operations and Supply Chain Management, 1(1): 2013-4. https://doi.org/10.13140/RG.2.1.4935.2563
[15] Kumar, R., Mahto, D. (2013). Industrial forecasting support systems and technologies in practice: A review. Glob J Res Eng., 13(4): 17-33.
[16] Nicolas Vandeput Data Science for Supply Chain Forecasting-De Gruyter. (2021). https://www.degruyter.com/document/doi/10.1515/9783110671124/html?lang=en.
[17] www.kaggle.com, accessed on 25 October 2021.