Praveen Kumar Yechuri* | Suguna Ramadass
© 2021 IIETA. This article is published by IIETA and is licensed under the CC BY 4.0 license (http://creativecommons.org/licenses/by/4.0/).
OPEN ACCESS
Digital Technology is becoming increasingly essential to organizations. Related knowledge is important for a company to allow optimal use of its IT services. The use of Big Data is relatively new to this field. Handling Big data is not, at this stage, a problem for large business organizations in particular; it has also become a challenge for small and medium-sized businesses. Although Semantic Web analysis is largely focused on fundamental advances that are expected to make the Semantic Web a reality, there has not been much work done to demonstrate the feasibility and effect of the Semantic Web on business issues. The infrastructure of electronic information executives and business types has provided various enhancements for companies, such as the automated process of buying and selling products. Nevertheless, undertakings are checked for the multifaceted nature of the extension required to deal with an ever-increasing number of electronic details and procedures. This paper suggests a model with a neural network design and a word representation system named Word2Vec for analyzing retail environment. Firstly, Word2vec manages the text data and shows it as a function diagram and a feature map is given to the Convolution Neural Network (CNN) that extracts the features and classifies them. The IMDB dataset, the Cornell dataset, the Amazon Products Dataset and the Twitter dataset were analyzed in the proposed model. The proposed Convolution Neural Network Fisher Kernel (CNN-FK) model is compared with the existing SVM model for analyzing retail environment in semantic web mining. The new approach has increased efficiency when compared to existing models.
big data, semantic web, data management, sustainable retail environment, information systems, artificial neural network
The Semantic Web is what its creator Tim Berners-Lee first intended for the World Wide Web: "The first move is to place the network data in a manner that machines will interpret or transform it into a shape. This generates a network that can be accessed explicitly or implicitly by computers, what I consider a Semantic Web [1]. This bold dream has therefore been streamlined to promote its start-up in consideration of the complexities of Site implementation. And why is this dream suddenly recovered? And why is e-business important? The Semantic Internet is not only accessible on the World Wide Web. It represents a set of technologies which works equally well on internal intranets as it attempts to solve a number of major issues in the current architectures of information technology [2]. The main feature of the Semantic Web in the sense of e-business is convergence [3]. The Internet and the World Wide Web have allowed knowledge systems to be linked globally.
Big data has recently been used mostly in retail management systems. The database generation is linked to variety, truthfulness, speed, volume and value. Compared to traditional mining techniques, process and management in these databases have increased capacity [4]. Most e-commerce firms use various methods in order to get customers away from the retail market by offering such services, such as cash back, stable exchanges and delivery cash, etc. In order to succeed in this dynamic market climate, retailers need to recognise their customers' problems and solve consumers' problems [5]. The various social media patterns are also regularly understood by retailers.
Standardization efforts are now underway to create increasing communication application frameworks in various areas [6]. They also, however, proliferated and concentrated on the same principles of syntactic interoperability that just slightly removed obstacles in most contexts [7]. Logical interoperability is the focus of Semantic Web. This provides the building blocks that facilitate the connections between computer-managed objects [8]. For example, the two sets of data relating to the same object or to more complex information like that, all objects of one type would be followed by something else. These relationships tell computers that there is a fundamental reality [9]. Computers themselves cannot infer such connections, and therefore it is necessary to train them the origins from which data are immediately incorporated [10]. Nevertheless, a major initial initiative is required, but it affects wide network environments [11]. However, computers have more paths to follow with these relationships between meanings as they try to determine whether two data objects are appropriate or which are the object of the invoice.
In the Semantic Web project, the research community has made a tremendous effort and we are now beginning to see realistic gain in several fields, especially the one with a strong influence on e-business [12]. The big prospects are foreseen in the interoperation of information systems which vary from inter- which intra-agency interactions [13]. The problem is then how the Semantic Web can assist in the creation of a webbed economy where members exchange knowledge and incorporate internal business processes in an open and trustworthy manner through spontaneous inter-organizational interactions [14].
According to a new survey, gross eCommerce departments in the United States just amounted to 119.1 billion dollars for the fourth quart of 2020. In the course of product search and purchase, however, there is one major problem with which customers have to contend [15]. Many e-shops have the same items, but knowledge about the goods differs widely across various e-shops [16]. In addition, there are no global product identifiers and deals are usually not interlinked. Consequently, the buyer cannot find all the details required and the best prices for their searched items. There is a lot of product aggregators, such as Google Product and PriceGrabber2 to combine and categorise the products of numerous E-shops and several different retailers to have a better users experience. However, it is not easy to define the same product across thousands of e-shops and integrate the data in one representation [17]. In addition the product aggregators have to handle the task of sorting all the items by taxonomy in order to enable better navigation and product search.
The retail sector has seen major changes in emerging market outlets and an extremely diverse worldwide customer base. Customers have deep implications for how retail businesses prepare and improve their supply chain processes [18]. These unwilling customers shop and expect a great shopping experience anywhere and everywhere. However, other retail firms concentrate on how to find new solutions in the fields of procurement, refilling [19], supply and pricing. Retail companies begin to investigate objectively how best their supply chain processes can be managed to meet ever-changing customer needs and associated expertise while reducing business costs and encouraging high efficiency.
A major problem relating to semantic progress in the definition of the Web Interface to ensure efficient consistency with their information systems in remote business services. Ontology usually is known as a web service of semantology [20]. The measurement of the semantiquity between web services can therefore be reduced to the measurement of semantiquity [21] among ontologies. Advanced computational mechanisms such as machine learning and deep learning have a strong influence to get good classification results [22].
In this proposed work, the output of words2vec with CNNs in retail sector to identify documents required and unnecessary is examined. The output of the CNN-FK model with word2vec is evaluated in this paper according to the data dimension and the number of periods. We have conducted comprehensive studies on large collections of retail environment to test the classification accuracy of CNN-FK in words2vec model. The experimental results showed a significantly improved accuracy of the classification model by using words2vec with which semantic relations between words are established.
In this paper proposing a model with a neural network architecture and a word representation mechanism called Word2Vec used. Initially word2vec handles the text data and represents it as a feature map. And feature map is given to Convolution neural network (CNN), it extracts the features and made classification. The rest of the papere is as follows section-2 address the existing literature, section-3 deals with the proposed model, section-4 illustrates the results and discussions and finally section-5 concludes the paper.
Fisher [1] proposed heuristic solutions to the problems of Naïve Bayes classifiers, addressing systematic issues and the problems related to the multinomial model also. In this paper they have conducted a detailed study on the reasons behind the poor performance of Naïve Bayes. Also, recommended some corrections like conversion of text, solving issues of uneven training data and normalizing the classification weights [2].
Vapnik [3] addressed the micro-RNA prediction model. The approach is built on machine learning and the Naive Bayes classification. In predicting the miRNA genes, the suggested model is a modern approach applicable for many species. The main objective of this study is to create a model from training data with machine training using Naïve Bayes. An assessment of retail data showed promising results, but only when both the attribute and the meaning are seen in the text is the method able to extract value pairs.
The Nostalgic Film Data Collection research is carried out by Parveen and Pandey [4] after a Twitter API has been created. To determine its accuracy, the Naïve Bayes algorithm is used and improved by tweeting. Final results show that the text is graded at its acceptable level with a particular performance. Merchant webpage is visited in particular to compare the value of the goods contained in the catalogue with the data contained on the webpage and turn this into a standard table matching issue. Next, the writers use a scheme dependent on instances that matches the names of the attributes on the marketing website.
Neethu and Rajasree [5] evaluated the tweets using various teaching systems based on certain areas of the computer sector. They focussed on several keywords and obstacles to deal with misplay and casual language problems concerning relationship keywords. Therefore, a function vector with a naive Bayes, SVM, highest entropy and ensemble classification is evaluated.
Nazare and Nar [6] built a powerful feature set model to enhance the accuracy of large-scale, unigram and object-oriented applications to evaluate the views on Twitter. In order to identify with the same accuracy posts with precise calculation warning and f-score, two algorithms, i.e. the Naïve Bayes classification and the Suitable Classification SVM, are used.
The twitter API dataset and the tweets about the blue whales game is developed by Jain and Dandannavar [7]. Its main purpose is to conduct messages analyses. They used Naive Bayes, vector aid, maximum entropy and assembly. SVM and Naive Bayes classifiers are implemented with built-in MATLAB methods. Maximum classification can be implemented with the Max-Ent programme. Based on comparable data, 89 percent and other classifications have identical accuracy levels (i.e. 90 percent), Naïve Bayes is more precise, less precision and more exact [8]. The outcome shows a diagram showing positive, negative and neutral hashtags percentages.
Niu et al. [9] collected 2 datasets, including film reviews and hotel reviews using 2 naive Bayes and K-NN classifiers. Their aim is to test the classifier for both datasets. The test results showed that in the case of film review datasets the naive Bayes classifier performs better and that both classifier data shows approximate results in regard to hotel review data. Ultimately, for film analysis selection, the naïve Bayes system is easier. Ren et al. [10] developed a technique that forecasts air polluted data set for the weather conditions. Convex-hull technique suitable for dynamic databases with frequent changes in climate data. The DBSCAN incremental clustering is used to cluster new inserted data and to provide weather projections with a protocol. The results showed that the model is accurate based on hit and miss.
Day and Liu [11] proposed a framework for emotion analysis of Apple, Bank and BSNL data from 200-4000 sizes. The process was a modern approach to the study of emotions. The 3/4thofdataset for preparation is taken and the remaining 1/4th for examination. They used 2 separate approaches for classifying Multinomial Naïve Bayes and Decision Tree. The functionality abstraction is used for the preprocessing of tweets. They used the portable Apache Spark unit, which provides better performance. Finally, the decision tree provides 100 % accuracy, alert and f1score. Yousef et al. [12] addresses the outline of an emotion study, i.e., provides a concise explanation of the term feeling and modern approaches for processing emoticon language by discussing all the problems of the analyzes of the product or document, etc.
Neri et al. [13] developed the method for determining data variance and retraining the model by drift. They used 2 methods, weight and n-graph, which classify and increase their precision by classifying unknown trademarks in the document. They conducted research on malaria diagnosis and prevention by using different methods of machine learning, image processing. Saif et al. [15] found that machine learning practises mainly concern diagnoses of essential malaria. A promising result from Efthymios Koulompis was obtained for the usefulness of groupings and classification of certain structures by measuring the accuracy of any type [16]. It answered the problems of the World Wide Web information processing.
Identification of text with website behavious and response is implemented by Lopamudra et al. [17]. Three algorithms and only one updated for improving overall efficiency have been created. A new model is implemented based on naive Bayes that classifies the text in a microblog with a number of sensations with great efficiency.
Shiju et al. [19] revealed the emotional evaluation of 1,000 posts by Facebook on news stories through an information mining programme, and consideration of auditional facts and analysis of Facebook links to the data that can be observed in circulation. The solution was interwoven neurons where any neuron leads to a separation of the hyperplane. At this point, the issue of error on a number of vectors could not be measured by adjusting all network weights. Rosenblatt therefore suggested a method that would only adjust the weights of the power units.
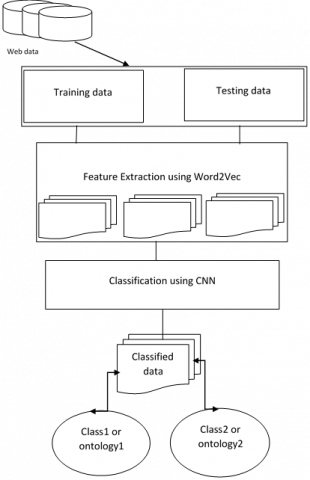
The proposed model with a neural network architecture and a word representation mechanism called Word2Vec used. Initially word2vec handles the text data and represents it as a feature map. The subsequent section explains the word2Vec mechanism and CNN model briefly. Here Figure 1 shows the proposed model working.
In deep neural networks, hidden layers are an essential aspect of learning features from input data sets. Deep neural networks are modified neural networks with many hidden layers. Data was feeded into the network after it was pre-processed in this model. This technique was widely used in the form of sequence patterns of words in the documents. Word embedding was carried out in order to convert word into feature vectors. Hidden layers learn the basic characteristics and supply the output units.
Figure 1. Proposed model framework
3.1 Word2Vec
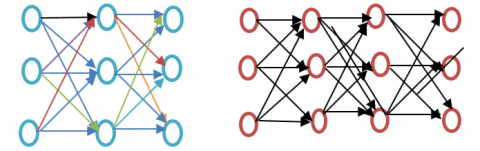
Word2vec is the technique / model for generating word embedding to best reflect word. It catches several correct syntactic and semantic zed word connections. It's a shallow neural network of two layers. Input is modelled, while neurons comprise both the secret layer and the output layer. The Figure 2 represents the shallow vs deep learning model for considering the hidden layers.
Figure 2. Shallow vs. Deep learning
Word2vec is a two-layer network where there is input one hidden layer and output. Word2vec stands for terms on the representation of vectors in space. Words are expressed as lines, such that identical definitions together and separate concepts are placed further apart. Words are described in lines.
3.2 Convolution Neural Network Fisher Kernel
It is to be able to learn from a probability model, the logistical function must first be articulated. As mentioned above the CNN is a biased model and therefore the function P (X|Φ) cannot be represented. In order to show that the most advanced softmax layer of CNN is inspected, the generative loglike feature can be expressed. Remember that the softmax function of the CNN looks like:
$p\left(C_{k} / x, \emptyset\right)=\frac{\exp \left(w_{k}{ }^{T} x^{1}+b_{k}\right)}{\sum_{j} \mathrm{~T} \exp \left(w_{k}{ }^{T} x^{1}+b_{j}\right)}$ (1)
where, Ck stands for the k-th class, wk, bk are tuneable weights and bias respectively. In the case of CNN x is an image, and xˆ are activations of the penultimate CNN layer. As it was shown by Neethu and Rajasree [5], the softmax function could be seen as an expression for the Bayes rule with tuneable parameters wk. And bk:
$p\left(C_{k} / x, \emptyset\right)=\frac{\exp \left(w_{k}^{T} x^{1}+b_{k}\right)}{\sum_{j} \times \exp \left(w_{k}^{T} x^{1}+b_{j}\right)}$$=\frac{p\left(^{x} / \emptyset, C_{k}\right) p\left(\emptyset, C_{k}\right)}{\sum_{j} \mathrm{x} p\left(^{x} / \emptyset, C_{j}\right) p\left(\emptyset, C_{j}\right)}$$=p\left({ }^{C_{k}} / \emptyset_{, x}\right)$ (2)
From there it is also possible to see that the joint probability P (x, Φ, Ck) (i.e. The nominator of Eq. (2) is equal.
$\begin{aligned} p\left(C_{k}, \emptyset, x\right)=\exp &\left(w_{k}^{T} x^{1}+b_{k}\right) \\ &=p\left(^{x} / \emptyset, C_{k}\right) p\left(\emptyset, C_{k}\right) \end{aligned}$ (3)
To be able to derive a generative log likelyhood function one has to be able to express the generative probability P (X|Ω), where Ω is a newly introduced symbol for the set of model parameters. In the case of CNN it is thus proposed to move the variables C1... Ck into the set of model parameters (i.e. Ω = {Φ, C1... CK}) such that it is possible to express the probability of set of images X conditioned on Ω. At this point P (x|Ω) is defined as:
$\begin{aligned} P\left(x / \Phi, C_{1}, \ldots, C_{k}\right) &=P(x / \Omega)=\frac{P\left(x, C_{1}, \ldots, C_{k}, \Phi\right)}{P\left(C_{1}, \ldots, C_{k}, \Phi\right)} \\=& \frac{P(\Phi, x) \prod_{k=1}^{K}+P\left(C_{k} / \Phi, x\right)}{P\left(C_{1}, \ldots, C_{k}, \Phi\right)} \end{aligned}$ (4)
where the independence of the probabilities P (C1|Φ, x)... P (CK |Φ, x) is assumed. Note that this assumption arises from the probabilistic interpretation of the softmax activation function whose formula is given in Eq. (2).
Assuming that samples P (x|Φ, C1... CK) are independent P (X|Φ, C1, ..., CK) then becomes:
$P\left(X / \Phi, C_{1}, \ldots, C_{k}\right)=\prod_{i=1}^{n} \mathrm{~K}+P\left(x_{i} / \Phi, C_{1}, \ldots, C_{k}\right)$ (5)
If we were to follow Fisher Kernel framework, at this point the expression for the derivative of the loglikelyhood of P (X|Φ, C1, ..., CK) would follow where K is constant. However, there are several caveats that make this step very challenging.
Unknown P (Φ, x) and P (C1, ..., CK, Φ) The probabilities P (Φ, x) and P (C1, ..., CK, Φ) from Eq-4 are unknown. Note that it would be possible to assume uniform prior over P (C1, ..., CK, Φ), however P (Φ, x) depends on the data x, which is a property that cannot be omitted in the Fisher Kernel setting.
Loglikelyhood derivative Even if there was a possibility to overcome the issues with unknown probabilities, obtaining the derivatives of the loglikelyhood function with respect to the parameter set Ω would be a very challenging task.
Instead of formulating unrealistic assumptions, that would help us with obtaining the final evaluable formulation of P (X|Φ, C1, ..., CK) we opt for defining our own function Λ(x, Φ, C1, ..., CK) that has similar properties as the probability P (x|Φ, C1, ..., CK):
$\wedge\left(x, \Phi, C_{1}, \ldots, C_{k}\right)=\prod_{k=1}^{K} \mathrm{~K}-P\left(x, \Phi, C_{k}\right)$ (6)
Function Λ in our formulation of Fisher Kernel based features retakes the role of prob- abilities P (x|Φ, C1, ..., CK) and K is constant. The FK classifier uses derivatives of the generative loglikelyhood function with respect to its parameters. Here since we use our own defined function Λ(x, Φ, C1, ..., CK), we call the expression, that is the equivalent to the generative likelihood L(X|Φ, C1, ..., CK) as pseudo-likelihood is defined as:
$\hat{\mathcal{L}}_{\wedge}\left(X, \Phi, C_{1}, \ldots, C_{k}\right)=\prod_{i=1}^{n} \mathrm{X} \wedge\left(x_{i}, \Phi, C_{1}, \ldots, C_{k}\right)$ (7)
At this point it is important to note that in the case of CNNs, the set of samples X actually consists of only one observation, which is the image xi, i.e. in our case n = 1 at Threshold T. If the contents of Eq. (3) are plugged into the pseudo-likelihood formula Eq. (7) the following is obtained:
$\hat{\mathcal{L}}_{\wedge}\left(X, \Phi, C_{1}, \ldots, C_{k}\right)=\prod_{i=1}^{n} \mathrm{X} \prod_{k=1}^{K} \mathrm{~T} \exp \left(\omega_{k}^{T} \hat{x}+b_{k}\right)$ (8)
Taking the logarithm of Eq. (8) the corresponding pseudo-log likelyhood function is formed.
$\log \hat{\mathcal{L}}_{\wedge}\left(X, \Phi, C_{1}, \ldots, C_{k}\right)=\sum_{i=1}^{n} \sum_{k=1}^{K} \mathrm{P} w_{k}^{T} x^{1} \omega_{k}^{T} \hat{x}_{i}+b_{k}$ (9)
After taking a derivative of the function log ˆ(X, Φ, C1... CK) with respect to its Parameters Φ, C1, ..., CK , Fisher Kernel based features could be obtained.
Recall that the derivatives of Eq. (9) are not the proper Fisher Kernel features, be- cause of our decision to replace probabilities P (x|Φ, C1, ..., CK) with Λ(x, Φ, C1, ..., CK) which cannot be regarded as generative probability measures. However our selection of Λ(x, Φ, C1, ..., CK) could be justified.
The purpose of the generative probability is to assign higher values of P (x|Φ, C1, ..., CK) to images x that are more likely to be observed. Our function Λ computes the product of normalized class posteriors P (x, Φ, Ck). Λ thus reaches high values once P (x, Φ, Ck) are also elevated. This means that from the view of Λ the images that are likely to appear are those that contain objects from classes C1, ..., CK. We hope that the fact that Λ assigns high values to the images that contain actual visual objects could be regarded as a justification of our choice of Λ function as a suitable replacement of P (x|Φ, C1, ..., CK).
The loglikelihood gradients should have a 'meaningful' shape from the Fisher Kernel point of view. This implies that its directions should be structured so that linear classification can be carried out in this space. The gradients of model trained to optimise generative log-like characteristics are used in the case of Fisher Kernel. This quality of gradient directions is guaranteed by the fact that the probability of the model reaches its height. However it is not clear if these characteristics are also present in the gradients of the described pseudo-likelyness.
The consistency of this pseudo-likehood formula Eq. (9) is another positive characteristic of ŠINE. Since the terms have been omitted exponentially, the expression is a simple sum of linear functions. It is then a simple job to obtain its derivative.
The fact that n = 1 in formula Eq. (7) could also be regarded as a theoretical issue, since the Fisher Kernel was originally defined to compare the sets of samples X which generally have more than one element. This issue could be for instance resolved by picking random crops or flips of the original image x and adding them to the set X. This extension would be another step for improving our proposed method, which is not covered in this thesis. Also note that in our particular case variables X and x are ambiguous and both represent image x.
To conclude, the gradients of Λ cannot be regarded as Fisher Kernel features, because of the reasons mentioned in the previous paragraphs. However the substitution of probability P (x|Φ, C1, ..., CK) by our own function Λ is the only difference between the Fisher Kernel and our proposed method. Thus, in this thesis we choose to term the gradients of Λ Fisher Kernel based features, because of the evident resemblance to the original method.
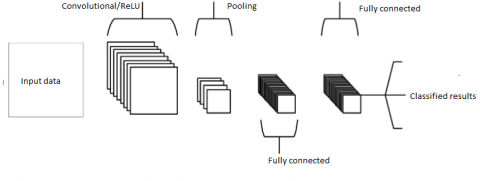
Figure 3. CNN basic architecture
The CNN basic structure is represented in Figure 3. Word2Vec has been shown to be a valuable embedding technique for capturing significant relations based on its experimental performance. In the first stage of the analysis process, Word2Vec also has demonstrated strong representational capabilities for relevant feature consideration. A CNN-FK algorithm was combined with Word2Vec to perform a binary classification on applicants for input data. In the fields of retail environment data classification and identification, some recent studies have also been performed on Word2Vec but not accurate. The proposed model uses word2vec model with CNN-FK for web mining in retail environment.
3.3 Word2Vec and CNN-FK algorithm for classification of unstructured semantic web data
Algorithm Word2Vec based CNN-FK
{
Input: web data
Output: Classified data as Knowledge.
Step-1: Take the input data set and split it into training and testing data
Step-2: while training
For each word in the Training Data:
If it exists in the model:
For each word in the Content Tree:
Calculate the correlation between the word vectors.
Step-3: Parent ß Word with Maximum Correlation
Add the word to the Content Tree as
the child of the parent
Step-4: Feature map ß{Set of nodes in the content tree}
Step-5: Apply CNN on the feature map
{
Layer-1 Convolution ReLU
Layer-2: Pooling.
Layer-3: Flattening.
Layer-4: Full Connection
}
Step-6: Return classified data
}
The vectorized value of a tokenized word is specifically transferred to the input layer by CNN-FK. In neighbouring terms, the input layer is extracted within a given window size. The procedure was referred to as a convolutionary operation and the features extracted during the convolution were used to construct a characteristic chart. CNN then carried out a max-pool over time, which removed the greatest value from the characteristics derived. The process allowed CNN-FK to extract a feature. CNN repeated the procedure by adjusting the window size to extract some functionality. The extracted features were supplied to the completely connected layer and functions of drop-out and softmax were performed.
This paper uses the word embedding technique 'Word2vec' to create sequence segmentation methods in order to transform data sequences into text vectors, thereby gaining insight into word associations of different lengths. A CNN-FK architecture is then developed via a convolutionary neural network with an embedding layer to carry out the identification task. Word2vec will translate the inner connection between words into numerical characteristics.
3.4 Deriving Fisher Kernel based features from CNN
In the following section it is shown how to use the gradients of the pseudo-loglikelyhood derived from a CNN in combination with a SVM solver and use it for classifying images. (the pseudo-loglikelyhood formula is given in equation Eq. (9). The kernel function KΛ that uses gradients of the pseudo-loglikelyhood and compares two sample sets Xi and Xj is the same as in the case of Fisher Kernel:
$K_{\wedge}\left(X_{i}, X_{j}\right)=U_{X_{i}}^{T} I^{-1} U_{X_{j}}$ (10)
in this particular case UX stands for the derivative of the pseudo-log likelihood of the CNN Eq. (9) w.r.t. its parameters Ω evaluated at particular point (image) Xi:
$U_{X}=\left.\nabla \Omega \log \hat{L} \wedge\right|_{X_{i}}$ (11)
Furthermore it is again possible to utilize the cholesky decomposition of the matrix I and express kernel function K(Xi, Xj) as a scalar product of two column vectors ΥXi and ΥXj. Where,
$K_{\Lambda}\left(X_{i}, X_{j}\right)=\gamma_{X_{i}}^{T} \gamma_{X_{i}}$ (12)
$\gamma_{X}=L U_{X}, \quad I=L^{\prime} L$ (13)
After obtaining ΥX the ℓ2 normalization follows:
$\gamma_{X}^{\ell_{2}}=\frac{\gamma_{X}}{\left\|\gamma_{X}\right\|_{2}}$ (14)
Note that for brevity the vector Υℓ2 will be simply denoted as ΥX. Classifier formed by using derivatives of the pseudo-loglikelyhood of CNN will be termed CNN-FK classifier, the vectors ΥX Fisher Kernel based features or shortly CNN-FK features.
The algorithm explains how the web data has been analyzed using proposed model. Initially word2vec handles the text data and represents it as a feature map. And feature map is given to Convolution neural network (CNN), it extracts the features and made classification.
To made experimental analysis we use windows-10 OS with 8GB RAM and 500 GB HDD and I5 processor. And we use python with matplot, numpy and keras.
A matrix element known as the confusion matrix or contingency table is used to evaluate the performance of the supervised machine training algorithm. The algorithm is used to test the output of every algorithm in supervisable machine learning. In classification terminology, the word is used for evaluating marks in groups such as True Positive (TP), False Positive (FP) and True Negative (TN), False Negative (FP).
True Positive is the amount of comments received and correctly graded by the classifier, while False Positive is a favorable change but not listed by the classifier. Likewise, True Negative is the change that is adversely and labeled by the classifier as bad, whereas False Negative is negative but is not categorized as negative.
Data Sets:
The IMDB dataset [17], the Cornell dataset [18], the Amazon Products Dataset [19] and the Twitter dataset [20, 21] were analyzed. All these datasets of English reviews are balanced and include just two emotion groups that are optimistic and negative emotions. The first dataset, IMdB film analysis, was first used by reference [22] and later used and expanded as a standard dataset. The polarity dataset contains 12,500 positive and 12,500 critical film feedback from the site film data base, each document containing an average of 30 sentences. The second collection of data is indeed a compilation of film reviews compiled from film ratings by Cornell [23]. This contains 1 K video ratings, which are optimistic and critical. The optimistic expressions are 37.2016 K, while the pessimistic phrases are 29.693K. There are 330.463 K derogatory words, while 27.749 K are explicitly constructive. The third dataset is provided through user ratings from Amazon. The sample includes 500 optimistic and 500 critical ratings among 1 K users. The dataset includes 981 positive terms and 1125 derogatory words from a total of 5180 characters. More than 1,500,000 tweets have been processed. However, this work utilizes just 150,000 tweets to train and check them.
There are a lot of reviews and views shared by consumers in the review data sets. The four datasets used are already described in this study. As negative and positive polarity is present in labelled data sets. The raw data with polarity are particularly susceptible to incoherence, irregularity and redundancy. It is influenced by the data structure. The raw data must be pre-processed in order to improve the consistency and the efficiency of the classification process [24, 25]. The role of the planning process is concerned with the elimination of common words, non-English characters and punctuations. It increases the data 's integrity and suitability. The software involves removing non-English letters, tokenizing, deleting stop words, removing repetitive characters, removing URLs, and user information.
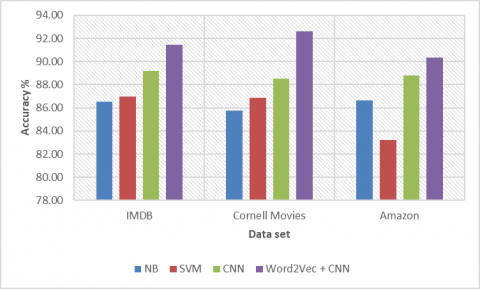
Figure 4. Accuracy
Here Figure 4 shows the accuracy of proposed model with of state of art mechanisms of NB, SVM and CNN models on three different data sets of IMDB, Cornell Movies and AMAZON reviews. The graph shows that proposed model performed with respect to the all other models in all the data sets we considered.
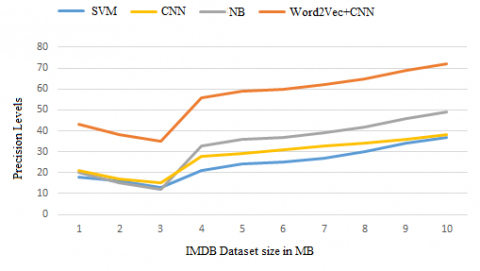
Figure 5. Precession
Here Figure 5 shows the precession of the proposed model on three separate data sets of IMDB, Cornell Movies and AMAZON reviews with state-of-the-art NB, SVM and CNN versions. The graph indicates that the proposed model was implemented in all the data sets we considered with respect to all the other models. SVM produces very less precession and NB is better than CNN in movies and amazon data set. But overall Proposed model out performed than all other.
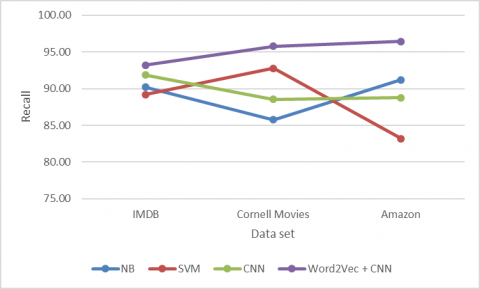
Here Figure 6 shows the Recall of the proposed model on three separate data sets of IMDB, Cornell Movies and AMAZON reviews with state-of-the-art NB, SVM and CNN versions. The graph indicates that the proposed model was implemented in all the data sets we considered with respect to all the other models. SVM produces very less precession and NB is better than CNN in movies and Amazon data set. But overall Proposed model out performed than all other.
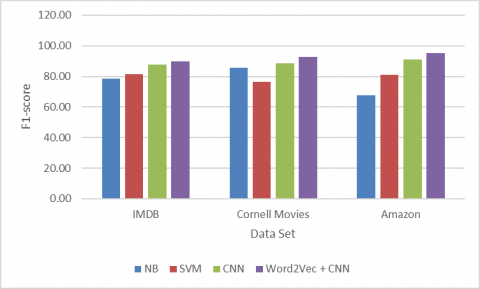
Here Figure 7 shows the F1-score of the proposed model on three separate data sets of IMDB, Cornell Movies and AMAZON reviews with state-of-the-art NB, SVM and CNN versions. The graph indicates that the proposed model was implemented in all the data sets we considered with respect to all the other models. SVM produces very less precession and NB is better than CNN in movies and amazon data set. But overall Proposed model out performed than all other.
Figure 6. Recall
Figure 7. F1-score
Web mining in Semantic is also a recent platform. With thousands of unstructured WWW data available, there is a wide area for inquiry. The lack of global standards in this field provides the research community with an enormous opportunity to focus on this area. The lack of stable cloud mining database management system opens up new ways for researchers to build KIMS for unstructured web data. The day needs a user-focused search engine. If thoroughly studied, these areas provide infinite possibilities for goldmine knowledge of un-structuring data available worldwide. In this paper we mainly use machine learning based word2vec and CNN mechanisms to analyze the unstructured data and made classification. To test the performance of the proposed model we use three different data sets and made comparison with the state of art mechanisms. Proposed word2Vec and CNN model out performed.
[1] Fisher, R.A. (1936). The use of multiple measurements in taxonomic problems. The Annals of Eugenics, 7(2): 179-188. https://doi.org/10.1111/j.1469-1809.1936.tb02137.x
[2] Ak, R., Fink, O., Zio, E. (2016). Two machine learning approaches for short-term wind speed time-series prediction. IEEE Transactions on Neural Networks and Learning Systems, 27(8): 1734-1747. https://doi.org/10.1109/TNNLS.2015.2418739
[3] Vapnik, V. (1995). The Nature of Statistical Learning Theory. Springer.
[4] Parveen, H., Pandey, S. (2016). Sentiment analysis on Twitter Data-set using Naive Bayes algorithm. 2016 2nd International Conference on Applied and Theoretical Computing and Communication Technology (iCATccT), Bangalore, India, pp. 416-419. https://doi.org/10.1109/icatcct.2016.7912034
[5] Neethu, M.S., Rajasree, R. (2013). Sentiment analysis in twitter using machine learning techniques. 2013 Fourth International Conference on Computing, Communications and Networking Technologies (ICCCNT), Tiruchengode, India, pp. 1-5. https://doi.org/10.1109/ICCCNT.2013.6726818
[6] Nazare, S.P., Nar, P.S. (2018). Sentiment analysis in Twitter. International Research Journal of Engineering and Technology, 5(1).
[7] Jain, A.P., Dandannavar, P. (2019). Application of machine learning techniques to sentiment analysis. 2016 2nd International Conference on Applied and Theoretical Computing and Communication Technology(iCATccT), Mejova, Yelena, pp. 628-632. https://doi.org/10.1109/icatcct.2016.7912076
[8] Boiy, E., Hens, P., Deschacht, K., Moens, M.F. (2007). Automatic sentiment analysis in online text. ELPUB2007. https://www.semanticscholar.org/paper/Automatic-Sentiment-Analysis-in-On-line-Text-Boiy-Hens/75fce5fa91c7ed67eefc7cf99c3ccb0da306e7bb.
[9] Niu, Z., Yin, Z.L., Kong, X.Y. (2012). Sentiment classification for microblog by machine learning. In 2012 Fourth International Conference on Computational and Information Sciences, Chongqing, China, pp. 286-289. https://doi.org/10.1109/iccis.2012.276
[10] Ren, J., Lee, S.D., Chen, X., Kao, B., Cheng, R., Cheung, D. (2009). Naive bayes classification of uncertain data. 2009 Ninth IEEE International Conference on Data Mining, Miami, FL, pp. 944-949. https://doi.org/10.1109/icdm.2009.90
[11] Day, M.Y., Lin, Y.D. (2017). Deep learning for sentiment analysis on Google play consumer review. 2017 IEEE International Conference on Information Reuse and Integration (IRI), San Diego, CA, USA, pp. 382-388. https://doi.org/10.1109/IRI.2017.79
[12] Yousef, M., Nebozhyn, M., Shatkay, H., Kanlerakis, S., Showe, L.C., Showe, M.K. (2006). Combining multi-species genomic data for microRNA identification using a Naive Bayes classifier. Bioinformatics, 22(11): 1325-1334. https://doi.org/10.1093/bioinformatics/btl094
[13] Neri, F., Aliprandi, C., Capeci, F., Cuadros, M., By, T. (2012). Sentiment analysis on social media. IEEE/ACM International Conference on Advances in Social Networks Analysis and Mining, Istanbul, pp. 919-926. https://doi.org/10.1109/asonam.2012.164
[14] Rajurkar, G.D., Goudar, R.M. (2015). A speedy data uploading approach for Twitter Trend and Sentiment analysis using HADOOP. 2015 International Conference on Computing Communication Control and Automation, Pune, India, pp. 580-584. https://doi.org/10.1109/iccubea.2015.119
[15] Saif, H., He, Y.L., Alani, H. (2012). Semantic sentiment analysis of Twitter. The 11th International Semantic Web Conference (ISWC 2012), Boston, MA, USA, PP. 1320-1326. https://doi.org/10.1007/978-3-642-35176-1_32
[16] Koulompis, E., Wilson, T., Moore, J. (2011). Twitter Sentiment analysis: The good the bad and the OMG! In the Fifth International AAAI Conference on Weblogs and Social Media, pp. 538-541.
[17] Lopamudra, D., Sanjay, C., Anuraag, B., Beepa, B., Sweta, T. (2016). Sentiment analysis of review datasets using naïve bayes and K-NN classifier. International Journal of Information Engineering and Electronic Business, 8(4): 54-62. https://doi.org/10.5815/ijieeb.2016.04.07
[18] Dey, R., Chakraborty, S. (2015). Convex-hull & DBSCAN clustering to predict future weather. 6th International IEEE Conference and Workshop on Computing and Communication, Canada, pp. 1-8. https://doi.org/10.1109/iemcon.2015.7344438
[19] Shiju, S., Devan, S., Surya Gangadharan, S. (2014). Crime analysis and prediction using data mining. 2014 First International Conference on Networks & Soft Computing (ICNSC2014), Guntur, India. https://doi.org/10.1109/cnsc.2014.6906719
[20] Deshpande, L.A., Narasingarao, M.R. (2019). Addressing social popularity in twitter data using drift detection technique. Journal of Engineering Science and Technology, 14(2): 922-934.
[21] Tiruveedhula, S., Narasingarao, M.R. (2017). Machine learning techniques for malaria disease diagnosis - A review. Journal of Advanced Research in Dynamical and Control Systems, 9(6): 349-369.
[22] Dutta, D., Bose, I. (2015). Managing a big data project: The case of Ramco cements limited. International Journal of Production Economics, 165: 293-306. https://doi.org/10.1016/j.ijpe.2014.12.032
[23] Greff, K., Srivastava, R.K., Koutník, J., Steunebrink, B.R., Schmidhuber, J. (2017). LSTM: A search space odyssey. IEEE Transactions on Neural Networks and Learning Systems, 28(10): 2222-2232. https://doi.org/10.1109/TNNLS.2016.2582924
[24] Vapnik, V. (1995). The Nature of Sstatistical Learning Theory. Springer.
[25] Kambatla, K., Kollias, G., Kumar, V., Grama, A. (2014). Trends in big data analytics. Journal of Parallel and Distributed Computing, 74(7): 2561-2573. https://doi.org/10.1016/j.jpdc.2014.01.003