Qin Xiao
© 2020 IIETA. This article is published by IIETA and is licensed under the CC BY 4.0 license (http://creativecommons.org/licenses/by/4.0/).
OPEN ACCESS
The traditional knowledge service systems have nonuniform data structures. Some data are structured, while some are semi-structured and even non-structured. Big data technology helps to optimize the integration and retrieval of the massive data on library and information (L&I), making it possible to classify the resources and optimize the configuration of L&I resource platforms according to user demand. Therefore, this paper introduces the new information service model of big data resources and knowledge services to the processing of L&I data. Firstly, the data storage structure and relationship model of the L&I resource platform were established, and used to sample and integrate the keywords of resource retrieval. Next, an L&I resource classification model was constructed based on support vector machine (SVM), and applied to extract and quantify the attributes of the keywords of resource retrieval. After that, a knowledge aggregation model was developed for a complex network of multiple L&I resource platforms. Experimental results demonstrate the effectiveness of the proposed knowledge aggregation model. The research findings provide a reference for the application of data mining in resource classification.
knowledge aggregation, resource classification, library and information (L&I), data mining, support vector machine (SVM)
Since it was conceptualized in 2008, big data has become a hot topic in the academia. In the meantime, data mining has been increasingly applied in various industries [1-3]. In particular, the application of data mining in library and information (L&I) attracts much attention from experts and scholars [4-6]. With the help of data mining, researchers have optimized the aggregation and retrieval of massive L&I data, and acquired better capability to retrieve, identify, and make intelligent analysis of such data. Hence, data mining brings new opportunities to the informatization and intellectualization of L&I management system.
Traditionally, L&I resources are classified based on access control and optimal configuration [7-9]. Raflesia et al. [10] extracted and vectorized the attributes of L&I resources, in the light of the text documents about these attributes. Based on support vector machine (SVM) classification algorithm, Antoniy et al. [11] established an automatic classification model for L&I resources, integrated the sequential minimal optimization (SMO) to effectively improve the classification efficiency, and optimized the classification effect through grid search of the optimal algorithm parameters. Using the real-time information of the L&I resource set during the update, Losee [12] constructed a resource classification model, and verified its feasibility and effectiveness through experiments on multi-source L&I resource data. After exploring deep into the unified management of L&I resources, Tella et al. [13] highlighted the importance of resource management to real-time L&I resource classification, and put forward clear standards for resource classification, principles for differentiating between new and old resources, and effective measures to link up the two kinds of resources; in addition, an L&I resource classification system was developed for the unified management of L&I resources, including 4 A-level classes, 12 B-level classes, and 25 C-level classes. Considering the similarity between same-class L&I resources in content, theme, and features, Jerrett et al. [14] constructed a thematic L&I resource classification model based on long short-term memory (LSTM) network, and demonstrated the superiority and feasibility of the model through experiments on the CNKI database for the Belt and Road Initiative (BRI).
The information knowledge generated from L&I resources face several problems: the knowledge points are scattered and fragmented, the quality is uneven, and the contents are complex and redundant. In addition, there is a lack of direct channels between multi-source L&I resource platforms. It is time-consuming to browse and acquire knowledge on multiple platforms [15-17]. Many scholars have explored the ways to aggregate the knowledge in L&I resources, aiming to scientifically organize, mine, and manage the knowledge, and to innovate the knowledge service model [18-21]. For example, Kankonsue et al. [22] defined the connotations of knowledge aggregation of multi-source L&I resources, effectively organized the knowledge contained in L&I resources, and mined the associations between the knowledge. Borrego [23] proposed a knowledge aggregation strategy based on topic-generated multi-source L&I resources: the topic probability model of latent Dirichlet allocation (LDA) was combined with the hybrid neural network BiLSTM-CNN-CRF (bidirectional LSTM-convolutional neural network-conditional random field) to learn and segment the contents, and to generate knowledge topics. Kalenov et al. [24] produced knowledge summaries of multiple L&I resources, using maximal marginal relevance (MMR) algorithm and word2vec model. After mining user interests, Ammar et al. [25] provided a knowledge aggregation and accurate recommendation strategy for multi-source L&I resources, and calculated the user similarity between multi-source L&I resource platforms, creating a robust user network.
Big data technology makes it possible to classify the resources and optimize the configuration of L&I resource platforms according to user demand, and unify the nonuniform data structures (structured, semi-structured, or non-structured) of traditional knowledge service systems. With the aid of data mining, this paper introduces the new information service model of big data resources and knowledge services to the processing of L&I data. Firstly, the keywords of resource retrieval were sampled and integrated based on the data storage structure and relationship model of the L&I resource platform. Next, an SVM-based L&I resource classification model was constructed to extract and quantify the attributes of the keywords of resource retrieval. Then, a knowledge aggregation model was developed for a complex network of multiple L&I resource platforms, and proved effective through experiments.
Inspired by bibliometric co-citation, this paper samples and optimizes the L&I data, aiming to optimize the resource configuration, and to aggregate and retrieve the knowledge of L&I resources in the context of big data. Figure 1 models the storage structure of the target L&I resource platform.
Figure 1. The storage structure and relationship model of L&I resource platform
Let A={a1,a2,…,aN} be the set of keyword attributes of the retrieval nodes in the L&I resource database, and {(x1,y1),(x2,y2),…,(xN,yN)} be the binary semantic feature function of the keywords at the retrieval nodes. By reconstructing the feature space of L&I resources, the radio-frequency identification (RFID) tag recognition model of the L&I resources can be established as:
$a_{i}^{(l+1)}=(1-\lambda) a_{i}^{(l)}$$+\frac{\lambda}{y_{N i}}\left(\varepsilon_{i}-\sum_{j=1}^{i-1} y_{i j} a_{j}^{(l+1)}\right.$$\left.-\sum_{j=i+1}^{n} y_{i j} a_{j}^{(l)}\right)$ (1)
where, λ is the attribute weight of the keywords at each retrieval node. The attributes of L&I resources were classified according to the set of attribute classes Bi(i=1, 2, …, N). Considering the difference in the keyword catalogs of L&I resource retrieval, the L&I data were sampled by the following model:
$X_{\varepsilon}=\sum_{i=1}^{B} \sigma_{i}\left(\bar{c}_{i}-\bar{c}\right)\left(\bar{c}_{i}-\bar{c}\right)^{T}$ (2)
where, $\overline{c_{i}}$ is the mean of keywords at each retrieval node; σi is the probability distribution of keyword attributes at each retrieval node. The feature analysis of L&I resources can be performed based on the results of formulas (1) and (2).
Let U={A1,A2,…,AN} be the vector distribution set in the storage space F. Then, the features of the semantic concept set for the keyword management at L&I retrieval nodes can be extracted by:
$H\left(\bar{A}_{j}\right)=\frac{f_{j}^{T} X_{\varepsilon} f_{j}}{\eta_{j}}$ (3)
where, ηj and fj are the weight and frequency of concept j that describes keyword attributes, respectively; Xε is the total number of concepts in the keyword text at each retrieval node.
The attributes of the retrieval keywords for L&I resources were classified by the difference in attribute distribution. Let Qi(i=1, 2, …, N) be the set of independent feature samples in the attribute distribution. Then, the RFID tag of the sample set can be calculated by:
$q(t)=\sum_{M=-\infty}^{\infty} \sum_{N=-\infty}^{\infty} y_{m n} h_{m n}(t)+b(t)$ (4)
where, yMN is the distribution sample set of keyword retrieval of L&I resources; hMN(t) is the fuzzy association between keyword attributes of L&I resources; b(t) is the characteristic interference for keyword management of L&I resources.
The storage space was divided U times into u=F/U. Let Q=(q1,q2.........qU) be the characteristic distribution of key indices of keyword attributes, and [rj, tj] be the association rule points of retrieval keywords. Then, qj belongs to the interval [rj, tj] in a limited dataset.
Based on the above analysis, the RFID tagging technology was introduced to automatically sample the keyword attributes of L&I resources. Then, the keyword attributes were extracted based on semantic similarity:
$K A_{j}=\frac{\sum_{l=1}^{n}\left(\sigma_{l j}\right)^{2}}{q(t)}$ (5)
where, σlj is the weight for the feature extraction of each keyword attribute. Through the above steps, the keyword features of L&I resource retrieval can be sampled automatically.
Let AR3=(Wα3,Wβ3,E3) be the set of association rules between keyword attributes. Then, the set of constraints satisfies the condition that AR3 is greater than AR1, and smaller than AR2. Let W=(ω1,ω2,…,ωN)T be the weight vector under each alternative keyword retrieval scheme, where weight ωi falls within [0, 1].
Considering the equivalence relationship of semantic mapping, the link set of the keyword attribute distribution satisfies P1∈RN×N, P2∈RM×M, and P3∈RM×N. Then, the ontology index set of the keyword attribute integration can be defined as:
$D=\left[D_{C C}, D_{C}, D_{R C}, D_{R}, A R_{3}\right]$ (6)
where, DCC is the set of concepts of keyword attributes; DC is a concept of keyword attribute; DRC is the set of keyword attribute relationships; DR is a keyword attribute relationship.
Let FAN(j)l|l-1 be the fusion attribute of keyword eigenvectors. To integrate keyword attributes and schedule the association rules of L&I resources, a data fusion scheduling model can be established based on the fuzzy c-means (FCM) adaptive learning algorithm:
$F A_{l \mid l-1}^{N(j)}=\frac{1}{\sqrt{\bar{c}}}\left[F A_{1, l \mid l-1}^{N(j)}-\delta_{l \mid l-1}^{N(j)}, \cdots F A_{M, l \mid l-1}^{N(j)}\right.$$\left.-\delta_{l \mid l-1}^{N(j)}\right]$ (7)
Once the fusion class set of keyword attributes was ready, the relevance features were analyzed in the keyword attribute database, and a semantic ontology model was constructed to reflect the classification of retrieval keywords.
Drawing on the idea of semantic ontology and language evaluation, the context distribution features of the text of each keyword were established in the rough set model of proximity. Then, a multi-layer attribute feature space was set up in the L&I retrieval catalog information database. The context weight of the text of each keyword was set to W'=((ω1,y'1),…,(ωn,y'n))T, where weight ωi falls within [0, 1]. Then, the semantic ontology feature model of the retrieval nodes can be expressed as:
$(\bar{x}, \bar{y})$$=\phi_{2}\left(\left(\left(x_{1}, y_{1}\right),\left(\omega_{1}, y_{1}\right)\right), \cdots,\left(\left(x_{N}, y_{N}\right)\left(\omega_{N}, y_{N}\right)\right)\right)$$=\Delta\left(\frac{\sum_{j=1}^{N}\left(\omega_{j}, y_{j}\right)\left(x_{j}, y_{j}\right)}{\sum_{j=1}^{N}\left(\omega_{j}, y_{j}\right)}\right)$ (8)
where, the sum of all weights equals 1; yi falls within [-0.5, 0.5]. Then, the fuzzy decision matrix of L&I resource keyword retrieval was constructed, transforming the retrieval process into a 2-tuple linguistic decision problem. Figure 2 explains the integration of keywords for L&I resource retrieval.
Figure 2. The data integration model for retrieval keywords of L&I resources
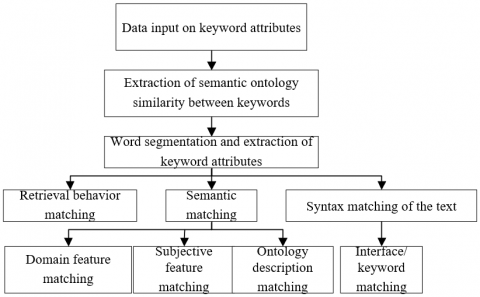
Figure 3 explains the workflow of L&I resource classification. The rapid development of information technology (IT) has diversified the types and structure of L&I resources. Therefore, the keywords of L&I data need to be defined uniformly, according to the shared features of L&I resources, and prepared into a standardized description template.
Figure 3. The workflow of L&I resource classification
Figure 4 shows the formal description model of L&I resources. The model mainly consists of a basic information description module, an online information description module, an implicit knowledge and utility description module, and a retrieval state description module.
Figure 4. The formal description model of L&I resources
Based on the integration of keywords, an extensible markup language (XML) file of the L&I resources can be formulated from the information provided by the description modules. The term frequency–inverse document frequency (TF-IDF) model was adopted to quantify the retrieval keywords of L&I resources. The word frequency in the TF-IDF model can be expressed as:
$W F(w, K)=\frac{A F(w, K)}{\max A F(K)}$ (9)
where, WF(w, K), AF(w, K), and max AF(K) are the normalized frequency, absolute frequency, and peak frequency of keyword w in the semantic information set K of the L&I resources, respectively. The anti-document frequency can be expressed as:
$A D F(w)=\log \frac{N R}{N_{i}+1}$ (10)
where, NR is the number of L&I resources; ni is the number of resources containing keyword i. From formulas (9) and (10), the weight coefficient of each keyword can be quantified by:
$W E I(w, K)=W F(w, K) \times A D F(w)$ (11)
SVM is a generalized linear classifier with strong generalization ability. This classifier can learn the features of input data, while minimizing structural risks. Considering the advantages of SVM in data mining, this paper applies SVM to classify L&I resources.
In the objective function of SVM, the characteristic parameters have the same variance and the same mean (zero). Therefore, any single feature that does not obey standard normal distribution might dominate the objective function, causing errors in the classification results. To solve the problem, the eigenvalues should be normalized by:
$W E I_{N O R}=\frac{W E I-\overline{W E I}}{W E I_{v a r}}$ (12)
where, the numerator is the difference between WEI and its mean; WEIvar is the variance of WEI.
For the SVM, the keyword set of the L&I resources in the feature space can be described as E={(a1,b1),(a2, b2),…,(aN,bN)}, where ai is an r-dimensional vector in Rr, and bi is the class tag (bi=1, or -1). Then, the classification hyperplane of the feature space can be expressed as:
$b(a)=\phi^{T} a_{i}+c$ (13)
where, c is a constant; φ is an r-dimensional vector. The distance between a data point in the feature space to the hyperplane can be described by the function interval bii((φTai+c)/ǁφǁ). Under the premise of maximizing the interval, the search for the optimal hyperplane can be transformed into the optimization of the following constraint:
$\min _{\phi, c} \frac{1}{2}\|\phi\|^{2} s . t . b_{i}\left(\phi^{T} a_{i}+c\right)-1 \geq 0$ (14)
In the real world, some samples cannot be classified by linear classifiers. That is, the distance of some points to the hyperplane is smaller than 1. Thus, a nonnegative slack variable γi was introduced to make bii(φTai+c)≥1-γi. Adding a penalty to γi, the objective function can be transformed into:
$\frac{1}{2\|\phi\|^{2}}+P \sum_{i=1}^{N} \gamma_{i}$ (15)
where, P is the penalty function (P>0). The greater the P value, the stricter the penalty on misclassification. Formula (15) aims to maximize the interval, i.e. minimizing ǁφǁ, while minimizing the number of misclassified points. Hence, the constraint optimization problem can be rewritten as:
$\min _{\phi, c} \frac{1}{2}\|\phi\|^{2}+P \sum_{i=1}^{N} \gamma_{i}$ s.t. $b_{i}\left(\phi^{T} a_{i}+c\right)-1$$\geq 0$ and $\gamma_{i} \geq 0$ (16)
The optimal solution of the original optimization problem can be obtained by solving the dual problem in the above formula. Then, a positive Lagrangian multiplier τi, υi≥0 was introduced to the above inequality. The Lagrangian function can be defined as:
$L(\phi, c, \gamma, \tau, v)=\frac{1}{2}|| \phi||^{2}$$+P \sum_{i=1}^{N} \gamma_{i}$$-\sum_{i=1}^{N} \tau_{i}\left(b_{i}\left(\phi^{T} a_{i}+c\right)-1+\gamma_{i}\right)$$-\sum_{i=1}^{N} v_{i} \gamma_{i}$ (17)
To obtain the optimal solution to the original problem, the feasible solution of the dual problem needs to satisfy the Karuch-Kuhn-Tucker (KKT) conditions. That is, solving the minimum of the Lagrangian function L relative to φ, c, and γ:
$\left\{\begin{array}{c}\min _{\phi} L(\phi, c, \gamma, \tau, v)=\phi-\sum_{i=1}^{N} \tau_{i} b_{i} a_{i}=0 \\ \min _{c} L(\phi, c, \gamma, \tau, v)=-\sum_{i=1}^{N} \tau_{i} b_{i}=0 \\ \min _{\gamma} L(\phi, c, \gamma, \tau, v)=P-\tau_{i}-v_{i}=0\end{array}\right.$ (18)
The results of formula (18) were simplified and substituted into formula (17). Then, the dual problem can be obtained by maximizing τ value:
$\max _{\tau} \frac{1}{2} \sum_{i=1}^{N} \sum_{j=1}^{N} \tau_{i} \tau_{j} b_{i} b_{j}\left(a_{i} \cdot a_{j}\right)-\sum_{i=1}^{N} \tau_{i}$ s.t. $\sum_{i=1}^{N} \tau_{i} b_{i}$$=0 \quad 0 \leq \tau_{i} \leq P$ (19)
The classification of multi-source L&I resources is a hard nonlinear problem. Here, the nonlinear problem is converted into a linear problem with the Gaussian kernel function:
$G\left(a, a^{\prime}\right)=e^{-\frac{|| a-a^{\prime}||^{2}}{2 \sigma^{2}}}$ (20)
To reduce the heterogeneity of multi-source L&I resources, this paper uses the one-against-one method to set up a binary classifier between any L&I resource samples, thereby building up a multi-class SVM, which outputs the classification decision function based on the input: keyword set of L&I resources E={(a1,b1),(a2,b2),…,(aN, bN)}. The penalty coefficient P and bandwidth σ were selected rationally, and introduced to formula (20). Then, the optimal solution τ*=(τ*1,τ*2,…τ*N) to the optimization problem can be obtained by:
$\max _{\tau} \frac{1}{2} \sum_{i=1}^{N} \sum_{j=1}^{N} \tau_{i} \tau_{j} b_{i} b_{j} e^{-\frac{|| a_{i}-a_{j}||^{2}}{2 \sigma^{2}}}$$-\sum_{i=1}^{N} \tau_{i} s . t . \sum_{i=1}^{N} \tau_{i} b_{i}=0$ $0 \leq \tau_{i}\leq P$ (21)
Taking a positive component τ*j of the optimal solution τ* that is smaller than P, the following formula can be calculated:
$c^{*}=b_{j}-\sum_{i=1}^{N} \tau_{i}^{*} b_{j} e^{-\frac{|| a_{i}-a_{j}||^{2}}{2 \sigma^{2}}}$ (22)
The classification decision function can be established as:
$C D F(x)=\operatorname{sign}\left(\sum_{i=1}^{N} \tau_{i}^{*} b_{j} e^{-\frac{|| a_{i}-a_{j}||^{2}}{2 \sigma^{2}}}+c^{*}\right)$ (23)
Figure 5 shows the proposed knowledge aggregation model of multi-source L&I resources. The complex network of multiple L&I resource platforms has a complex structure, numerous nodes, and diverse connections. Drawing on previous research of the network, this paper proposes a knowledge aggregation model that suits the multi-polar knowledge interaction between platforms.
Figure 5. The knowledge aggregation model of multi-source L&I resources
The evolutionary construction of the platforms is detailed below:
Step 1. Initialize the complex network.
The initial platform only has one platform node node1. Let F1=(μ11,μ22,…,μ1N) be N random fluctuation factors that induce the knowledge interactions across the platform.
Step 2. Form a single-polar local network of multiple platforms.
Triggered by the largest fluctuation factor, the platform node node1 starts to publish the basic information of platform resources and retrieval information. Then, more and more platform nodes emerge, and connect with the existing nodes via the optimal path.
(1) At the beginning of this stage, n1 platform nodes receive the information published by node1, and thus participate in knowledge interaction between platforms. That is, the n1 platform nodes connect with node1. The nodes with weak strength are less likely to connect the other nodes via the optimal path, or to participate in further knowledge interaction. The n1 platform nodes and the d1 additional paths between them form the knowledge interaction network 1.
(2) Suppose n2 platform nodes receive the information, and thus participate in knowledge interaction between platforms. The new nodes choose to connect network 1 via the optimal path. The nodes with weak strength are less likely to connect node i in the network. The n2 platform nodes and the d2 additional paths between them expand the size of network 1.
(3) After t periods, the single-polar local network Net1 of multiple platforms is formed based on the information released by node1. The number of nodes and the number of paths in Net1 can be respectively calculated by:
$N_{n e t 1}=\sum_{j=1}^{t} n_{j}+1$ (24)
$N_{\text {path} 1}=\sum_{j=1}^{t}\left(n_{j}+d_{j}\right)$ (25)
The sum of weights of the paths between two platform nodes is negatively correlated with the path length. The shortest path Dij between nodes i and j can be computed by:
$D_{1 i j}=\frac{1}{\max \left\{\Delta d_{i s}+\ldots+\Delta d_{r i}\right\}}$ (26)
The longer the shortest path, the less frequent the knowledge interaction between two nodes. The mean path length of Net1 can be calculated by:
$L\left(N e t_{1}\right)=\frac{1}{N_{\text {path1 }}\left(N_{\text {path } 1}-1\right)} \sum_{i \neq j \in N e t_{1}} D_{1 i j}$ (27)
In Net1, the concentration of knowledge interaction between node i and another node can be expressed as:
$C O N_{1 i}=\frac{N_{\text {nei1 } i}}{N_{\text {path1 }}\left(N_{ path1}-1\right)}$ (28)
where, Nnei1i is the number of paths between the two nodes. The concentration of knowledge interaction across Net1 can be expressed as:
$\operatorname{CON}\left(\mathrm{Net}_{1}\right)=\frac{1}{N_{\text {net } 1}} \sum_{i \in \text { Net }_{1}} \mathrm{CON}_{1 i}$ (29)
The higher the CON(Net1) value, the more the knowledge interactions across the network.
Step 3. Create the multi-polar knowledge interaction network of multiple platforms.
(1) Multiple local networks can be obtained by repeating Step 2. Suppose k local networks are formed Net1, Net2, …Netk. Let Nnet1, Nnet2, …, Nnetk be the number of nodes in the k local networks, respectively; (βj1,βj2,…,βjNnetj) be the node strength of each platform in local Netj, where j=1, 2, …, k. Since the multiple local networks are connected via node connections, the Nnetj platform nodes in local network Netj can connect other local networks as fluctuation factors. The probability for node u to connect other local networks as fluctuation factor can be computed by:
$P_{n e t}=\frac{\beta_{j u}}{\beta_{j 1}+\beta_{j 2}+\ldots+\beta_{j N e t} j}$ (30)
(2) Multi-polar knowledge interaction takes place between multiple local networks. Through node connections, the multiple local networks form a global network Net. Let N*path be the number of new paths produced through the knowledge interaction between multiple local networks. Then, the mean path length of the global network can be expressed as:
$L(N e t)=\frac{1}{N_{\text {path}}\left(N_{\text {path}}-1\right)} \sum_{i \neq j \in \text {Net}} D_{i j}$ (31)
The number of paths in the global network can be expressed as:
$N_{p a t h}=\sum_{j=1}^{t} N_{p a t h j}+N_{p a t h}^{*}$ (32)
The concentration of knowledge interaction across the global network can be expressed as:
$\operatorname{CON}(\mathrm{Net})=\frac{1}{N_{\text {net}}} \sum_{i \in \text { Net }} C O N_{i}$ (33)
The global network Net encompasses multiple local networks with varied features. Every network, including the global network and each local network, revolve around the platform node with the highest concentration of knowledge interaction to carry out multi-polar knowledge interaction. During the interaction, the interactive relationship between two platforms enhances with the frequency of their common keywords.
The following experiments were conducted to test the performance of our method in the collection and aggregation of L&I data. The algorithms were programmed on MATLAB in C++. The RFID tag conversion accuracy was assumed to be 36 bits. The training set and test set include 3,000 and 500 keyword attributes of L&I resources, respectively. The correlation coefficient between different types of keyword attributes was set to 0.25. The context matching degree was set to 0.61.
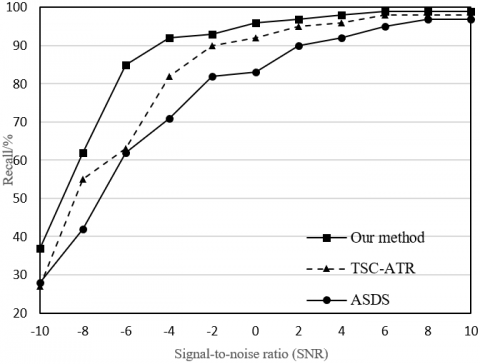
Figure 6 compares the recalls of the retrieval keywords of L&I resources aggregated by different methods, including our method, time series reconstruction and adaptive balanced retrieval (TSC-ATR), and adaptive screening of distributed structure (ASDS). It can be seen that our method achieved higher accuracy in keyword retrieval of L&I resources than the other two methods. The superior retrieval accuracy comes from the aggregation of high-precision collected data by the RFID tag recognition model based on keyword attributes.
Figure 6. The comparison of the recall
To verify its feasibility and effectiveness, the SVM-based L&I resource classification model was programmed with Spyder compiler. The resource dataset was randomly divided into a training set and a test set. The classification effect of the proposed model was compared with that of mainstream algorithms, namely, the k-nearest neighbors (k-NN) rough set algorithm, the k-modes k-NN, the kernel SVM, and the multi-class SVM (Figure 7; Table 1). The common metrics like accuracy, recall, F1-score, and receiver operating characteristic (ROC) curve were selected to measure the classification effect. It can be seen that, facing the multi-class, high-dimensional L&I resources, our classification model achieved an accuracy of 84.21%, a recall of 85.61%, an F1-score of 86.71%, and a test value of 83.92%. These results are much better than those of other algorithms.
Table 1. The classification effects of different methods
|
Methods |
Accuracy |
Recall |
F1-score |
Test value |
|
k-NN rough set |
70.91% |
69.98% |
68.90% |
69.26% |
|
K-modes k-NN |
80.92% |
81.22% |
80.34% |
82.31% |
|
Kernel SVM |
78.64% |
76.45% |
75.98% |
77.87% |
|
Multi-class SVM |
80.34% |
79.94% |
78.93% |
72.67% |
|
Our algorithm |
84.21% |
85.61% |
86.71% |
83.92% |
Figure 7. The classification results of different methods
Figure 8 presents the learning curves of the proposed SVM-based classification model in the training test and cross-validation test. It can be seen that the training test value was relatively stable, while the cross-validation test value tended to be stable with the growing number of samples, indicating that the learning effect of the model gradually improves. This proves the overall good classification effect of our model.
Figure 8. The learning curves of our model
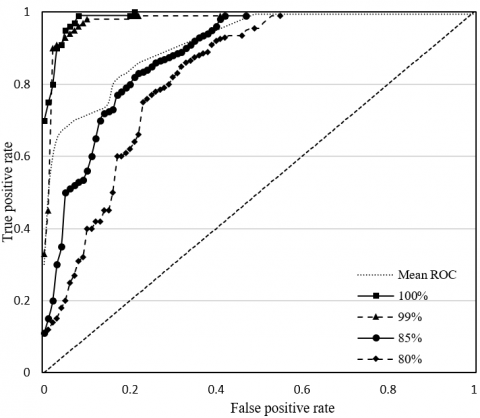
Figure 9. The ROCs of our model
To disclose the classification effect of our model on each type of L&I resources, the ROCs of our model correctly classifying 100%, 99%, 85%, and 80% of test samples, and the mean ROC are plotted as Figure 9. It can be seen that the mean classification accuracy of our model surpassed 92%, suggesting that our model boasts a good classification effect.
(a)
(b)
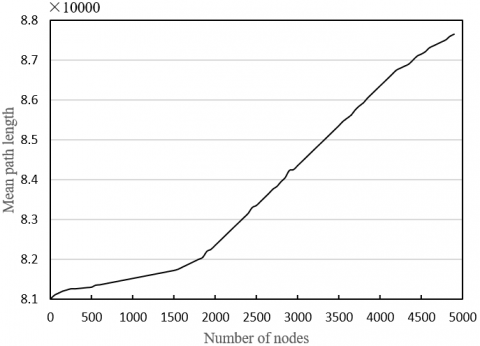
Figure 10. The relationship between knowledge aggregation performance and the number of platform nodes
The final task is to verify the effectiveness of the proposed knowledge aggregation model in the complex network of multiple L&I resource platforms. The node strength and mean path length between nodes in global and local networks were tested under the multi-polar knowledge interaction model. Figure 10(a) provides the curve between the number of local network nodes and node strength, and Figure 10(b) displays the curve between the mean path length of the global network and node strength. It can be seen that the node strength of our model obeys the power-law distribution, reflecting the features of node strength distribution of complex networks. This means our knowledge aggregation model has certain credibility. In addition, it was learned that the mean path length slowly increased and then grew linearly, with the growing number of nodes, indicating the knowledge aggregation model adapts to the small-world features of ultrashort mean path length.
This paper introduces the new information service model of big data resources and knowledge services to the processing of L&I data, and constructs a classification model and a knowledge aggregation model for L&I resources based on data mining. Firstly, the resource retrieval keywords were sampled and aggregated, in the light of the data storage structure and relationship model of L&I resource platform. Through experiments, the recalls of the retrieval keywords aggregated by different methods were compared, which verifies the superiority of our method in the collection and aggregation of L&I data. Next, an SVM-based classification model was constructed for L&I resources, and used to extract and quantify the keyword attributes for resource retrieval. Compared with several mainstream methods, the proposed classification model achieved excellent results on the classification of multi-class, high-dimensional L&I resources. Finally, a knowledge aggregation model was constructed for the complex network of multiple L&I resource platforms, and proved to have high credibility and small-world features.
[1] Anggana, S.L., Wahyudi, S.E. (2016). Enhancing university library services with mobile library information system. In Proceedings of Second International Conference on Electrical Systems, Technology and Information 2015 (ICESTI 2015), pp. 545-552. https://doi.org/10.1007/978-981-287-988-2_61
[2] Wang, D., Jia, L. (2016). Study on the information resources sharing mode of library based on network technology. Revista Ibérica de Sistemas e Tecnologias de Informação, E10: 166.
[3] Katuscáková, M., Jasecková, G. (2016). The share of knowledge management subjects within study programmes in the library and information sciences. In European Conference on Knowledge Management, 420.
[4] Pooladian, A., Borrego, Á. (2016). A longitudinal study of the bookmarking of library and information science literature in Mendeley. Journal of Informetrics, 10(4): 1135-1142. https://doi.org/10.1016/j.joi.2016.10.003
[5] Leydesdorff, L., Bornmann, L. (2016). The operationalization of “fields” as WoS subject categories (WC s) in evaluative bibliometrics: The cases of “library and information science” and “science & technology studies”. Journal of the Association for Information Science and Technology, 67(3): 707-714. https://doi.org/10.1002/asi.23408
[6] Peset, F., Garzón‐Farinós, F., González, L.M., García‐Massó, X., Ferrer‐Sapena, A., Toca‐Herrera, J.L., Sánchez‐Pérez, E.A. (2020). Survival analysis of author keywords: An application to the library and information sciences area. Journal of the Association for Information Science and Technology, 71(4): 462-473. https://doi.org/10.1002/asi.24248
[7] Iantovics, L.B., Kovacs, L., Fekete, G.L. (2016). Next generation university library information systems based on cooperative learning. New Review of Information Networking, 21(2): 101-116. https://doi.org/10.1080/13614576.2016.1247742
[8] Ziveria, M. (2016). Web based Biblical library information system Lembaga Alkitab Indonesia—Jakarta. In 2016 13th International Joint Conference on Computer Science and Software Engineering (JCSSE), pp. 1-6. https://doi.org/10.1109/JCSSE.2016.7748900
[9] Xiao, M., Zhao, D., Yin, Y., Yu, J. (2016). Bibliometrics course offerings by library and information science programs in China. Education for Information, 32(2): 195-209. https://doi.org/10.3233/EFI-150970
[10] Raflesia, S.P., Surendro, K., Passarella, R. (2017). The user engagement impact along information technology of infrastructure library (ITIL) adoption. In 2017 International Conference on Electrical Engineering and Computer Science (ICECOS), pp. 184-187. https://doi.org/10.1109/ICECOS.2017.8167130
[11] Antoniy, R., Nataliya, K., Vasil, K. (2017). The analysis of the United States of America universities library information services with benchmarking and pairwise comparisons methods. In 2017 12th International Scientific and Technical Conference on Computer Sciences and Information Technologies (CSIT), 1: 417-420. https://doi.org/10.1109/STC-CSIT.2017.8098819
[12] Losee, R.M. (2017). An information theory calculator for understanding information and library science applications. Information, 8(3): 98. https://doi.org/10.3390/info8030098
[13] Tella, A., Babatunde, B.J. (2017). Determinants of continuance intention of Facebook usage among library and information science female undergraduates in selected Nigerian universities. International Journal of E-Adoption (IJEA), 9(2): 59-76. https://doi.org/10.4018/IJEA.2017070104
[14] Jerrett, A., Bothma, T.J., De Beer, K. (2017). Exercising library and information literacies through alternate reality gaming. Aslib Journal of Information Management, 69(2): 230-254. https://doi.org/10.1108/AJIM-11-2016-0185
[15] Sammeta, S.G., Madara, S.R. (2017). Impact of information technologies on library services in educational institutions. In 2017 International Conference on Infocom Technologies and Unmanned Systems (Trends and Future Directions) (ICTUS), pp. 662-668. https://doi.org/10.1109/ICTUS.2017.8286091
[16] Mansour, E. (2017). A survey of digital information literacy (DIL) among academic library and information professionals. Digital Library Perspectives, 33(2): 166-188. https://doi.org/10.1108/DLP-07-2016-0022
[17] Iantovics, L.B., Rotar, C., Nechita, E. (2018). Intelligent university library information systems to support students efficient learning. In International Conference on Neural Information Processing, pp. 193-204. https://doi.org/10.1007/978-3-030-04224-0_17
[18] Kurniasih, N., Kurniawati, N., Yulianti, R.R., Sujito, A., Ikhwan, H.A., Haluti, F., Napitupulu, D. (2018). The utilization of search engines by students of the Library and Information Science Program at Universitas Padjadjaran. JPhCS, 1114(1): 012085. https://doi.org/10.1088/1742-6596/1114/1/012085
[19] Kozlova, E.I., Antoshkova, O.A. (2018). The methodological foundations of standardization in the field of library and information support of science. Scientific and Technical Information Processing, 45(1): 14-21. https://doi.org/10.3103/S0147688218010021
[20] Salisbury, L., Omolewu, A.O., Smith, J.J. (2018). Technology use for non-educational purposes during library instruction: Effects on students learning and retention of information. Science & Technology Libraries, 37(3): 274-289. https://doi.org/10.1080/0194262X.2018.1456391
[21] Supriatna, A.D. (2018). Designing library information system using rapid application development method. MS&E, 434(1): 012259. https://doi.org/10.1088/1757-899X/434/1/012259
[22] Kankonsue, T., Sookruay, T., Gunta-in, S., Srimora, P., Meta, A., Saravudecha, C. (2019). The less-used books management using knowledge management at library and information health science department, Chiang Mai university library. Proceedings of the 2019 2nd International Conference on Intelligent Science and Technology, pp. 24-28. https://doi.org/10.1145/3354142.3354147
[23] Borrego, Á. (2019). The impact of MOOCs on library and information science education. Education for Information, 35(2): 87-98. https://doi.org/10.3233/EFI-190269
[24] Kalenov, N., Sobolevskaya, I., Sotnikov, A. (2019). Hierarchical representation of information objects in a digital library environment. In Russian Conference on Artificial Intelligence, pp. 93-104. https://doi.org/10.1007/978-3-030-30763-9_8
[25] Ammar, N., Bailey, J.E., Davis, R.L., Shaban-Nejad, A. (2020). The personal health library: A single point of secure access to patient digital health information. Stud Health Technol Inform, 448-452.