Haiping Wang
© 2020 IIETA. This article is published by IIETA and is licensed under the CC BY 4.0 license (http://creativecommons.org/licenses/by/4.0/).
OPEN ACCESS
Under the boom of market economy in China, marketing mix is being updated constantly to facilitate the all-round development of various industries. To accurate evaluate the effect of corporate marketing mix, this paper designs an effect analysis model for corporate marketing mix based on artificial neural network (ANN). Firstly, a complete evaluation index system (EIS) was created for corporate marketing mix, and the weight of each index was assigned through analytic hierarchy process (AHP). Then, a marketing mix of big marketing + service marketing was proposed, and subject to fuzzy comprehensive evaluation (FCE). Finally, an FCE model was constructed for the effect of corporate marketing mix, based on three-layer backpropagation neural network (BPNN). The effectiveness of the model was verified through experiments. The research findings provide a reference for the application of ANN in other fields of effect analysis.
artificial neural network (ANN), marketing, marketing mix, effect analysis
In recent years, China has made great progress in the development of market economy. With the dawn of the new economic era, the global market continues to merge, and the marketing demand expands in virtually every industry. To facilitate all-round industrial development, marketing mix is being constantly updated [1-4]. Corporate marketing is mainly affected by four factors, namely, product, price, channel, and promotion. The effectiveness of corporate marketing mix relies on the strategic choice and integrated use of the four factors, both of which greatly promote the brand building, personalization, and contextualization of corporate marketing [5-9].
The existing studies on corporate marketing mix mainly propose innovative theories and models [10-14]. Kouchaki and Jami [15] sorted out the four major strategies of marketing mix, pointing out that marketing mix is mainly affected by the selection of target market, corporate marketing environment, corporate strategy of marketing development, and situation of corporate resources. Ma [16] developed an innovative marketing mix model for smart terminal services, proposed a 6P+7P marketing mix strategy based on the theory of big marketing, and constructed an operation framework for smart terminal services. Intyas and Primyastanto [17] innovated the marketing strategy of household appliances, and proposed a 4P+4C marketing mix theory, including product + consumer, price + cost, place + convenience, and promotion + communication; this strategy is driven by consumer demand, acceptance cost, convenience, communication, and interaction. Wahyuningrum et al. [18] designed a 4V marketing mix based on differentiation, maximal added value, functional flexibility, and resonance, and put forward marketing mix strategies for the marketing of main melody films in China, e.g. commercial packaging, opening precision marketing channels, and cross-industry cooperation.
Many scholars have explored corporate marketing mix in the context of social network or the Internet [19-21]. Zhang and Yang [22] suggested that corporate marketing in the new economic era needs to rely on the Internet, and identified the main features of marketing, namely, globalization, mobility, refinement, fragmentation, and contextualization, calling for innovative models of Internet marketing. Bukova et al. [23] discussed the trend of corporate marketing mix in the digital age, and proposed to make improvement in terms of technical operation, cross-industry operation, and online-offline integration. Alizadeh and Serdaroglu [24] summarized the influencing factors and features of marketing in mobile social network, discovered problems like massive data and backward management, and conducted an empirical analysis. Moradi et al. [25] systematically explored multiple issues in online marketing (e.g. data collection, information dissemination, influence analysis, and user feedback), and designed data acquisition systems for platforms suitable for online marketing (e.g. WeChat, Weibo, and Taobao), based on search engine algorithms and online data features.
Artificial neural network (ANN) is a powerful tool for self-learning, self-adaptation, and data processing. In the effect analysis of corporate marketing mix, the ANN can reduce the constraints of artificial nonlinear factors, making the analysis more accurate. Therefore, the ANN has obvious advantages over traditional methods for marketing effect analysis. For this reason, this paper designs an ANN-based effect analysis model for corporate marketing mix. Firstly, a complete evaluation index system (EIS) was constructed for the effect of corporate marketing mix, and the weight of the index was determined through analytic hierarchy process (AHP). Then, the authors proposed the marketing mix of big marketing + service marketing, and conducted fuzzy comprehensive evaluation (FCE) of the marketing mix. After that, an FCE model was constructed based on three-layer backpropagation neural network (BPNN). The effectiveness of the model was verified through experiments.
For better effect analysis on corporate marketing mix, a four-layer hierarchical EIS was established, consisting of 4 primary indices (financial benefits, consumer benefits, internal operations, learning & growth), 13 secondary indices, and 33 tertiary indices.
Layer 1 (goal):
E={effect of corporate marketing mix}
Layer 2 (primary indices)
E={E1, E2, E3, E4}={financial benefits, consumer benefits, internal operations, learning & growth}
Layer 3 (secondary indices)
E1={E11, E12}={income, cost}
E2={E21, E22, E23, E24, E25}={attention, spread, search popularity, purchase, user perception}
E3={E31, E32, E33}={platform design, operation management, publicity}
E4={E41, E42, E43}={learning ability, innovation ability, growth & progress}
Layer 4 (tertiary indices)
E11={E111, E112, E113}={online sales, sales growth rate, market share of online products}
E12={E211, E212}={sales expense ratio, platform investment as a proportion of marketing expense}
E21={E21}={product fans}
E22={E221, E222, E223}={reads, likes, forwards}
E23={E231, E232, E233}={activity visits, visitor growth rate, consultations}
E24={E241, E242, E243}={online turnover, conversion rate, repurchase rate}
E25={E251, E252}={user satisfaction, user loyalty}
E31={E311, E312, E33}={content universality, functional comprehensiveness}
E32={E321, E322, E323, E324}={push frequency, total number of partners/service providers, product update frequency, troubleshooting speed}
E33={E331, E332}={online + offline activities, number of backlinks}
E41={E411, E412, E412}={training expense of marketing staff, employee skill improvement, employee participation}
E42={E421, E422}={improvement of platform functions, security and mobility of online transactions}
E43={E431, E432}={increment of corporate recognition, influence on public platforms}
The weight of each index in the EIS was assigned through AHP.
Step 1. Construct the judgment matrix.
The weight coefficient of each index relative to the goal layer was determined based on the actual survey results and the value of each index. After pairwise comparison, a judgement matrix was constructed against a 9-point scale.
Step 2. Sort the indices on each layer and calculate consistency index.
The latent roots and eigenvectors of the judgment matrix JM were calculated and sorted:
$JM\cdot W={{\lambda }_{max}}\cdot W$ (1)
where, λmax is the largest latent root of judgement matrix JM; W is the normalized eigenvector. The component ωt of W is the weight of the corresponding index in single-layer ranking. Finally, weight ωt was determined by computing λmax and W by sum-product method.
Next, the judgement matrix JM constructed by the decision-maker of corporate marketing mix was subject to consistency test. The consistency index can be calculated by:
$CI=\frac{{{\lambda }_{\max }}-n}{n-1}$ (2)
where, n is the dimension. The consistency ratio CR can be calculated by:
$CR=\frac{CI}{RI}$ (3)
where, RI is the average random consistency index, which can be obtained by looking up the table.
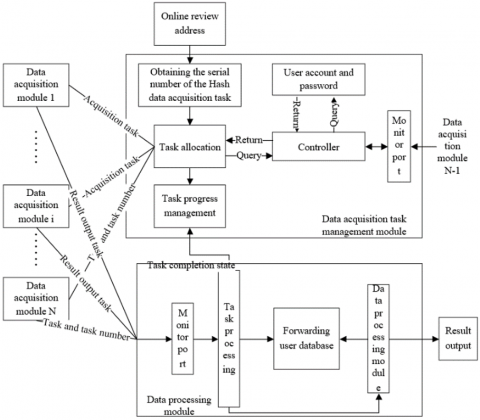
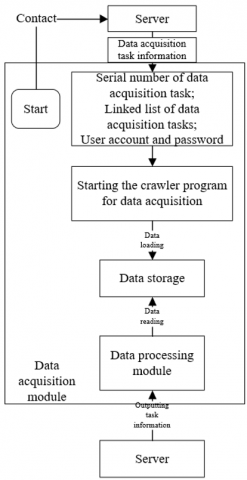
The effect of a corporate marketing mix strategy largely depends on the real-life influence of the strategy over the consumer attention to product, spread of advertisement, search popularity, purchase, and user perception of product. Based on online marketing big data, this paper analyzes the consumer influence of corporate marketing mix strategy. Figure 1 explains the principle of online marketing big data acquisition system. Figure 2 illustrates the principle of a single data acquisition module. The influence of corporate marketing mix strategy can be calculated by:
$INF=N+\frac{\sum\limits_{i=0}^{P}{{{S}_{i}}}}{P}$ (4)
where, N is the number of consumers interested in the product; P is the total number of positive reviews of the product; Si is the spread of the i-th positive review:
${{S}_{i}}={{\mu }_{L}}{{P}_{a-i}}+{{\mu }_{C}}{{P}_{C-i}}+{{\mu }_{F}}{{P}_{F-i}}+{{\mu }_{CF}}{{P}_{CF-i}}$ (5)
where, PL-i, PC-i, PF-i, and PCF-i are the number of likes, comments, forwards, and forward + comments of the i-th positive review, respectively; μL, μC, μF, and μCF are the proportional coefficients of PL-i, PC-i, PF-i, and PCF-i, respectively. The proportional coefficients satisfy:
${{\mu }_{L}}+{{\mu }_{C}}+{{\mu }_{F}}+{{\mu }_{CF}}=1$ (6)
$\text{0}<{{\mu }_{L}}<{{\mu }_{C}}<{{\mu }_{F}}<{{\mu }_{CF}}<1$ (7)
The excess difference in product involvement might hinder the quantification of influence. To solve the problem, the natural logarithm e was introduced:
$INF={{N}^{\text{1/}e}}+\frac{\sum\limits_{i=0}^{P}{{{S}_{i}}}}{P}$ (8)
Figure 1. The principle of online marketing big data acquisition system
Figure 2. The principle of a single data acquisition module
Simple accumulation cannot reflect the exact trend of influence, and the magnitude difference of massive forwards needs to be narrowed down to a suitable range. As a result, the square root calculation was introduced:
$INF={{N}_{Day}}^{\text{1/}e}+\sqrt{\sum\limits_{i=0}^{{{P}_{Day}}}{{{S}_{Day-i}}}}$ (9)
where, SDay-i is the spread of the i-th positive review on a day; PDay is the total number of positive reviews on that day. After summing and averaging the daily influence, the influence ranking among consumers can be obtained through horizontal comparison:
$IN{{F}_{total}}=\frac{\sum\limits_{Day}{INF}}{P}$ (10)
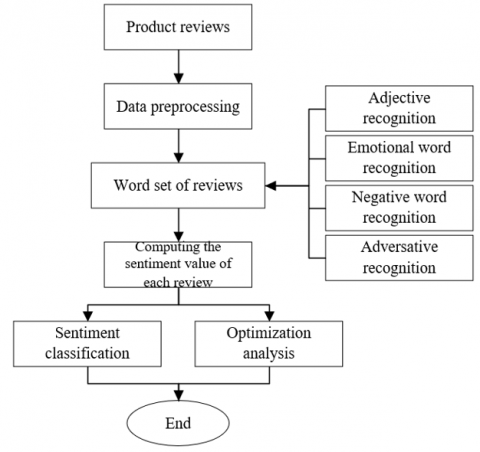
User perception of a product can be measured in seven dimensions: love, dislike, like, anger, sadness, fear, and indifference. Here, the sentiment value of each product review is calculated by weighted summation. The sentiment value SVi of the i-th review can be computed by:
$S{{V}_{i}}=\sum\limits_{Q}{{{\sigma }_{j}}*AD{{J}_{j}}}*{{\left( NEG \right)}^{{{q}_{j}}}}*{{\lambda }_{j}}*{{\upsilon }_{j}}$ (11)
where, Q is the number of emotional words in the i-th review; σj is the strength of adversative (σj=1 if there is no such word); ADJj is the adjective before the i-th emotional word in the review (ADJj=1 if there is no such word); NEG=-1 is the negative word before the i-th emotional word in the review; qj is the number of negative words (qj=0 if there is no such word); λj is the strength of emotional word; υj is the polarity of word. Figure 3 shows the analysis process of product reviews.
Figure 3. The analysis flow of product reviews
Figure 4. The proposed marketing mix strategy
Figure 5. The operation framework of the proposed strategy
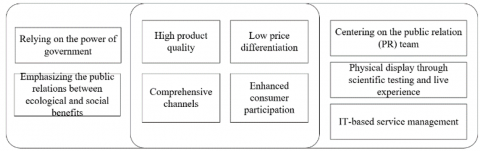
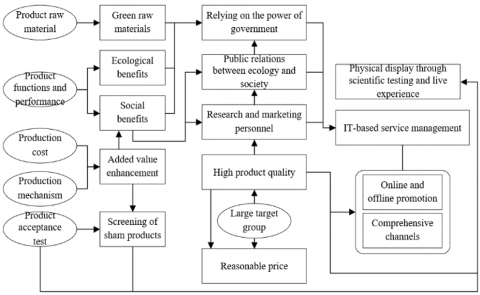
Considering the features and interactions of marketing strategies for different environments, industries, and products, this paper puts forward a marketing mix strategy of big marketing and service marketing (Figure 4). The proposed strategy aims to achieve the following goals: high product quality, low price differentiation, comprehensive channels, and enhanced consumer participation. In addition, modern information technology (IT) was integrated to manage the operation process of the marketing mix fully and effectively. The operation framework of the proposed strategy is clarified in Figure 5.
The proposed marketing mix strategy was subject to FCE through the following steps:
Step 1. Construct the EIS of the proposed strategy:
$E=\left\{ E_{\text{1}}^{\text{(1)}},E_{\text{2}}^{\text{(1)}},...,E_{N}^{\text{(1)}} \right\}$ (12)
$E_{i}^{\text{(1)}}=\left\{ E_{i1}^{\text{(2)}},E_{i2}^{\text{(2)}},...,E_{i{{K}_{i}}}^{\text{(2)}} \right\} $ (13)
$E_{ij}^{\text{(2)}}=\left\{ E_{ij1}^{\text{(3)}},E_{ij2}^{\text{(3)}},...,E_{ij{{L}_{ij}}}^{\text{(3)}} \right\} $ (14)
where, Ki(1) is the number of secondary indices under the i-th primary index; Lij(3) is the number of tertiary indices under the j-th secondary index of the i-th primary index.
Step 2. Determine the set of evaluation levels:
$R=\left\{ {{r}_{1}},{{r}_{2}},...,{{r}_{M}} \right\}$ (15)
where, M is the number of evaluation levels rk for the evaluation of a specific index.
Step 3. Construct the fuzzy relationship matrix F based on single-factor evaluation
Take primary indices for example to illustrate the matrix construction process. First, the i-th index Ei of the EIS was adopted for evaluation. Let δij be the membership of index Ei to the j-th evaluation level. Then, the result of index Ei can be expressed as a fuzzy set Fi, a fuzzy subset (i.e. the single factor evaluation set) of the set of evaluation levels R:
${{F}_{i}}=\left( {{\delta }_{il}},{{\delta }_{i2}},...,{{\delta }_{iM}} \right) $ (16)
Taking the memberships of each single factor evaluation sets as the elements in a row, a matrix can be established as:
${{\Phi }_{i}}=\left\{ \begin{matrix} {{r}_{il}} \\ {{r}_{i2}} \\ \vdots \\ {{r}_{iM}} \\\end{matrix} \right.\left[ \begin{matrix} \delta _{11}^{i} & \delta _{12}^{i} & \cdots & \delta _{1M}^{i} \\ \delta _{21}^{i} & \delta _{22}^{i} & \cdots & \delta _{2M}^{i} \\ \cdots & \cdots & \cdots & \cdots \\ \delta _{k1}^{i} & \delta _{k2}^{i} & \cdots & \delta _{kM}^{i} \\\end{matrix} \right]\text{ }$ (17)
The above analysis shows that the construction of the fuzzy relationship matrix is to solve the single factor evaluation vectors, i.e. obtain the single factor decisions. Since the indices of our strategy are all quantitative, the membership δij of index Ei to level rj can be determined through linear analysis.
Step 4. Determine the weight set W for the indices.
Primary indices were still adopted to explain the construction of the weight set. Considering the importance difference between indices, each index Ei should be assigned a reasonable weight ωi. The weight set W of the indices can be expressed as:
$W=\left( {{\omega }_{1}},{{\omega }_{2}},...,{{\omega }_{N}} \right)$ (18)
The weight set W can be regarded as a fuzzy subset of E.
Step 5. Perform the primary FCE.
Using the fuzzy operator, the fuzzy relationship matrix F=(F1, F2, …, Fn)T can be established as:
$\Phi_{i}=\left(\omega_{i 1}^{(2)}, \omega_{i 2}^{(2)}, \ldots, \omega_{i K_{i}}^{(2)}\right) \cdot\left[\begin{array}{cccc}r_{11}^{(2)} & r_{12}^{(2)} & \cdots & r_{1 M}^{(2)} \\ r_{21}^{(2)} & r_{22}^{(2)} & \cdots & r_{2 M}^{(2)} \\ \vdots & \vdots & \vdots & \vdots \\ r_{K_{i} 1}^{(2)} & r_{K_{i} 2}^{(2)} & \cdots & r_{K_{i} M}^{(2)}\end{array}\right]=\left(\phi_{1}, \phi_{2 \cdots}, \phi_{K_{i}}\right)$ (19)
where, (ωi1(2), ωi1(2), …, ωiKi(2)) is the ranking weight vectors of the secondary indices under the i-th primary index.
Step 6. Perform the secondary FCE.
The fuzzy relationship matrix of secondary FCE can be defined as:
$\Phi_{i j}=\left(\omega_{i j 1}^{(3)}, \omega_{i j 2}^{(3)}, \ldots, \omega_{i j L_{i j}}^{(3)}\right) \cdot\left[\begin{array}{cccc}r_{11}^{(3)} & r_{12}^{(3)} & \cdots & r_{1 K_{i}}^{(3)} \\ r_{21}^{(3)} & r_{22}^{(3)} & \cdots & r_{2 K_{i}}^{(3)} \\ \vdots & \vdots & \vdots & \vdots \\ r_{L_{i j} 1}^{(3)} & r_{L_{i j}^{2}}^{(3)} & \cdots & r_{L_{i j} K_{i}}^{(3)}\end{array}\right]$ (20)
where, (ωij1(3), ωij1(3), …, ωijLij(3))is the ranking weight vectors of the tertiary indices under the j-th secondary index of the i-th primary index. The results of primary and secondary FCEs were combined into the final evaluation of the proposed strategy.
Step 7. Analyze the FCE results and finalized the evaluation level.
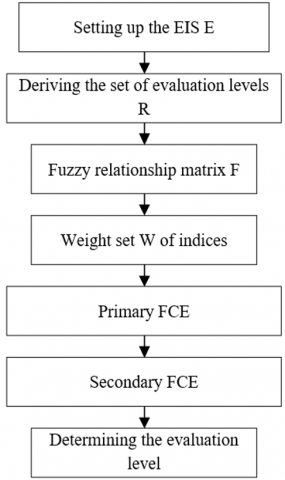
Figure 6. The workflow of the FCE
Due to the sheer number of evaluation indices, the FCE results were processed by the weighted average method to determine the levels and sort the weights of multi-dimensional fuzzy vectors. Figure 6 explains the workflow of our FCE strategy. Taking φj as the weight, the weighted average of the evaluation levels rj can be conducted by:
${{r}_{j}}=\sum\limits_{j=1}^{M}{{{{{r}'}}_{j}}{{\phi }_{j}}/\sum\limits_{j=1}^{M}{{{\phi }_{j}}}}$ (21)
where, r'j is the quantified value of level rj. The normalized result of the evaluation can be expressed as:
$FCE=\Phi \cdot {{R}^{T}}$ (22)
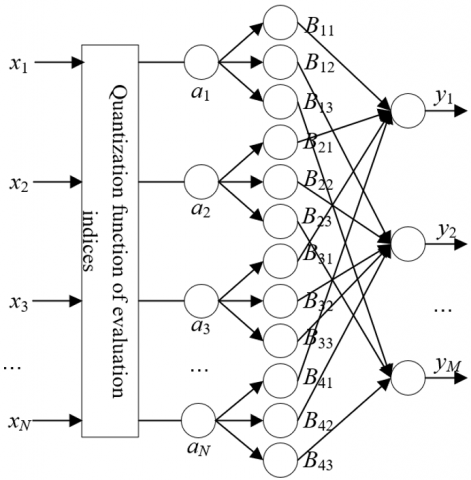
This paper designs an FCE model based on three-layer BPNN, which takes the features of corporate marketing mix strategy as the input vectors, and the FCE values as the outputs. The overall structure of the three-layer BPNN is described in Figure 7. Below is a detailed introduction of the network.
Figure 7. The structure of three-layer BPNN
In the input layer, the nodes were determined according to the data representation method and the problem to be solved in the evaluation of corporate marketing mix strategy. Let N be the number of input layer nodes. The input and output of the layer can be respectively expressed as:
$I_{s}^{1}={{a}_{s}}$ (23)
$O_{st}^{1}={{a}_{s}}$ (24)
The intermediate layer solves the membership of each input index to each evaluation level. Suppose there are M evaluation indices in the network. Then, the intermediate layer needs to have M*N nodes. The membership was described by the following trigonometric function:
If t=1, Bt corresponds to indices b1 and b2, and the membership function can be expressed as:
$\mu_{1}(a)=\left\{\begin{array}{ll}1 & a \leq b_{1} \\ \frac{b_{2}-a}{b_{2}-b_{1}} & b_{1}<a<b_{2} \\ 0 & a>b_{2}\end{array}\right.$ (25)
If 1<t<N, Bt corresponds to indices bt-1, bt, and bt+1, and the membership function can be expressed as:
$\mu_{t}(a)=\left\{\begin{array}{ll}0 & a \leq b_{t-1}<o r a \geq b_{t+1} \\ \frac{a-b_{t-1}}{b_{t}-b_{t-1}} & b_{t-1}<a<b_{t} \\ \frac{b_{t+1}-a}{b_{t+1}-b_{t}} & b_{t} \leq a \leq b_{t+1}\end{array}\right.$ (26)
If t=N, Bt corresponds to indices bN-1 and bN, and the membership function can be expressed as:
$\mu_{N}(a)=\left\{\begin{array}{lc}0 & x \leq b_{N-1} \\ \frac{x-b_{N-1}}{b_{N}-b_{N-1}}& b_{N-1} <x \leq b_{N} \\ 1 & x>b_{N}\end{array}\right.$ (27)
The input and output of the intermediate layer can be respectively expressed by:
$I_{st}^{2}=O_{st}^{1}$ (28)
$O_{st}^{2}={{B}_{st}}\left( {{a}_{t}} \right)$ (29)
where, Bst(at) is the membership function of the t-th evaluation level. The output O2st is the membership of the t-th evaluation level, that is, the degree of fuzzy relationship between the s-th index and the t-th level.
The output layer makes the FCE of the input vectors of the corporate marketing mix strategy, and derives the evaluation vectors corresponding to the evaluation level domain from the evaluation level domain. The input and output of the output layer can be respectively expressed by:
$I_{st}^{2}=O_{st}^{\text{2}}$ (30)
$O_{st}^{\text{3}}=\sum\limits_{t=1}^{M}{{{\omega }_{t}}I_{st}^{\text{3}}}$ (31)
In this paper, the secondary FCE results (Table 1) are obtained by fuzzy fusion of the tertiary indices, which are designed to evaluate the marketing mix strategy of big marketing + service marketing, and the primary FCE results are obtained by fuzzy fusion of the secondary FCE results. Considering the relevant weights, the final FCE result of the proposed strategy was determined. Next, 600 data samples of the final result were imported to the BPNN for training, so that the result can approximate the complex mapping between fuzzy evaluation results and the ideal values of the indices. After 3,400 iterations, the BPNN gradually converged. Figure 8 records the decrease of the approximation error with the growing number of iterations.
Table 1. The secondary FCE results
|
Secondary indices |
Levels |
||||||
|
Strongly good |
Moderately good |
Slightly good |
Neutral |
Slightly bad |
Moderately bad |
Strongly bad |
|
|
E11 |
0.04 |
0.20 |
0.33 |
0.25 |
0.12 |
0.04 |
0.02 |
|
E12 |
0.02 |
0.38 |
0.22 |
0.20 |
0.14 |
0.03 |
0.01 |
|
E21 |
0.09 |
0.21 |
0.24 |
0.19 |
0.22 |
0.03 |
0.02 |
|
E22 |
0.08 |
0.30 |
0.33 |
0.10 |
0.12 |
0.04 |
0.03 |
|
E23 |
0.02 |
0.34 |
0.30 |
0.20 |
0.10 |
0.02 |
0.02 |
|
E24 |
0.06 |
0.30 |
0.20 |
0.19 |
0.16 |
0.05 |
0.05 |
|
E25 |
0.02 |
0.22 |
0.30 |
0.21 |
0.11 |
0.05 |
0.09 |
|
E31 |
0.09 |
0.31 |
0.28 |
0.10 |
0.18 |
0.03 |
0.01 |
|
E32 |
0.13 |
0.37 |
0.21 |
0.12 |
0.11 |
0.05 |
0.01 |
|
E33 |
0.09 |
0.37 |
0.18 |
0.10 |
0.18 |
0.06 |
0.02 |
|
E41 |
0.08 |
0.29 |
0.30 |
0.10 |
0.19 |
0.03 |
0.01 |
|
E42 |
0.03 |
0.31 |
0.21 |
0.18 |
0.20 |
0.05 |
0.02 |
|
E43 |
0.07 |
0.39 |
0.11 |
0.11 |
0.26 |
0.05 |
0.01 |
Figure 8. The decrease of approximation error with the growing number of iterations
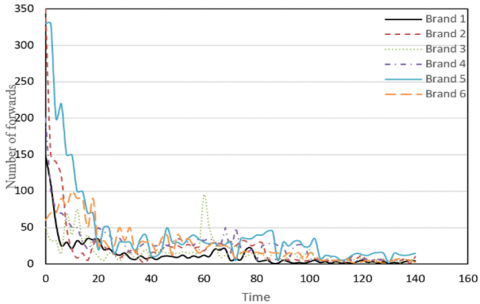
Figure 9. The time-variation of the number of forwards
To verify the effect of our model on the influence of corporate marketing mix strategy, the proposed model was applied to analyze the big data of online marketing of sports brands. The proposed information acquisition system directly collects the online big data, eliminating the human impact on the marketing process. The collected data were analyzed by visualization technology, providing an intuitive picture to the effect of the marketing mix.
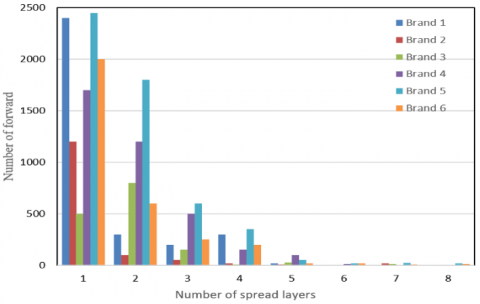
Figure 9 illustrates how the number of forwards of positive reviews on the products of different brands varies with time. It can be seen that, under our marketing mix strategy, the positive reviews on the products of brands 1, 2, and 5 were forwarded much more frequently than those of other brands. The forwarding of positive reviews is positively correlated with the brand influence. This result is confirmed by the spread of positive reviews on the products of different brands (Figure 10). The widely spread reviews have a nonnegligible impact on product optimization.
Figure 10. The spread depth of positive reviews
Figure 11. The trend of consumer influence of corporate marketing mix strategy
Figure 12. The trend of reviews on products of different brands
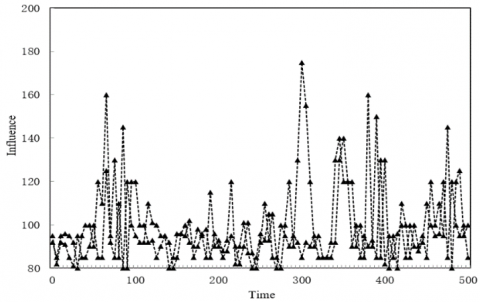
More than 10 million data samples on positive reviews, forwards, and likes were summarized, averaged, and normalized. Based on the proportional coefficients μL, μC, μF, and μCF, the trend of consumer influence of corporate marketing mix strategy was plotted (Figure 11). Combining Figures 8, 9, and 11, it can be seen that consumer influence was not closely correlated with the number of reviews or followers in important periods; neither was consumer influence deeply associated with the frequency of reviews. Hence, the semantic information in reviews needs to be further mined.
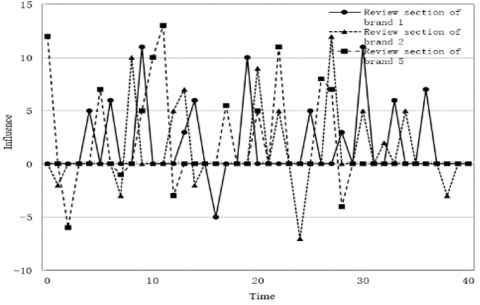
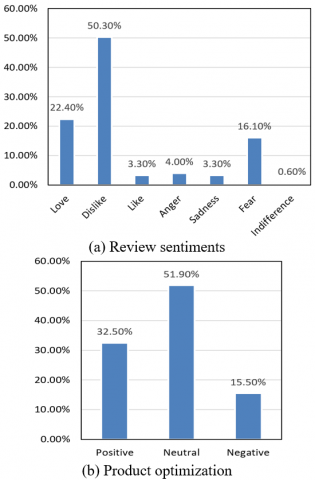
Figure 12 presents the trend of reviews on products of three brands. Obviously, the product reviews on the three brands tended to be positive. Despite the presence of negative words, the reviews have positive impact on product optimization. Figure 13 displays the influence of our strategy on the sentiments of reviews and product optimization.
Figure 13. The influence of our strategy on review sentiments and product optimization
This paper presents an ANN-based effect analysis model for corporate marketing mix. First, the authors designed a complete EIS for the effect of corporate marketing mix, and determined the weight of each index through AHP. Based on the secondary FCE results, the final FCE result of corporate marketing mix was calculated, and adopted as the inputs of the ANN. On this basis, a corporate marketing mix strategy was established by combining big marketing with service marketing, and subject to the FCE. Finally, an FCE model was created for the effect analysis of corporate marketing mix, based on three-layer BPNN. Finally, the proposed model was proved effective through experiments, and the consumer influence of our strategy was analyzed based on the model outputs.
[1] Kunz, M., Bretschneider, U., Leimeister, J.M. (2016). Woohoo TinkerBots! The Marketing Effect of Crowdfunding. International Conference on Information Systems.
[2] Debnath, D., Thompson, W., Helmar, M., Orman, T. (2016). Effect of the Southeastern Anatolia Project (GAP) on cotton markets of Turkey and the world. Journal of Cotton Science, 20(1): 46-55.
[3] Pono, M., Munir, A.R., Maming, J., Kadir, N. (2019). Mediation effect of acculturative aesthetic attractiveness on the relation of product innovation to increase SMEs marketing performance. IOP Conference Series: Earth and Environmental Science, 235(1): 1-8. https://doi.org/10.1088/1755-1315/235/1/012065
[4] Borůvka, V., Dudík, R., Zeidler, A., Holeček, T. (2019). Influence of site conditions and quality of birch wood on its properties and utilization after heat treatment. Part I—Elastic and strength properties, relationship to water and dimensional stability. Forests, 10(2): 189. https://doi.org/10.3390/f10020189
[5] Almasarweh, M.S., Alnawaiseh, M.B., Alsaraireh, A.A., Al Wadi, S. (2019). Intellectual capital and effect on marketing performance an empirical study in Jordanian pharmaceutical industrial firms. Italian Journal of Pure and Applied Mathematics, 42: 954-964.
[6] Al-Dmour, H.H., Asfour, F., Al-Dmour, R., Al-Dmour, A. (2020). The effect of marketing knowledge management on bank performance through fintech innovations: A survey study of Jordanian commercial banks. Interdisciplinary Journal of Information, Knowledge, and Management, 15: 203-225. https://doi.org/10.28945/4619
[7] Abidin, Z., Triono, L.D. (2020). Fresh frozen fish consumer behavior: Effect of the mix and trust marketing on buying interest, purchase decision and customer satisfaction in E-commerce, silly fish Indonesia. In IOP Conference Series: Earth and Environmental Science, 493(1): 012041. https://doi.org/10.1088/1755-1315/493/1/012041
[8] Nurulhaq, H. (2019). The effect of green marketing of plastic bag ban policy in modern retail stores on consumer green behavior in Bogor city. In E3S Web of Conferences, 125: 08003. https://doi.org/10.1051/e3sconf/201912508003
[9] Müller, J., Christandl, F. (2019). Content is king–But who is the king of kings? The effect of content marketing, sponsored content & user-generated content on brand responses. Computers in Human Behavior, 96: 46-55. https://doi.org/10.1016/j.chb.2019.02.006
[10] Kimixay, L., Liu, C., Liu, X.D. (2019). An empirical study to understand the effect of email marketing on consumer's online buying behavior in a developing country. In Proceedings of the 2019 3rd International Conference on Management Engineering, Software Engineering and Service Sciences, pp. 179-183. https://doi.org/10.1145/3312662.3312669
[11] Riantini, R.E. (2019). The effect of omni channel marketing on the online search behavior of Jakarta retail consumers with Theory of Planned Behavior (TPB) approach. In 2019 International Conference on Information Management and Technology (ICIMTech), 1: 284-289. https://doi.org/10.1109/ICIMTech.2019.8843833
[12] Alam, M.S.A., Wang, D., Waheed, A. (2019). Impact of digital marketing on consumers' impulsive online buying tendencies with intervening effect of gender and education: B2C emerging promotional tools. International Journal of Enterprise Information Systems (IJEIS), 15(3): 44-59. https://doi.org/10.4018/IJEIS.2019070103
[13] Verma, K., Malik, S.K., Khanna, A. (2020). A novel approach to improve website ranking using digital marketing. In International Conference on Innovative Computing and Communications, pp. 265-278. https://doi.org/10.1007/978-981-15-1286-5_23
[14] Chodak, G., Chawla, Y., Dzidowski, A., Ludwikowska, K. (2019). The effectiveness of marketing communication in social media. In ECSM 2019 6th European Conference on Social Media; Academic Conferences and Publishing Limited: Sonning Common, UK, pp. 73-81.
[15] Kouchaki, M., Jami, A. (2018). Everything we do, you do: The licensing effect of prosocial marketing messages on consumer behavior. Management Science, 64(1): 102-111. https://doi.org/10.1287/mnsc.2016.2571
[16] Ma, T. (2019). Evaluation effect of Internet word of mouth and application of big data. In Journal of Physics: Conference Series, 1187(5): 052050. https://doi.org/10.1088/1742-6596/1187/5/052050
[17] Intyas, C.A., Primyastanto, M. (2020). Marketing mix development analysis of preserved tongkol (Euthynnes affinis) on customer satisfaction in Malang, East Java, Indonesia. In IOP Conference Series: Earth and Environmental Science, 493(1): 012043. https://doi.org/10.1088/1755-1315/493/1/012043
[18] Wahyuningrum, A.D., Kristanti, N.E., Widodo, K.H. (2020). Analysis of the influence of marketing mix on the sales online of processed products salak (Sallaca zalazza (Gaert.) Voss.). In IOP Conference Series: Earth and Environmental Science, 425(1): 012027. https://doi.org/10.1088/1755-1315/425/1/012027
[19] Ghiffarin, A.R., Priyandari, Y., Liquiddanu, E. (2019). Marketing analysis for e-commerce improvement in small and medium enterprise of batik using e-commerce marketing mix model. In IOP Conference Series: Materials Science and Engineering, 495(1): 012044. https://doi.org/10.1088/1757-899X/495/1/012044
[20] Ulkhaq, M.M., Wijayanti, W.R., Dewi, W.R., Prayogo, A., Aulia, F.S., Utami, A.A., Mustikasari, A. (2018). Formulating a marketing strategy of SME through a combination of 9Ps of marketing mix and Porter's five forces: a case study. In Proceedings of 2018 International Conference on Big Data Technologies, pp. 109-114.
[21] Nusran, M., Basri, M., Ahmad, L., Paris, A.Y. (2018). Analysis of marketing mix on the decision of the purchasing of Toyota Kijang Innova car using method of structural equation modeling (SEM). In IOP Conference Series: Earth and Environmental Science, 175(1): 012016. https://doi.org/10.1088/1755-1315/175/1/012016
[22] Zhang, J.J., Yang, L. (2017). A simple analysis of revolution and innovation of marketing mix theory from big data perspective. In 2017 IEEE 2nd International Conference on Big Data Analysis (ICBDA), pp. 410-413. https://doi.org/10.1109/ICBDA.2017.8078852
[23] Bukova, B., Brumercikova, E., Kondek, P., Groma, P. (2017). The usage of cognitive maps in the comparison of marketing mix of railway passenger transport. Procedia Engineering, 187: 498-503. https://doi.org/10.1016/j.proeng.2017.04.406
[24] Alizadeh, A.V., Serdaroglu, R. (2016). Application of Z-restriction-based multi-criteria choice to a marketing Mix problem. Procedia Computer Science, 102: 239-243. https://doi.org/10.1016/j.procs.2016.09.396
[25] Moradi, M., Aghaie, A., Hosseini, M. (2015). An agent-based knowledge management framework for marketing-mix decision making. In Research Methods: Concepts, Methodologies, Tools, and Applications, pp. 482-502. https://doi.org/10.4018/jsds.2013070106