Bhanu Prakash Battula* | Duraisamy Balaganesh
© 2020 IIETA. This article is published by IIETA and is licensed under the CC BY 4.0 license (http://creativecommons.org/licenses/by/4.0/).
OPEN ACCESS
From last few years, the focus involved in hospital management is quality care of patient. An essential measurement of care quality shows restraint readmissions. Numerous strategies exist to factually recognize patients well on the way to require clinic readmission. Right recognizable proof of high-chance patients permits medical clinics to astutely use constrained assets in relieving emergency clinic readmissions. Be that as it may, these techniques have seen minimal pragmatic selection in the clinical setting. This examination endeavors to distinguish the many open research addresses that have blocked far reaching appropriation of prescient emergency clinic readmission frameworks. Current frameworks frequently depend on organized information extricated from wellbeing records frameworks. This information can be costly and tedious to remove. Unstructured clinical notes are rationalist to the fundamental records framework and would decouple the prescient examination framework from the basic records framework. In any case, extra worries in clinical characteristic language preparing must be tended to before such a framework can be executed. In this paper we use the automated approach of predicting the possible hospital readmission. For to automate we use multi-layer perceptron model with an optimization technique. Current research focus on deep learning models but it takes huge time to make classification of data, proposed approach uses the firefly optimization it reduces the time taken for classification.
firefly optimization, multi-layer perceptron, hospital readmission, mimic-3 data, quality care of patient, machine learning, prediction, electronic medical data
Re-admission may occur if there is an incomplete or poor treatment of patients or improper coordination between the patient and the hospital [1]. Readmission is considered as a serious problem to the quality of care of hospitals. In the U.S, the government fines the hospitals if they have re-admissions more than a certain limit for the cases which were preventable with better outpatient care. This proves to be very expensive for the hospitals. Moreover, high re-admission rates indicate low quality of care to patients. Therefore, reducing re-admission rates is considered to be a topic of great importance. The cost of re-admission was totalled to $25 billion for a single year alone in the U.S. [2]. Research indicate big savings opportunities to be accomplished in identification of preventable re-admission cases through increasing efficiency. The Health Innovation Network for Excellence (NEHI) has shown that the total hospital reception by enhancing patient admission and discharge methods, providing better follow up care and utilizing health information technology can cut hospital readmission by up to 12% [3]. Worldwide experiments to reduce re-admission rates are being carried out [4]. The lowering in re-entry levels worldwide poses a major obstacle. Because it has an impact on patient care quality, healthcare costs and the use of hospital resources and the image of the healthcare provider, it has been an area of research focus [5]. Some work has already been done on predicting re-admission. However, most of them have poor results in reducing the re-admission rates. Improvements in information management, data warehousing technologies and storage costs have provided medical centres, telecommunication industries, banks, and other service providers with the advantage of collecting and storing large volumes of data. Machine learning (ML) is a field of data mining which can be used for predictive analytics. ML algorithms have proven to be useful in a variety of application domains. Using ML, a set of clinical cases from the patient records can be used to detect patterns and make observations that can help in improving the quality of care. ML algorithms were, from the very beginning, designed and used to analyse medical data sets [6]. Today there are several ML techniques to analyse the data. The development of ML and its applications has let systems and methodology to emerge that enable advanced and sophisticated data analysis [7]. ML has many applications in the healthcare industry like prediction of disease progression, extraction of medical knowledge for outcomes research etc. Using ML, it has become possible to integrate computer systems in healthcare field to assists experts in increasing efficiency and quality of medical care [8]. It can be used to study the attributes of the patients who were re-admitted into the hospitals from the historical data and for developing a model that can be used to predict re-admissions. There are a few models that were designed using ML. However, more efforts are needed to improve their performance [9]. Most of the studies cannot be deployed in a clinical setting because they do not have sufficient accuracy in predicting re-admissions [10].
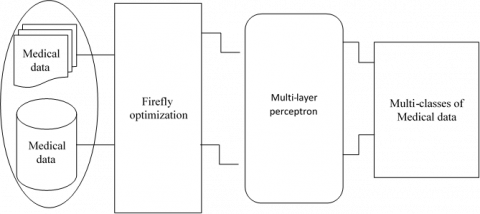
Here Figure 1 shows the electronica medical data (EMD). The main aim of our research is to address the problem of preventable re-admissions in hospitals. We will use machine-learning techniques to analyses the historical medical data of the patients and predict future re-admissions, which may help in reducing costs and distinctively improve the quality of care at hospitals. For to address these in this paper we used the MIMIC3 (Medical Information Mart for Intensive Care III) data and analysis is made using multi-layer perceptron. Alone MLP (Multi-layer perceptron) takes huge time in processing medical data. For to reduce the training time more accurate prediction we used the firefly optimization.
Figure 1. Electronic medical data representation
The remainder of the paper is arranged according to the literature review mentioned in section-2, the study of possible methods is discussed in section-3, experimental evaluation is outlined in section 4 and the paper closes in section 5.
The readmission in hospitals is detrimental to patients and unsustainable systems for emergency care. About one-fifth of the medicare beneficiaries in FY 2003-04 – in excess of 2,3 million – were readmitted within 30 days of issuance, at a $17 billion cost, around 20% of the total Medicare payout. In 2005, the Medicare Payment Advisory Commission (MedPAC) reported that 17.6% of all-inclusive hospitalizations accompanied by 30-day after-release readmissions were 11.3% within 15 days and 6.2% within 7 days. Analysis has also found that the integrated levels of readmission in the United States is among the lowest in comparison with European countries [11]. Readmission has also been identified to connect access to welfare management and treatment [12]. Patients who are re-enrolled in hospitals can suffer early discharge, inadequate care management and even misconceived outcomes. Research also indicates that extended, institutionalized readmission rates for 30-day threat thresholds are correlated with lower sustained output. In any event, a wide range of readmissions is clearly arranged and considered suitable especially when strategies or medical procedures are employed. Nevertheless, the most professional way to effectively distinguish "terrible" readmissions from others that might be appropriate at this stage is not accepted. Yet again, the Centers for Medicare and Medicaid Services (CMS) started to look at presentations of the hospital from the readmission levels at their Patient Compare website, with a highly accessible readmission period of 30 days. In fact, packs of elevated levels of readmission for heavy-duty concentrated myocardial necroses (AMI), coronary failure (HF), and pneumonia have sacrificed 1% of their Medicare expenditures effective Oct. 1 2012, according to # 3025 Patient Protection and Accessible Care Act (PPACA, recognized as the Obama Care Ruling). The slice would rise to 2 per cent in 2014 and up to 3 per cent in 2015 for FY. This has contributed to surprise and surprisingly 2.213 US hospitals with some $280 million national support. Consequently, approximately 33% of Michigan hospitals (55) were approved in FY 2013 [13]. Similar to $14 million. Over the last five years, politicians and social care providers have also extended their intercession services to the readmissions and improve the patient's wellbeing. In general, readmission (in other terms, rehospitalization) is known to be the transfer of a hospitalization during a given transitional duration, after an earlier confirmation and discharge, to an equal (or unique) treatment facility. Given the assumption that the option of a temporary duration impacts the readmission pace, there is no specific time limit, and various transitional intervals have been envisaged spanning seven days to one year. The figure of the readmission rate is often balanced with certain avoidances for the intensive consideration of hospitalisation. These can include statements within 24 hours of discharge, rest with nursing and restoration facilities, and patients kicked out the bucket for as long as one day following discharge. From a viewpoint architecture structures, multiple variables contribute to readmission and their analysis is very puzzled [14]. Nevertheless, owing to budget limits, people with a significant likelihood of readmission continue to be marked, which benefit more by changing certain arrangements. It is usually achieved using reputable formulas, including attempting to aggregate high-risk patients by utilizing thinking equations or generating a likelihood score for improvement of re-admission of a given chance. The prior class uses directed, unassisted methodologies without any understanding of the central instrument that generates the knowledge, and the latter uses empirical models with agreed knowledge that originates from a specific stochastic model of information. Growing type of procedure has its own advantageous conditions and drawbacks in terms to misclassification errors as well as clear assumptions and technical difficulties. In general it has been noticed that several of these precious models will not function as far as the separating capacity is concerned [15]. This will provide one aspect of the present analysis with improved prediction models, reducing these write entanglements. However, under some specific circumstances inside the readmission issue the new methods cannot legally be implemented. Models can integrate statistical expectations while data comprehension is blue penicillate, calculating knowledge with imbalanced class issues collected, and divisive risk levels spaced with time based covariations until the conclusion of the study era. In addition to a variety of precious development initiatives for the readmission issue, the text often relates to an innovation framework to handle operating costs and incentives that intercession ventures may carry into the area of clinical science. These methodologies will have a lot of information in order to select appropriate solutions to job confirms / releases and to reach patient care system market destinations when following some organizational limitations [16]. That will contribute to the creation of a research programming system that should preferably delegate mediating tasks to patients who are usually susceptible to re-admission in a facility. Cotter et al. [17] have implemented a common additive model to forecast the probability of readmission to hospitals by a general population of approximately 400,000 patients and described as a 4,000 dimensional vector. Kumar et al. [18], using the patient admission data from the vast hospital chain in the northwest United States, examined the estimation of hospital acceptance in the entire period through machine learning approaches (vector supporters, decision trees, random forests and a popular booster system). Ses experiments have shown the greater ability of machine learning models as compared to LACE and HOSPITAL for hospital readmission prediction.
The main aim of our research is to address the problem of preventable re-admissions in hospitals. We will use machine-learning techniques to analyse the historical medical data of the patients and predict future re-admissions, which may help in reducing costs and distinctively improve the quality of care at hospitals (Figure 2). For to address these in this paper we used the MIMIC3 data and analysis is made using multi-layer perceptron. Alone MLP takes huge time in processing medical data. For to reduce the training time more accurate prediction we used the firefly optimization.
Info: Set of information sources (P1,P2,P3..., Pn) and it resultant goles (T1,T2,......Tn), learning parameter , light assimilation coefficient.
Yield: Modified Weight and Bias framework, SSE (total of squared Error), correct pace of
Grouping.
Start:
Produce a rundown of various loads utilizing Eq. (6).
Figure whole of squared blunder (SSE) for each produced weight. Here SSE list is considered as an exhibition file and every blunder esteem is treated as one firefly.
While True:
Discover least blunder from SSE list and dole out it to fj (more splendid firefly)
while k < (length of SSE list):
Discover any worth other than fj (more brilliant firefly) and dole out it to the variable fi (less more brilliant).
On the off chance that (fj< fi):
Compute the separation among fi and fj utilizing Eq. (4).
Move the Firefly Fi towards Fj utilizing Eq. (17).
Change comparing weight and predisposition esteem utilizing Eq. (18) and Eq. (19)
Else: Pass
End If
Presently recalculate the SSE with new arrangement of changed weight and predisposition list.
Compute right arrangement rate on every emphasis.
Builds the estimation of K by one.
End While
On the off chance that (avg. right arrangement >threshold):
Stop the enhancement and store result.
Else: proceed with enhancement
End While
The bio-radiance forms are answerable for the blazing light of fireflies. There are a few clashes on the thoughts behind explanation and significance of blazing light in fireflies life cycle, yet a large portion of these thoughts are identified with the mating stage [19]. The central capacity of blazing light is to draw in mating accomplice, and right now procedure of bioluminescence is known as luminescent discharge [20]. The remarkable example of the glimmering light is the sign for their status on mating, and a result of such right luminescent emanation process is to bring two fireflies of same species for sex [21]. The Photinus is a one sort of firefly animal varieties, and among them the male firefly utilizes a concise sign example, and female firefly reacts to it in a specific time interim [22]. Different types of firefly show distinctive mating practices on various conditions.
Analysis of the Firefly based back-propagation method:
The back-propagation feed forward neural network is combined with firefly optimization. The calculation is consolidated to upgrade the exhibition file of this back-propagation neural network [23].
The patterns are different for different species. The light intensity and attractiveness play a significant role. The assumption that attractiveness is related to brightness and in turn related to objective function.
Figure 2. Firefly based MLP for medical data classification
At a location ‘x’ Firefly brightness ‘I’ can be selected as I(x)α f(x).
The parameter ‘β’represents attractiveness. It is a subjective and relative attribute acts upon the individual Firefly. The absorption co-efficient or degree of absorption of media acts as an additive in formulating the attractiveness. The intensity of light varies with inverse square law
I(r) = Is/r2 (1)
where, Is - is sourceIntensity?
r - Distance
I – Intensity of Light
‘γ’ – Absorption co-efficient
Hence,
I_0 Intensity of light at distance r =0. (2)
By combining Intensity and absorption basing on Gaussian law
I(r)=I_0 e-γr2 (3)
From this above equation attractiveness β can be estimated by
β = β_0 e-γr2 (4)
The above equation can be written as
β = (β0)/(1+γr2) (5)
From Eqns. (4) and (5)
The characteristic distance = 1/√γ
Changes the attractiveness significantly from
β_0 to β_0 e-1 for Eq. (4) Or β_0/2 (5.1)
In general, monotonically decreasing can be
$B(r)=\beta \text{ 0 }{{e}^{\gamma {{r}^{m}}}}\text{ }(m\ge 1)$ (6)
The plan of back-propagation neural network comprises of three layers and each layer contains one neuron. The yield from every neuron is determined as:
${{p}^{(n+1)}}(r)={{f}^{(n+1)}}({{N}^{^{(n+1)}}}(r))$ (7)
p = output of a neuron, f = transfer function, N = net output from a neuron. The proposed firefly calculation based back-propagation is started with a lot of arbitrarily produced weight. At that point each haphazardly produced weight is passed to the back-propagation neural network for additional preparing. The whole of squared mistake for each weight framework is delivered on portrayal of all information design grids through back-propagation neural network. The arrangement of all aggregate of squared blunder is considered as a presentation list for proposed firefly based back-propagation calculation. Thus, the weight estimations of a weight network are determined as follows:
$W{{V}_{m}}=\sum\limits_{m=1}^{l}{a.(rand-\frac{1}{2})}$ (8)
where, WVm = mth weight an incentive in a weight framework, m = (1,2,3,....,l) The 'rand' in Eq. (8) is the irregular number somewhere in the range of 0 and 1, 'an' any consistent parameter for the proposed strategy it being short of what one. So the rundown of weight grid is as per the following:
Presently from back-propagation forms total of squared blunders can be effectively determined for each weight network in WL. Along these lines, as indicated by the back-propagation technique the total of squared mistake is determined as follows:
${{W}^{L}}\text{= }\!\![\!\!\text{ WV}_{m}^{1}\text{, WV}_{m}^{2}\text{, WV}_{m}^{3}\text{, }...\text{, WV}_{m}^{(q-1)}\text{ }\!\!]\!\!\text{ }$ (9)
where, t = Target of each input pattern, p = input pattern matrix. Presently for proposed strategy, the presentation file is determined utilizing following recipe:
$V(x)=\sum\limits_{(j=1)}^{m}{{{({{t}_{j}}-{{p}_{j}})}^{T}}\cdot ({{t}_{j}}-{{p}_{j}})}=\sum\limits_{(j=1)}^{m}{{{e}^{T}}\cdot }e$ (10)
The gradient is the first-order derivative of performance index, and it is calculated as
$F(v)=\sum\limits_{(i=1)}^{q}{v{{(x)}^{T}}\cdot v(x)}$ (11)
Now from Eq. (11) the gradient is calculated as
$\nabla F(v)=[\frac{\partial (F(v))}{\partial {{v}_{1}}},\frac{\partial (F(v))}{\partial {{v}_{2}}},..\frac{\partial (F(v))}{\partial {{v}_{n}}}]$ (12)
$\nabla F(v)=2\sum\limits_{(i=1)}^{(q)}{{{v}_{i}}(x)\cdot \frac{\delta {{v}_{i}}(x)}{\delta x}}$ (12.1)
The weight and bias values of back-propagation neural network are calculated as follows
$W_{(r,j)}^{(n+1)}=W_{(r,j)}^{n}-\lambda .{{s}^{n}}{{({{a}^{(n-1)}})}^{T}}$ (13)
$B_{(r,j)}^{(n+1)}=B_{(r,j)}^{n}-\lambda .{{s}^{n}}$ (14)
Here, Ȝ is the learning parameter and Sn is the affectability of nth layer. The affectability of one layer is determined from the affectability of the past layer, and consequently the count of the affectability is performed from the back and through the neural network in a recursive request. The affectability is determined as follows:
${{S}^{n}}={{f}^{n}}({{N}^{n}})\cdot ({{W}^{(n+1)}})\cdot {{s}^{(n+1)}}$ (15)
and for the input layer it is calculated as
${{S}^{n}}=-2.{{f}^{n}}({{N}^{n}})\cdot ({{t}_{j}}-{{p}_{j}})$ (16)
Along these lines, the aggregate of squared blunders v(x) is determined utilizing Eq. (10) after complete portrayal of all information designs. As indicated by the proposed technique the presentation records an incentive for each portrayal of weight from WL list is determined utilizing Eq. (9), and this worth is independently put away on a presentation file list.
${{F}^{L}}(x)=[{{f}_{1}}(x),{{f}_{2}}(x),{{f}_{3}}(x),...,{{f}_{n}}(x)]$ (17)
The estimations of FL (x) are considered as firefly and they are likewise viewed as that they are on mating rivalry. So as to fuse the firefly calculation into backpropagation neural network preparing technique the accompanying realities are considered for firefly based back-propagation preparing calculation 1) The primary worry of back-propagation preparing calculation is to lessen the exhibition file. The base blunder in a presentation list is considered here as appealing fireflies. 2) The high blunder = Low appeal, and Low error= High engaging quality. 3) On each effective cycle, the light retention coefficient (η) increments to unite the hunt procedure. During this stage the slope of back-propagation calculation diminishes to fix on a worth, it being united at long last. It is obviously seen that Eq. (1) and Eq. (17) are consistently same, and
$\nabla {{f}_{i}}={{f}_{i}}+{{L}_{0}}{{e}^{(-{{\eta }^{2}})}}({{f}_{j}}-{{f}_{i}})+\alpha (rand-\frac{1}{2})$ (18)
It is anything but difficult to locate the most alluring firefly from execution file list (Eq. (17)). In the proposed technique the more splendid one is recognized as fj, and rest of less more brilliant one is distinguished fi. Presently the separation among fi and fj are determined utilizing Eq. (4) and the force of their glimmering light is determined from Eq. (3). Presently development of firefly fi to fj is controlled by the accompanying equation:
$W_{(r,j)}^{n+1}=W_{(r,j)}^{n}-\Delta {{F}_{i}}$ (19)
The second piece of the Eq. (18) is because of the allure. The last term of the Eq. (18) is randomization with a consistent parameter '∝'. Presently so as to make it emotional towards learning forms, the concerned weight network of the weight list is balanced by the accompanying equation:
$B_{(r,j)}^{(n+1)}=B_{(r,j)}^{n}-\Delta {{F}_{i}}$ (20)
Relating inclination is balanced by the accompanying equation: ΔFi is the altered separation between firefly fi and fj. The calculation of proposed strategy comprises of two assembly criteria. The first is the normal right grouping, and the subsequent one is the normal entirety of squared mistakes. Both are determined after a total portrayal of all weight frameworks in weight list through the proposed technique. The normal total of squared blunders is the normal of every single squared mistake, and it is produced for every cycle. The right arrangement is the level of information and yield coordinating. On the off chance that the info is identical with yield, at that point it creates a high rate, in any case the rate is low. So after a total emphasis normal pace of right arrangement can be handily determined. The proposed technique is started with one predefined normal right grouping and normal whole of squared mistake esteems as a one limit esteem.
Intensive Care data marts), which are a simple assessment tool accessible uninhibited. MIMIC III contains information related with 46K particular patients admitted to the basic consideration units of a huge tertiary medical clinic. The sorts of information incorporate socioeconomics, indispensable signs, indicative codes, and research center tests [24]. In view of the wide accessibility of analytic codes in social insurance information and the simplicity of exhibiting the outcomes delivered by the model without over the top clinical area information, we center around diagnostics codes right now. To guarantee enough clinical data about every patient, we incorporate 7.5K patients who had at any rate two emergency clinic confirmations in MIMIC-III [25] and afterward separate the demonstrative codes of each picked quiet. Furthermore, we keep up both the worldly request of indicative codes from numerous affirmations and the need based request of analytic codes inside one confirmation [26]. We utilize these successive demonstrative codes to foresee mortality. Regardless of whether a patient kicked the bucket or not is recorded in MIMIC-III, and we locate that 1.467K out of the chose 7.5K patients had passed on [27]. To keep up the first extent of mortality in both the preparation and test information, we utilize stratified examining to set 33% of the dataset as a test set and the rest as a preparation set. We have rehashed this stratified examining multiple times to create three arrangements of test and preparing information.
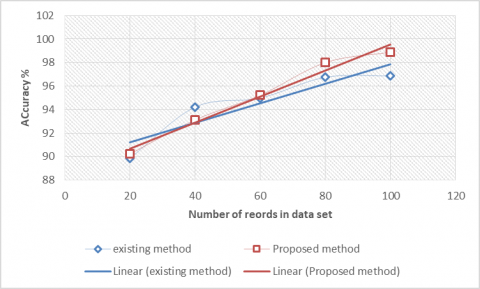
Figure 3. Accuracy
Accuracy represents the how correctly the mechanism behaves with respect to data. Here Figure 3 represents the accuracy percentage of existing model [28] and proposed mechanisms with respect to MIMIC-3 data for readmission prediction. The above graph clearly shows how the proposed mechanism performs better than state of art mechanism. And also proposed work clearly dominates when the number of records are increase accuracy also increases.
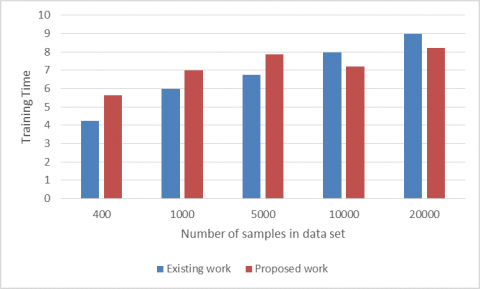
Time taken for mechanism to complete training with respect to number of samples in the data. Figure 4 shows the comparison of state of art mechanism [29] and proposed mechanism training times. Proposed one clearly dominates when increases number of samples. it’s because of proposed mechanism composed of firefly optimization, it clearly gives optimal time in training of MLP.
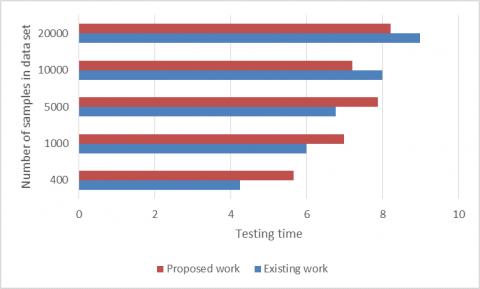
Figure 5 shows the comparison of state of art mechanism and proposed mechanism testing time. Proposed one clearly dominates when increases number of samples. It’s because of proposed mechanism composed of firefly optimization, it clearly gives optimal time in training of MLP.
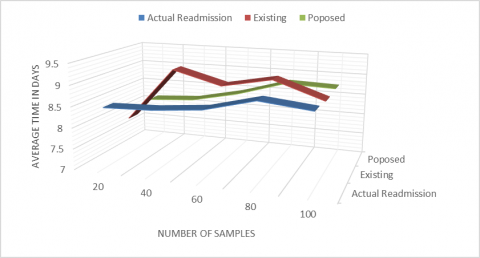
Figure 6 compares the average time of a patient re-admitted to hospitals with respect to actual and existing mechanisms. Our proposed method predicts more nearer to the actual. However, state of art mechanism fails in most of the cases.
Figure 4. Training time
Figure 5. Testing time
Figure 6. Identification of accuracy of readmission time with respect actual time
Prescient investigation of emergency clinic readmission is a significant research region with many open inquiries and potential for development. This examination tended to a large number of these open inquiries and gave a few researches approaches positive outcomes. Our readmission investigation framework speaks to a characteristic language way to deal with understanding readmission forecast. Automated approach of predicting the possible hospital readmission. For to automate we use multi-layer perceptron model with an optimization technique. Current research focus on deep learning models but it takes huge time to make classification of data, proposed approach uses the firefly optimization it reduces the time taken for classification. Our methodology offers the favourable position that different information assortment isn't required for readmission forecast since clinical notes are as of now gathered by clinical organizations. Along these lines, our framework presents simple combination into existing EMD frameworks. With the expansion in EMD frameworks, clinical notes will turn out to be progressively significant and NLP methods should be viewed as while making choice emotionally supportive networks. The outcomes have demonstrated the significance of highlight determination and model creation time to the usage of down to earth frameworks.
[1] Chassin, M.R., Loeb, J.M., Schmaltz, S.P., Wachter, R.M. (2010). Accountability measures using measurement to promote quality improvement. New England Journal of Medicine, 363(7): 683-688. https://doi.org/10.1056/NEJMsb1002320
[2] Jencks, S.F., Williams, M.V., Coleman, E.A. (2009). Rehospitalizations among patients in the Medicare fee-for-service program. New England Journal of Medicine, 360(14): 1418-1428. https://doi.org/10.1056/NEJMsa0803563
[3] Medicare Payment Advisory Commission. (2007). Report to the Congress: Promoting greater efficiency in Medicare. Medicare Payment Advisory Commission (MedPAC).
[4] Tsai, T.C., Joynt, K.E., Orav, E.J., Gawande, A.A., Jha, A.K. (2013). Variation in surgical- readmission rates and quality of hospital care. New England Journal of Medicine, 369(12): 1134-1142. https://doi.org/10.1056/NEJMsa1303118
[5] Westert, G.P., Lagoe, R.J., Keskimäki, I., Leyland, A., Murphy, M. (2002). An international study of hospital readmissions and related utilization in Europe and the USA. Health Policy, 61(3): 269-278. https://doi.org/10.1016/S0168-8510(01)00236-6
[6] Friedman, B., Basu, J. (2004). The rate and cost of hospital readmissions for preventable conditions. Medical Care Research and Review, 61(2): 225240. https://doi.org/10.1177/1077558704263799
[7] Jencks, S.F., Williams, M.V., Coleman, E.A. (2009). Rehospitalizations among patients in the Medicare fee-for-service program. New England Journal of Medicine, 360: 1418-1428. https://doi.org/10.1056/NEJMsa0803563
[8] Fiegl, C. (2012). 2200 hospitals face Medicare pay penalty for readmissions. American Medical News. http://www.ama-assn.org/amednews/2012/08/27/gvsb0827.htm.
[9] Reed, R.L., Pearlman, R.A., Buchner, D.M. (1991). Risk factors for early unplanned hospital readmission in the elderly. Journal of General Internal Medicine, 6(3): 223-228. https://doi.org/10.1007/BF02598964
[10] Benbassat, M.C., Kuykendall, H.D., Johnson, L.M., Wray, P.N., Wu, L. (1995). The association between quality of inpatient care and early readmission. Annals of Internal Medicine, 122(6): 415-421. https://doi.org/10.7326/0003-4819-122-6-199503150-00003
[11] Stone, J., Hoffman, G. (2010). Medicare hospital readmissions: Issues, policy options and PPACA. Congressional Research Service.
[12] Hanna, E.L., Racz, M.J., Walford, G., Ryan, T.J., Wayne Isom, O., Bennett, E., Jones, R.H. (2003). Predictors of readmission for complications of coronary artery bypass graft surgery. Journal of the American Medical Association, 290(6): 773-780. https://doi.org/10.1001/jama.290.6.773
[13] Soeken, K.S., Prescott P.A., Herron, D.G., Creasia, J. (1991). Predictors of hospital readmission: A meta-analysis. Evaluation & the Health Professions, 14(3): 262-281. https://doi.org/10.1177/016327879101400302
[14] Boutwell, A., Griffin, F., Hwu, S., Shannon, D. (2009). Effective interventions to reduce rehospitalizations: A compendium of 15 promising interventions. Cambridge, MA, Institute for Healthcare Improvement.
[15] Demir, E., Chaussalet, T., Xie, H.F., Millard, P.H. (2009). Modeling risk of readmission with phase-type distribution and transition models. IMA Journal of Management Mathematics, 20: 357-367. https://doi.org/10.1093/imaman/dpn032
[16] Sravanthi, G.L., Vasumathi Devi, M., Satya Sandeep, K., Naresh, A., Peda Gopi, A. (2020). An efficient classifier using machine learning technique for individual action identification. International Journal of Advanced Computer Science and Applications (IJACSA), 11(6). http://dx.doi.org/10.14569/IJACSA.2020.0110664
[17] Cotter, P.E., Bhalla, V.K., Wallis, S.J., Biram, R.W.S. (2012). Predicting readmissions: poor performance of the LACE index in an older UK population. Age & Ageing, 41(6): 784-789. https://doi.org/10.1093/ageing/afs073
[18] Ashok Kumar, S., Suresh Babu, E., Nagaraju, C., Peda Gopi, A. (2015). An empirical critique of on-demand routing protocols against rushing attack in MANET. International Journal of Electrical and Computer Engineering, 5(5). https://doi.org/10.11591/ijece.v5i5.pp1102-1110
[19] Norouzzadeh, S. (2011). A two-phase weighted classification model to assess patient readmission risk. Proc. of the 2011 Industrial Engineering Research Conference, Reno, NV.
[20] Hansen, L.O., Young, R.S., Hinami, K., Leung, A., Williams, M.V. (2011). Interventions to reduce 30-day rehospitalization: a systematic review. Annals of Internal Medicine, 155(8): 520-528. https://doi.org/10.7326/0003-4819-155-8-201110180-00008
[21] Kansagara, D., Englander, H., Salanitro, A., Kagen, D., Theobald, C., Freeman, M., Kripalani, S. (2011). Risk prediction models for hospital readmission: A systematic review. Journal of the American Medical Association 306(15): 1688-1698. https://doi.org/10.1001/jama.2011.1515
[22] Walraven, C., Bennett, C., Jennings, A., Austin, P.C., Forster, A.J. (2011). Proportion of hospital readmissions deemed avoidable: A systematic review. Canadian Medical Association Journal, 183(7): E391-E402. https://doi.org/10.1503/cmaj.101860
[23] Reed, R.L., Pearlman, R.A., Buchner, D.M. (1991). Risk factors for early unplanned hospital readmission in the elderly. Journal of General Internal Medicine, 6(3): 223-228. https://doi.org/10.1007/BF02598964
[24] Benbassat, J., Taragin, M. (2000). Hospital readmissions as a measure of quality of health care: Advantages and limitations. Archives of Internal Medicine, 160(8): 1074- 1081. https://doi.org/10.1001/archinte.160.8.1074
[25] Boulding, W., Glickman, S.W., Manary, M.P., Schulman, K.A., Staelin, R. (2011). Relationship between patient satisfaction with inpatient care and hospital readmission within 30 days. Am J Manag Care, 17(1), 41-48.
[26] Gopi, A., Suresh Babu, E., Naga Raju, C., Ashok Kumar, S. (2015). Designing an adversarial model against reactive and proactive routing protocols in MANETS: A comparative performance study. International Journal of Electrical & Computer Engineering, 5(5). https://doi.org/10.11591/ijece.v5i5.pp1111-1118
[27] Caruana, R., Lou, Y., Gehrke, J., Koch, P., Sturm, M., Elhadad, N. (2015). Intelligible models for healthcare: Predicting pneumonia risk and hospital 30-day readmission. In Proceedings of the 21th ACM SIGKDD International Conference on Knowledge Discovery and Data Mining, pp. 1721-1730. https://doi.org/10.1145/2783258.2788613
[28] Sushmita, Shanu, Khulbe, G., Hasan, A., Newman, S., Ravindra, P., Roy, S.B., De Cock, M., Teredesa, A. (2016). Predicting 30-day risk and cost of "all-cause" hospital readmissions. In AAAI Workshop: Expanding the Boundaries of Health Informatics Using AI: Technical Report WS-16-08453, 453-461.
[29] Johnson, A.E.W., Pollard, T.J., Shen, L., Lehman, L., Feng, M., Ghassemi, M., Moody, B., Szolovits, P., Celi, L.A., Mark, R.G. (2016). MIMIC-III, a freely accessible critical care database. Scientific Data, 3: 160035. https://doi.org/10.1038/sdata.2016.35