Fengwei Dai
© 2020 IIETA. This article is published by IIETA and is licensed under the CC BY 4.0 license (http://creativecommons.org/licenses/by/4.0/).
OPEN ACCESS
In the era of big data, the traditional property management strategies can no longer meet the demand for modern development. The property management enterprise should enhance their service capacity and core competitiveness through scientific and standard informatization. This paper designs the basic framework of property management information system (PMIS), and specifies nine key functional modules of the system, namely, intelligent information query module, intelligent information transmission and reception module, and intelligent bulletin module. On this basis, a user small data (USD) service model was constructed, and a PMIS-oriented management strategy was presented for massive small data. Simulation results show that the proposed data management strategy achieved good effects on clustering and load balancing.
internet of things (IoT), property management, small data management, clustering analysis
With the dawn of the Internet era, the focus of property management has shifted from operating scale to massive data management. The main concern is about how to use the Internet of things (IoT) and big data technology to lower operating cost, while improving operating efficiency and service satisfaction [1-5]. To realize modern and intelligent property management, the key is to combine the operation mode of Internet enterprises with that of traditional property management enterprises. The IoT technology should be utilized to enrich the content and functions of property management information system (PMIS), providing support to various property services [6-8].
The existing PMISs, which hinge on software development, mainly support message transmission and reception, inquiry of user information, and inquiry of payment information. In the Internet ecosystem, the service industry should attach greater importance to the personalized needs of users. Hence, modern property management must collect, integrate and process massive data about users and resource databases, in addition to building a complete information management system [9-13].
The information system that supports massive property management resources must be compatible and expandable, such as to efficiently achieve a variety of complex functions (e.g. information query and processing, information transmission and reception, and frequent interaction between users and the competent authority) [14, 15].
In recent years, numerous big data processing techniques have emerged, shedding new light on the storage, management, analysis, and mining of PMIS data. Based on .NET platform, Zhou et al. [16] created an intelligent model for community property management system, which realizes service functions like real-time monitoring, meter reading, and payment and parking management. Based on Java 2 Platform, Enterprise Eduction (J2EE), Yang and Nataliani [17] put forward a property information management scheme that combines the Model-View-Controller (MVC) design pattern for Java EE Web application and the Java data pattern. Taking the integrated framework of struts + spring + hibernate as the basic architecture, Wang et al. [18] designed a community property management system that integrates browser/server (B/S) and client/server (C/S). The designed system could manage fee collection, complaints, repairs, and statistics.
The quality of property services depends on the collection and rational use of massive data in PMIS [19-23]. To ensure the rational application of massive data, this paper designs the basic framework and nine functional modules of PMIS, and proposes a user small data (USD) service model that can screen specific user information (e.g. identity, historical service, location, and credit). On this basis, a PMIS-oriented management strategy was designed for massive small data. Based on Spark clustering, the USD were clustered in paralleled manner, and the machine loads were balanced despite the growing user demand.
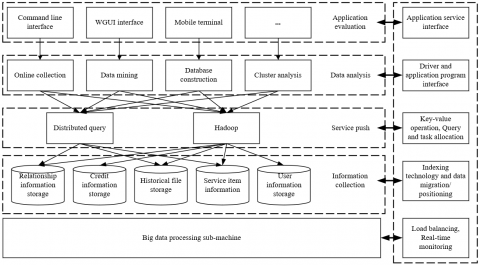
In the big data environment, the overall framework of PMIS (Figure 1) consists of information collection layer, data processing layer, service push layer, and application evaluation layer.
The information collection layer collects various kinds of data, making it possible to model data management and realize the functions of each functional module. The PMIS can collect information through multiple channels, such as the entry of schedule management records and the feedbacks from smart terminals, smart sensors, monitoring devices and electrical equipment. The collected data include basic information features, active data on property processes, pushed data, and third-party open data. The data might be structured, semi-structured or unstructured, resulting in a low density of valuable data. Hence, all the data must go through preprocessing operations like structural normalization, noise removal, and intelligent cleaning.
The data processing layer deeply mines the preprocessed heterogeneous data, and merges them into a database. Based on the basic database, the PMIS analyzes users within the scope of management, and detects or predicts the personalized needs of users, in the light of the real-time feedback data from different functional modules. Execution plans are generated on the core module of Hadoop, according to the complex distributed queries from the users. The more efficient the plan execution, the better the quality of system services. The data processing layer can also realize data logic operations, such as information migration and index construction.
The service push layer pushes intelligent services to users by integrating various application program interfaces and software development kits. The service provision is supported by the distributed program of Hadoop in the data processing layer.
The application evaluation layer provides users with intelligent information query, information transmission and reception, voting, complaints, as well as the man-machine interface and terminal services for other operations. This layer is constructed based on the specific business of each functional module of PMIS. The entire application service system is evaluated against two metrics: the profitability and user satisfaction of property management services.
Figure 1. Overall framework of PMIS
According to the structure and service items of PMIS, the functional modules of the system were summarized as follows:
(1) Intelligent information query module
This module supports comprehensive query of user information, facility and project information, related enterprise information, and operating sales and income records within the scope of property management.
(2) Intelligent information transmission and reception module
This module smoothens the communication between the property service provider and users, and realizes activity arrangement, notifications and family reminders via short message service (SMS).
(3) Intelligent bulletin module
This module publicizes the daily management records of the property management area, including sanitation, security, greening, fire protection, and maintenance of public facilities. The publicized information is subject to supervision by the competent authority and users.
(4) Voting module
This module allows relevant personnel to vote online on the matters requiring the joint participation of all users in the scope of property management. After log in and passing the identity check, the relevant personnel can vote on the matter and query the voting result at any time.
(5) Complaint management module
This module allows users to file online complaint that will be handled and fed back in time by the property management company. If the dispute cannot be resolved internally, the module will record the negotiation process and provide it to the competent authority.
(6) Housing repair module
This module allows users to apply for housing repair online. The property management enterprise will register the application, computes the repair cost according to the actual situation, and promptly notify the relevant personnel to handle the issue and provide feedback to the applicant. If the repair is too emergent to be handled, it will be reported to the relevant housing emergency repair center.
(7) Owners committee module
This module supports the operation of the owners committee, such as election recording, work information filing, and election notification.
(8) Credit information module
This module ensures that the users’ personal property credit information is filed annually, and subject to inquiries and supervision by the competent authority and users.
(9) Business application module
This module allows users to make an appointment for chargeable service items, namely, house and garage sales, housekeeping, and electrical maintenance, and the relevant services will be provided by the property management enterprise.
The user model of PMIS aims to provide users with personalized services, and describe the user demand features on each functional module. To build a full-featured system, the nine service modules were analyzed in details. For example, the intelligent information query module, intelligent information transmission and reception module, and housing repair module were analyzed with 5-layer, 4-layer and 3-layer data models, respectively. The results show that the more the number of layers, the more complex the module function and model structure.
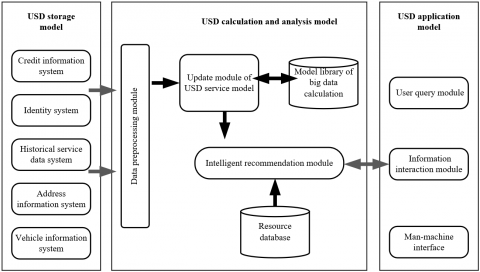
Based on small data, the user service model can be multi-source, multi-dimensional and multi-angle in terms of data source and analysis method, and thus achieve high precision and intelligence. Because the USD is as diverse, efficient and realistic as big data, the USD-based PMIS can realize both big data user modelling based on association rules, and user modeling based on cluster analysis. Following this train of thought, this paper proposes a compatible and scalable PMIS USD service model (Figure 2).
Figure 2. Block diagram of USD service model
As shown in Figure 2, the USD storage model stores the data about the basic information and historical behaviors that characterize the stable user features in the form of files. The USD calculation and analysis model mainly analyzes the association rules of the big data paradigm based on user features, and provides the USD application model with intelligent recommendation based on the user’s personalized demands, making property services more accurate. The USD application model receives user feedbacks in real-time services, and interacts with users using the information recommended by the USD calculation and analysis model, thereby implementing related services.
The above USD service model for PMIS extracts the information on stable user features and personalized demands. On this basis, this section presents a USD parallel clustering model with the aid of Spark clustering. The workflow of the clustering is explained in Figure 3, where fj is the feature of user ui, and each user ui corresponds to a set of features F.
Spark clustering was performed on the set U of USD service modules processed on the i-th big data sub-machine and the set F of user features and personalized demands, producing the set T of n classes on the machine and the set Ti,n of common objects in each class (T1,T2,…,Tm):
${{T}_{_{i},n}}=SPK\left( {{T}_{1}},{{T}_{2}},...,{{T}_{m}} \right)$ (1)
By formula (1), the main machine obtains the set of clusters and the set of features in each class. Then, Spark clustering was conducted to obtain the set Tk of k clusters:
${{T}_{k}}=SPK\left( {{T}_{1,n}},{{T}_{2,n}},...,{{T}_{m,n}} \right)$ (2)
Figure 3. The clustering process of USD service model
Our solution converts the big data clustering of user features into the clustering of distributed USD models. Firstly, each big data sub-machine performs Spark clustering on its responsible user features, divides the user features into n classes, and extracts the common features from each USD service model. Then, the main machine performs another clustering on the classes and features obtained through the first clustering. In this way, the PMIS acquires advantages in massive data management: the short computing time, the low pressure on storage space, and the high parallelism of command executions.
Let W1, W2, W3, and W4 be the clustering time of the proposed USD service model, the clustering time of traditional big data technique for user features, the time for a sub-machine to transmit the result of the first clustering to the main machine, and the clustering time of the main machine, respectively. Then, the clustering time of the proposed USD service model can be expressed as:
${{W}_{1}}=\frac{{{W}_{2}}}{m}+{{W}_{3}}+{{W}_{4}}$ (3)
It can be seen from formula (3) that W3 and W4 both increase with the number of classes k, but k must be far smaller than the number of USD service models. If there are many user models, W3+W4 can be approximated as zero. In this case, formula (3) can be transformed into W1=W2/m, that is, the clustering time decreases with the growing number of sub-machines.
The speed of machine response varies with the user demands and feedback speeds of PMIS functional modules. Therefore, this paper considers the problem of machine load balancing facing the growing user demands. Suppose a sub-machine counts the total uploaded files z corresponding to user demands and the size of each file in the period Δt from t1 to t2. Then, the file transmission speed v of the sub-machine can be expressed as:
$v={\sum\limits_{i=1}^{\text{z}}{{{C}_{i}}}}/{\Delta t}\;$ (4)
The machine load corresponding to a single USD service model can be expressed as:
$L=\frac{v}{b},0\le L\le 1$ (5)
where, b is the bandwidth of the sub-machine.
The mean load of sub-machines in the entire PMIS can be defined as:
$\overline{L}=\frac{\sum\limits_{i=1}^{m}{\sum\limits_{k=1}^{n}{{{L}_{i,k}}}}}{m}$ (6)
The total load of the k-th class and the error between the actual load and mean load after the loads of sub-machines have been balanced can be respectively obtained by:
${{L}_{k}}=\sum\limits_{i=1}^{m}{{{L}_{i,k}}}$ (7)
$E={{\sum\limits_{k=1}^{n}{\left( {{L}_{k}}-\overline{L} \right)}}^{2}}$ (8)
MATLAB simulations were conducted to verify the application effect of the proposed data management strategy, which is based on USD service model, in PMIS. The clustering effects and load balancing effects were compared at different number of users, number of user features, and the number of classes for common features.
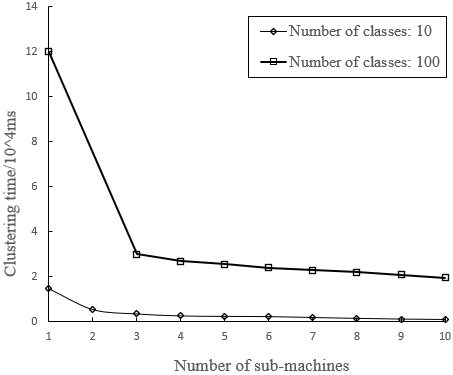
Firstly, the number of classes in USD service model was set to 20 and 50, respectively. Under the two scenarios, the relationships between clustering time and number of sub-machines are plotted as Figures 4 and 5, respectively. When there was only one user model, the clustering time equaled the time consumed by the traditional big data clustering of user features.
Figure 4. Clustering time at 20 user models
Figure 5. Clustering time at 50 user models
As shown in Figures 4 and 5, the proposed USD service model consumed less time than the traditional big data clustering of user features, and its clustering time decreases with the growing number of sub-machines. However, the superiority of the proposed model was obvious only when there are many user models. This is because our model has time loss in data transmission. If there are few user models, the ratio of data processing time to data transmission time of our model is relatively high. This ratio falls with the growing number of user models.
The precisions of different data clustering methods in PMIS were measured by misclassification rate (Table 1). Obviously, our data clustering strategy, which is based on USD service model, achieved relatively low misclassification rate. Table 2 compares the time consumption of multiple clustering methods. It can be seen that our strategy outperformed the contrastive methods in real-timeliness and time consumption.
Table 1. Comparison of misclassification rate
|
Number of epochs |
Classification-based clustering |
PSO-based clustering |
Our strategy |
|
200 |
0.437 |
0.357 |
0.104 |
|
400 |
0.279 |
0.292 |
0.043 |
|
600 |
0.202 |
0.168 |
0.006 |
|
800 |
0.189 |
0.135 |
0.002 |
Note: PSO refers to particle swarm optimization.
Table 2. Comparison of time consumption
|
Data size/kbit |
Classification-basedclustering/ms |
PSO-based clustering/ms |
Our strategy/ms |
|
400 |
4.97 |
3.76 |
1.56 |
|
600 |
5.89 |
5.43 |
2.24 |
|
800 |
8.05 |
9.63 |
3.07 |
|
1,000 |
12.44 |
14.72 |
3.89 |
Next, the number of user features was set to 5×10⁴ and 5×10⁶. Figures 6 and 7 provide the variations in clustering time with the number of sub-machines, at the two different settings of user features, respectively.
Figure 6. Clustering time at 5×10⁴ user features
Figure 7. Clustering time at 5×10⁶ user features
According to the slopes of the broken lines in Figures 6 and 7, the number of user features is positively correlated with the declining speed of clustering time and the parallelism of command executions.
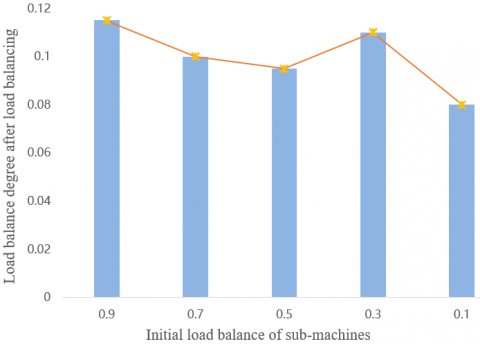
The next task is to obtain the load balancing effect at the changing number of user models. Hence, the load balance degree was calculated with the smallest unit of load balancing factors, i.e. a user model. When the number of user models is 50, 100, 150, 200, 250 and 300, the corresponding load balance degree is 0.37, 0.21, 0.16, 0.10, 0.77, and 0.43, respectively. It can be seen that more user models mean a more balanced load.
Figure 8 shows the load balance degree of system load, as the initial load balance of sub-machines increased from 0.88 to 0.14, while the number of user model was fixed at 200. It is clear that the load balance degree fluctuated about 0.12 after load balancing.
Figure 8. The load balance degree at 200 user models
This paper presents the basic framework of PMIS, and summarizes nine functional modules, including but not limited to intelligent information query module, intelligent information transmission and reception module, and intelligent bulletin module. On this basis, a USD service model was developed to screen and select specific user information on identity, historical service, location, and credit. Next, a data management strategy was designed to reasonably utilize the massive small data of PMIS. Simulation results show that the proposed data management strategy achieved good effects on clustering and load balancing, and realized desirable parallelism of command executions.
[1] Bafna, P., Pramod, D., Vaidya, A. (2016). Document clustering: TF-IDF approach. 2016 International Conference on Electrical, Electronics, and Optimization Techniques (ICEEOT), Chennai, pp. 61-66. https://doi.org/10.1109/ICEEOT.2016.7754750
[2] Sudha Ramkumar, A., Nethravathy, R. (2019. Text document clustering using k-means algorithm. International Research Journal of Engineering and Technology, 6(6): 1764-1768.
[3] Chen, X., Liu, Q., Yao, S., Wang, J., Xu, Q., Wang, Y., Liu, P., Yang, H. (2017). Hardware Trojan detection in third-party digital intellectual property cores by multilevel feature analysis. IEEE Transactions on Computer-Aided Design of Integrated Circuits and Systems, 37(7): 1370-1383. https://doi.org/10.1109/TCAD.2017.2748021
[4] Huang, D., Wang, C.D., Peng, H., Lai, J., Kwoh, C.K. (2018). Enhanced ensemble clustering via fast propagation of cluster-wise similarities. IEEE Transactions on Systems, Man, and Cybernetics: Systems. https://doi.org/10.1109/TSMC.2018.2876202
[5] Huang, D., Wang, C.D., Lai, J.H. (2017). Locally weighted ensemble clustering. IEEE Transactions on Cybernetics, 48(5): 1460-1473. https://doi.org/10.1109/TCYB.2017.2702343
[6] Brown, D., Japa, A., Shi, Y. (2019). An attempt at improving density-based clustering algorithms. ACM SE '19: 2019 ACM Southeast Conference, Kennesaw GA USA, pp. 172-175. https://doi.org/10.1145/3299815.3314452
[7] Liu, H., Wu, J., Liu, T., Tao, D., Fu, Y. (2017). Spectral ensemble clustering via weighted k-means: Theoretical and practical evidence. IEEE Transactions on Knowledge and Data Engineering, 29(5): 1129-1143. https://doi.org/10.1109/TKDE.2017.2650229
[8] Deorsola, A.B., Leal, M.C.M.R., Cavalcante, M.D., Schmidt, I.J., Braga, E.J. (2017). Intellectual property and trademark legal framework in BRICS countries: A comparative study. World Patent Information, 49: 1-9. https://doi.org/10.1016/j.wpi.2017.03.001
[9] Klein, M.A. (2018). Foreign direct investment and collective intellectual property protection in developing countries. Journal of Economic Behavior & Organization, 149: 389-412. https://doi.org/10.1016/j.jebo.2018.01.008
[10] Bao, C., Forte, D., Srivastava, A. (2015). On reverse engineering-based hardware Trojan detection. IEEE Transactions on Computer-Aided Design of Integrated Circuits and Systems, 35(1): 49-57. https://doi.org/10.1109/TCAD.2015.2488495
[11] Salmani, H. (2016). COTD: Reference-free hardware trojan detection and recovery based on controllability and observability in gate-level netlist. IEEE Transactions on Information Forensics and Security, 12(2): 338-350. https://doi.org/10.1109/TIFS.2016.2613842
[12] Akkari, N., Dimitriou, N. (2020). Mobility management solutions for 5G networks: architecture and services. Computer Networks, 169: 107082. https://doi.org/10.1016/j.comnet.2019.107082
[13] Hong, C.H., Varghese, B. (2019). Resource management in fog/edge computing: A survey on architectures, infrastructure, and algorithms. ACM Computing Surveys (CSUR), 52(5). https://doi.org/10.1145/3326066
[14] Bouet, M., Conan, V. (2018). Mobile edge computing resources optimization: A geo-clustering approach. IEEE Transactions on Network and Service Management, 15(2): 787-796. https://doi.org/10.1109/TNSM.2018.2816263
[15] Hussain, S.F., Iqbal, S. (2018). CCGA: Co-similarity based Co-clustering using genetic algorithm. Applied Soft Computing, 72: 30-42. https://doi.org/10.1016/j.asoc.2018.07.045
[16] Zhou, A., Wang, Y., Zhang, J. (2020). Objective extraction via fuzzy clustering in evolutionary many-objective optimization. Information Sciences, 509: 343-355. https://doi.org/10.1016/j.ins.2018.11.032
[17] Yang, M.S., Nataliani, Y. (2017). Robust-learning fuzzy c-means clustering algorithm with unknown number of clusters. Pattern Recognition, 71: 45-59. https://doi.org/10.1016/j.patcog.2017.05.017
[18] Wang, R., Lai, S., Wu, G., Xing, L., Wang, L., Ishibuchi, H. (2018). Multi-clustering via evolutionary multi-objective optimization. Information Sciences, 450: 128-140. https://doi.org/10.1016/j.ins.2018.03.047
[19] Zhu, S., Xu, L. (2018). Many-objective fuzzy centroids clustering algorithm for categorical data. Expert Systems with Applications, 96: 230-248. https://doi.org/10.1016/j.eswa.2017.12.013
[20] Zhang, X., Tian, Y., Cheng, R., Jin, Y. (2016). A decision variable clustering-based evolutionary algorithm for large-scale many-objective optimization. IEEE Transactions on Evolutionary Computation, 22(1): 97-112. https://doi.org/10.1109/TEVC.2016.2600642
[21] Lydia, L., Govindaswamy, P., Lakshmanaprabu, S.L., Ramya, D. (2018). Document clustering based on text mining k-means algorithm using Euclidean distance similarity. Journal of Advanced Research in Dynamical and Control Systems, 10(2): 208-214.
[22] Brown, D., Shi, Y. (2020). A distributed density-grid clustering algorithm for multi-dimensional data. 2020 10th Annual Computing and Communication Workshop and Conference (CCWC), Las Vegas, NV, USA, pp. 1-8. https://doi.org/10.1109/CCWC47524.2020.9031132
[23] Huang, D., Wang, C.D., Wu, J.S., Lai, J.H., Kwoh, C.K. (2019). Ultra-scalable spectral clustering and ensemble clustering. IEEE Transactions on Knowledge and Data Engineering, 32(6): 1212-1226. https://doi.org/10.1109/TKDE.2019.2903410