Xiuyan Bai
© 2020 IIETA. This article is published by IIETA and is licensed under the CC BY 4.0 license (http://creativecommons.org/licenses/by/4.0/).
OPEN ACCESS
This paper attempts to accurately classify e-commerce sellers based on data mining. Firstly, the original data from an e-commerce platform were preprocessed, and the classification indices were identified from five categories (products, users, traffic, sales and basic attribute). Next, the principal component analysis (PCA) and the self-organizing feature map (SOM) were fused into a hierarchical model that divides e-commerce sellers into three categories: large sellers, medium sellers and small sellers. The effectiveness of our model was verified through experiments. Finally, several operating strategies were put forward for e-commerce sellers in each category. The research results provide a good reference for the development of the e-commerce industry.
E-commerce sellers, hierarchical model, self-organizing feature map (SOM), principal component analysis (PCA), data mining
The necessity of dividing different sellers into different levels is often overlooked. In fact, the level of sellers is different [1, 2], and the free natural traffic that sellers of different levels can get is not the same. After all, the platform also chooses the best for stores. More high-quality stores are provided for consumers, and the conversion rate will also increase, forming a virtuous circle with each other. The level of online stores is inseparable from the operation of online stores. Connection [3, 4].
The seller's level is divided in a certain way and the existence of the level is clearly defined. In fact, it is to divide the online stores with different operating conditions, and then give different policies for the online stores of different levels.
This paper mainly proposes a hierarchical model for ecommerce sellers based on data mining [4]. Firstly, the data mining tools selected for modelling were introduced, namely, the self-organizing feature map (SOM) and principal. component analysis (PCA). Next, the data processing and. index selection were described in details. After that, the SOM and the PCA were fused into our hierarchical model. Finally, the effectiveness of our model was verified through. experiments [5-8].
2.1 SOM
SOM self-organizing neural network is a kind of neural network. It is based on the results of physiology and brain research. SOM includes input layer and competition layer. Kohonen believes that when the neural network receives external input [9-11], it will be divided into different areas, and different areas have different response characteristics to different modes, and can map high-dimensional space to a plane.
The input layer is the feature of the input sample, and the sample data is repeatedly input into the network for training (Figure 1).
Figure 1. SOM Network Structure
2.2 PCA
PCA (Principal Component Analysis) is a commonly used data analysis method. PCA transforms the original data into a set of linearly independent representations of each dimension through linear transformation, which can be used to extract the main feature components of the data. PCA essentially takes the direction with the largest variance as the main feature, and "discorrelates" the data in each orthogonal direction [12, 13].
PCA is a non-parameter technology, that is to say, facing the same data, it has nothing to do with the experimenter, and there is no intervention of subjective parameters. Therefore, PCA is convenient for general implementation, but it cannot be optimized by itself. In this study, "views" and "visitors" often have a strong correlation, and "orders" and "transactions" also have a strong correlation, which can be understood as "when the store’s When the number of pageviews is high (or low), it is considered that the number of visitors on that day is also high (or low)" [14, 15].
Before selecting the main indicators, we must understand the degree of influence of each auxiliary indicator on the standard indicators [16], so that indicators with similar impact degrees can be regarded as interchangeable, and then the indicators are simplified to realize the value to customers. Choice of indicators of main influence. We collect raw data from common We-media platforms, such as QQ, WeChat, Weibo and other communication tools. We use 100,000 e-commerce sellers mainly online sales as a sample to collect their customers’ browsing records, shopping cart status, and main order types Wait for user behavior to check the traffic changes, and then assign the original data to the Hadoop cluster processed and aggregated by MapReduce. Through detailed inspection of the original data, the data is preprocessed. There are five main steps, namely the lack of value. Processing, outlier processing, skew distribution correction,
Normalization and correlation analysis.
(1) Treatment of lost value
Deleting missing values is a common processing method. On the basis of Bayesian theory, the EM algorithm is then used to implement the algorithm for processing missing values. Give each missing value M missing values, so that the data set will become M, and then use the same method to process the M sample sets to get M processing results, sum these M results, and finally get Estimate of the target variable [17, 18].
(2) Outlier handling
Under the conditions of a given detection level or significance level α (usually 0.05 and 0.01) and sample size n, the critical value can be obtained by looking up the table, and then the statistic is calculated and compared with the critical value. If the statistic is greater than the critical value, the value is judged to be abnormal. The critical value table usually gives the confidence level P. For a two-sided test, P=1-α/2; for a one-sided test, P=1-α.
(3) Correction of skew distribution
When most of the data is concentrated at one end of the curve and a few data are at the other end of the curve, the shape of the data distribution is skewed. When the direction of the skewed side toward a negative number is called negative skewness,
Sellers attract the most traffic and sales platforms on e-commerce, that is, the winner bears everything. In order to solve this problem, the R language psychological software package is used to obtain the descriptive value of each index to which the distribution is skewed to the left. Then, from the R language car packaging to reduce the skewed distribution.
(4) Normalization
For convenience, each number is normalized to a decimal between zero and one, and the dimensional expression is dimensionless. Normalization does not change the size of the data set.
(5) Correlation analysis
Correlation analysis refers to the analysis of two or more correlated variable elements, so as to measure the closeness of the two variable factors. Correlation elements need to have a certain connection or probability before correlation analysis can be performed. Correlation is not equal to causality, not is simple individualization. The coefficient between the indexes in the correlation calculation data set is through the Cor function of the R language. Then, the correlation uses ggcorrplot to show the visualization tool between the indexes [19, 20].
Table 1. The indices in the category of products
|
Category |
Amount of goods |
R (closeness/d) |
F (frequency) |
M (value/yuan) |
|
Product 1 |
10 |
0.0941 |
0.7233 |
0.2240 |
|
Product 2 |
56 |
0.0929 |
0.2923 |
0.0226 |
|
Product 3 |
40 |
0.1971 |
0.6479 |
0.0909 |
|
Product 4 |
40 |
0.3929 |
0.2342 |
0.1372 |
|
Product 5 |
65 |
0.1537 |
0.2870 |
0.0972 |
|
Product 6 |
51 |
0.4518 |
0.0782 |
0.1414 |
|
Product 7 |
32 |
0.1176 |
0.4718 |
0.0191 |
|
Product 8 |
61 |
0.8294 |
0.0176 |
0.5511 |
|
Total average |
0.3077 |
0.3177 |
0.1533 |
|
As shown in Table 1, the four indexes in the following categories, the product has a sum: Amount of goods R (closeness/d) F (frequency) M (value/yuan).
As shown in Table 2, the indices in the category of users all focus on users, and the users follow two kinds of items: product and store.
Table 2. The indices in the category of users
|
Category |
Number of users |
R (closeness/d) |
F (frequency) |
M (value/yuan) |
|
User1 |
50 |
0.04811 |
0.7233 |
0.3240 |
|
User2 |
92 |
0.0628 |
0.2923 |
0.0126 |
|
User3 |
52 |
0.2971 |
0.6479 |
0.0706 |
|
User4 |
40 |
0.3827 |
0.2342 |
0.1462 |
|
User5 |
75 |
0.1437 |
0.2870 |
0.0872 |
|
User6 |
21 |
0.4216 |
0.0782 |
0.1616 |
|
User7 |
33 |
0.3175 |
0.4718 |
0.0181 |
|
User8 |
80 |
0.4926 |
0.4449 |
0.2691 |
|
Total average |
0.2067 |
0.2857 |
0.1623 |
|
As shown in Table 3, the SPV is the sum of the PVs on any page of the store, including but not limited to the front page, the product details page, the query page and the promotion page; similarly, the SUV is the sum of the UVs on any page of the store.
As shown in Table 4, the indices in the category of sales all focus on user purchases. There are three payment methods for e-commerce users: online payment, payment upon delivery and bank transfer.
As shown in Table 5, a store with large SOY tends to gain rich sales experience. The greater the SOY, the more likely it is for the seller to become a large seller. Therefore, the SOY is an important reference for the classification of e-commerce sellers.
Table 3. The indices in the category of traffic
|
Category |
Traffic quantity |
R (closeness/d) |
F (frequency) |
M (value/yuan) |
|
Traffic1 |
22 |
0.0582 |
0.6123 |
0.3140 |
|
Traffic2 |
65 |
0.0228 |
0.2723 |
0.0226 |
|
Traffic3 |
34 |
0.2891 |
0.6670 |
0.0617 |
|
Traffic4 |
60 |
0.3827 |
0.2341 |
0.1562 |
|
Traffic5 |
57 |
0.1437 |
0.2979 |
0.0972 |
|
Traffic6 |
11 |
0.2589 |
0.0776 |
0.1726 |
|
Traffic7 |
67 |
0.3175 |
0.4718 |
0.0191 |
|
Traffic8 |
61 |
0.2284 |
0.0176 |
0.6721 |
|
Traffic9 |
80 |
0.4926 |
0.4449 |
0.2691 |
|
Traffic10 |
79 |
0.1698 |
0.4014 |
0.0001 |
|
Total average |
0.1057 |
0.2757 |
0.1268 |
|
Table 4. The indices in the category of sales
|
Category |
Sales |
R (closeness/d) |
F (frequency) |
M (value/yuan) |
|
sale1 |
50 |
0.04811 |
0.7233 |
0.3240 |
|
sale2 |
92 |
0.0628 |
0.2923 |
0.0126 |
|
sale3 |
52 |
0.2971 |
0.6479 |
0.0706 |
|
sale4 |
40 |
0.3827 |
0.2342 |
0.1462 |
|
sale5 |
75 |
0.1437 |
0.2870 |
0.0872 |
|
Total average |
0.2067 |
0.2857 |
0.1623 |
|
Table 5. The index in the category of basic attribute
|
Category |
Symbol |
Meaning |
|
Basic attribute |
SOY |
The number of years since the opening of the online store |
4.1 The PCA phase
Collecting multiple samples, each sample is multi-dimensional, and they can naturally be expressed in a multi-dimensional coordinate system. Now our first step is to transform the dimension, which is actually to form a new coordinate system straight line through rotation (the dimension has not been reduced yet). Each sample data is projected on these straight lines, and the projection length is the value of each dimension of the sample in the new coordinate system. Sort by calculating the variance value of the projection on each straight line. The large variance value indicates that this new dimension has strong distinguishing ability, and we should keep it; otherwise, we should remove it (dimension reduction to eliminate redundancy). PCA is the most popular unsupervised algorithm for feature dimensionality reduction. Through PCA, the relevant high-dimensional index is linearly mapped to the low-dimensional space. The resulting low-dimensional index is called the principal component, and the key to complete PCA is the covariance matrix [21, 22]. The covariance matrix measures the relationship between dimensions and dimensions, but not between samples and samples. The covariance matrix measures the relationship between dimensions and dimensions, not between samples and samples. After the diagonalization of the matrix, the non-diagonal elements are all 0, which achieves the purpose of noise removal.
4.2 SOM stage
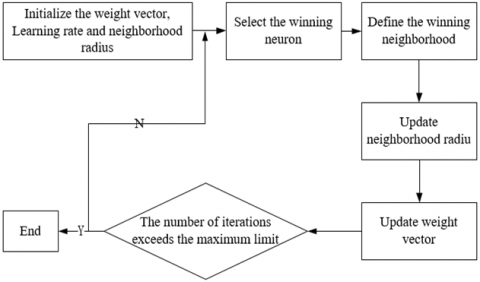
Initialization: The weight is initialized with a small random value, and the input vector and weight are normalized.
Input the sample into the network: the sample and the weight vector are inner product, the output neuron with the largest inner product value wins the competition and is recorded as the winning neuron.
SOM is a process of initializing with a small random value, and training is carried out through the following steps: by configuring the number of neurons in the output layer to input into the model, and making the weight neurons of each output layer initialized to a small random number.
Then, for each input mode, the neuron calculates their respective discriminant function value to provide a basis for competition. The specific neuron with the smallest discriminant function value is declared the winner.
The winning neuron determines the spatial position of the topological neighborhood of the excited neuron, thereby providing a basis for the cooperation between adjacent neurons.
Third, some samples are passed through the sampling module and used as training samples. Sampling is necessary because it is difficult to train the model with everyone to preprocess the 147,008 items in the data set. Distance calculation is essential for model training. Therefore, Euclidean distance and cosine distance are compared to find out which training is more suitable for our model.
Finally, update the learning rate η and the topological neighborhood, and re-normalize the learned weights to determine whether they converge. If the center change is small or reaches the preset number of iterations, the algorithm ends. (Figure 2).
Figure 2. Workflow of the SOM
4.3 Workflow of PCA-SOM model
The PCA-SOM model can be executed in five steps.
Step 1. Data initialization process
Select the seller or store, filter out the ID and save the characteristic data. Use the pandas Python library to read the data, and convert the obtained DataFrame into a NumPy array data type as the basis for subsequent calculations.
Set the structure output layer neuron as a 2×2 put l array, which contains multiple dimensional neurons. At the same time, the data of the matrix is initialized in a random manner, plus two parameters, the size of the sampling batch and the number of iterations. Define these parameters as passable into the encoding process.
$x_{i}=x_{i} / \sqrt{x_{1}^{2}+x_{2}^{2}+\ldots+x_{n}^{2}}\left(x_{1}, x_{2}, \cdots, x_{n}\right)$ (1)
Step 2. Competitive learning
Before each round of competitive learning, the error of the output matrix of the normalized sampled data set and weight: the data standardization process. Calculate the distance between each sample and the sample, and the weight of the four output layer neurons. After normalization, replace the distance calculation with the dot product of weights, that is, the product between the two Matrix, and then select the winning neuron for each sample.
$W_{j}(n+1)=W_{j}(n)+\eta_{i(x) j}(n)\left(X(n)-W_{j}(n)\right)$ (2)
Step 3. Weights and neighborhood radius and learning rate update
According to the winning neuron and neighborhood radius, determine the weight to be updated, and then preset the learning rate: update the neighborhood radius and learning rate after the weight, so that the model can adapt to the latest environment. The neighborhood radius can be updated by: where a is the short-side distance of the output layer; t is the current number of iterations; iter is the maximum number of iterations. Obviously, the negative neighborhood radius is related to the number of iterations. The learning rate can be updated in the following way: where n is the current neighborhood radius; t is the current iteration number. It can be concluded that the learning rate is also negatively related to the number of iterations.
$N=a-\frac{a^{*} t}{i t e r}$ (3)
Step 4. Check termination conditions
If the current number of iterations is greater than the maximum number of iterations, stop training and save the latest weight.
eta $=\frac{e^{-n}}{t+2}$ (4)
Step 5. Sample prediction and visualization
Based on the updated weight, calculate the level (category) of each seller and save the predicted data set. At the same time, PyLab is used to visualize the predicted data set so that each category is displayed in a unique color.
As the amount of buyer interest information given in advance in the test set increases, the overall prediction quality of the algorithm becomes more and more accurate. The buyer collection prediction uses the PCA dimensionality reduction and SOM neural network clustering algorithm to achieve the most effective results. Well, it can be seen that for extremely sparse matrices, the SOM algorithm is more suitable for clustering in the transformed low-dimensional space. In addition, compared with the collaborative filtering algorithm based on user clustering, the traditional nearest neighbor algorithm still has better prediction accuracy.
The hybrid collaborative filtering model of principal component analysis dimensionality reduction and SOM neural network clustering [21, 22]. The main idea is to first use PCA to perform dimensionality reduction, transform the original high-latitude vector to a relatively low-dimensional principal component space, extract main features, Clustering is performed on the principal component space to find the filtering algorithm of the nearest neighbor of the current user. The new algorithm tries to reduce the items in the original matrix at the same time from the perspective of the user, narrowing the search range of nearest neighbors and making the feature information more concentrated. A good recommendation effect was obtained in the test on real web log data.
5.1 Parameter settings
After multiple adjustments, the two sets of parameters are selected for training models: parameter set A: maximum number of iterations iter=6; sampling number batch size=15,000; parameter set B: maximum number of iterations iter=8; sampling batch size batchsize=15,000. After training, the final data set under each parameter set is saved to analyze the hierarchy of e-commerce sellers. Since each seller’s data contains 10 components, the correlation components between each subject and each category are clusters obtained in the following way. Record the results under each parameter set as the correlation matrix (Tables 6 and 7). The correlation matrix represents the distribution of eigenvalues for each category across 14 main components [23, 24].
Table 6. Correlations between 14 principal components and four categories in Parameter Set A
|
Label |
Dim1 |
Dim2 |
Dim3 |
Dim4 |
Dim5 |
Dim6 |
Dim7 |
|
0 |
0.172349 |
0.114758 |
0.298908 |
0.407291 |
0.045921 |
0.256224 |
0.162507 |
|
1 |
0.297354 |
0.198265 |
0.225794 |
0.187654 |
0.561998 |
0.033675 |
0.125734 |
|
2 |
0.742916 |
0.140505 |
0.096507 |
0.073980 |
0.039879 |
0.052256 |
0.054002 |
|
3 |
0.123896 |
0.810897 |
0.105629 |
0.097597 |
0.158319 |
0.063982 |
0.087786 |
|
Label |
Dim8 |
Dim9 |
Dim10 |
Dim11 |
Dim12 |
Dim13 |
Dim14 |
|
0 |
0.154897 |
0.060227 |
0.178169 |
0.075634 |
0.038333 |
0.053197 |
0.079902 |
|
1 |
0.263295 |
0.073966 |
0.084525 |
0.098509 |
0.066804 |
0.063167 |
0.066163 |
|
2 |
0.066125 |
0.056728 |
0.050982 |
0.134739 |
0.021028 |
0.013663 |
0.039701 |
|
3 |
0.070599 |
0.023506 |
0.070223 |
0.026928 |
0.019668 |
0.024165 |
0.021214 |
Table 7. Correlations between 14 principal components and four categories in Parameter Set B
|
Label |
Dim1 |
Dim2 |
Dim3 |
Dim4 |
Dim5 |
Dim6 |
Dim7 |
|
0 |
0.044567 |
0.23301 |
0.357698 |
0.229684 |
0.096769 |
0.246859 |
0.10462 |
|
1 |
0.365309 |
0.534192 |
0.133652 |
0.216041 |
0.234604 |
0.067243 |
0.136952 |
|
2 |
0.77675 |
0.451596 |
0.054669 |
0.056762 |
0.061553 |
0.059357 |
0.097539 |
|
3 |
0.256716 |
0.372063 |
0.092644 |
0.078854 |
0.233229 |
0.02119 |
0.05208 |
|
Label |
Dim8 |
Dim9 |
Dim10 |
Dim11 |
Dim12 |
Dim13 |
Dim14 |
|
0 |
0.318106 |
0.059793 |
0.80585 |
0.046309 |
0.087211 |
0.060739 |
0.216072 |
|
1 |
0.169773 |
0.092265 |
0.156536 |
0.079718 |
0.079902 |
0.056903 |
0.818257 |
|
2 |
0.06819 |
0.0491167 |
0.041268 |
0.076215 |
0.033536 |
0.015253 |
0.021692 |
|
3 |
0.069985 |
0.024796 |
0.067505 |
0.029749 |
0.091071 |
0.013642 |
0.056228 |
5.2 Results analysis
After many experiments, the experimental data is analyzed and the analysis results are obtained. The following results can be obtained from the two tables of Table 6 and Table 7. It can be concluded that the first 6 main components explain more than 67% of the variance in the entire data set. Among them, the principal component Dim1 explained 29% of the variance in the data set; the larger the variance, the more important and meaningful the structure is. The flow, product and sales category are positively correlated with the absolute value index.
Second, the principal component Dim2 explains the variance in 8% of the data set. This component has important meanings for products and traffic categories that are positively correlated with the ratio index (conversion ratio), as well as products that are significantly negatively correlated with the sell index, displayed products, and visited products. The principal component 3 (Dim3) has a significant positive correlation with BR and ADV [25, 26]. It can be abstracted as the decoration quality and attractiveness of the store.
Finally, the principal component Dim4 is positively correlated with BR, ADV, and multiple ratio indicators (conversion rates).
The correlation between the principal component Dim5 and the index is relatively weak. The only exception is strong Related to SOYN, index of several related ratios (conversion ratio).
5.3 Discussion
Seller stratification can help businesses locate core customer markets with advantages and lead companies to concentrate limited resources to create maximum performance. From the identification of customers, to the reasonable allocation of customer resources, to the personalized services and professional marketing countermeasures provided by the company to customers are all very important.
First, effectively identify the customer aspect. Seller stratification is critical to the effectiveness and appropriateness of the services that companies can provide, and the quality of service that customers are satisfied with can greatly enhance the image of sellers [25].
Second, reasonable planning of resources. Only through effective seller stratification, distinguish the needs of different types of customers, put the right resources on the right customers, so as to obtain the most reasonable investment and return ratio from the customers.
Third, the need for personalized service. The difference of customers requires that companies can accurately understand customer's personalized service needs, and provide and manage service processes based on the understanding of differentiated needs [26].
Fourth, specialize in sales strategies. Sensitively capture customers' perceptions of information, choose more appropriate ways to transmit information, enhance the delivery effect, and stimulate customer needs with more targeted programs.
Fifth, consolidate the core customer market. The correct core customer market positioning and customer selection strategy are critical to the company's sustainable profitability and value growth. Seller stratification can help companies accurately locate target customer markets with strategic advantages, and concentrate resources and core customer markets, thereby continuously consolidating their competitive advantages in core customer markets.
5.4 Countermeasures
Large sellers are more focused on products, and the theme of the store is clear, and the product line has a certain depth. The page level, color tone, and brand tonality are significantly higher than that of medium-sized sellers and small sellers. The page looks good only on the surface, and the focus is on the sophisticated details that give buyers strong confidence.
In terms of the importance of the homepage, large sellers pay more attention to the homepage rather than the details page than the small and medium-sized sellers, and the homepage is the most important basis for buyers to judge the seller's level. Large sellers generally have a relatively long and complete homepage design, and try to have an overall understanding of products and related products through one page. Of course, the details pages of larger sellers are also richer. The goal is the shortest reading time, convey more selling points, make more comparisons and explanations, and highlight their professionalism and delicacy.
The main push structure of medium and large buyers is very clear, the themes and products are very clear, and appropriate guidance is given. Other single products and purchase decisions are all left to the consumers to decide on their own. This happens to be what small sellers lack.
This paper proposes a new e-commerce seller layering model based on PCA and SOM, and uses the analytic hierarchy process. This model can classify 100,000 sellers on the e-commerce platform and design business strategies for each category of sellers. The research results provide a good operational reference for e-commerce sellers.
[1] Zhang, J., Zhang, C., Yu, H. (2018). Research on e-commerce intelligent service based on data mining. In MATEC Web of Conferences, 173: 03012. https://doi.org/10.1051/matecconf/201817303012
[2] Najafi, I. (2019). Assessment and modeling of decision-making process for e-commerce trust based on machine learning algorithms. Fundamental Research in Electrical Engineering, 969-986. https://doi.org/10.1007/978-981-10-8672-4_74
[3] Ju, C., Wang, J., Zhou, G. (2019). The commodity recommendation method for online shopping based on data mining. Multimedia Tools and Applications, 78(21): 30097-30110. https://doi.org/10.1007/s11042-018-6980-7
[4] Shah, T.H., Naveed, N., Rauf, Z. (2018). A methodology for brand name hierarchical clustering based on social media data. Journal of Applied and Emerging Sciences, 8(1): 10-23. http://dx.doi.org/10.36785/jaes.v8i1.238
[5] Alsenan, S., Zemirli, N. (2016). PERSO-retailer: Modeling the retailer's business data: Toward recommender system of retailers' marketing plan for personalized CMS. 2016 International Conference on Computing, Communication and Automation (ICCCA), Noida, pp. 106-111. http://dx.doi.org/10.1109/CCAA.2016.7813699
[6] Mu, M., Liu, C. (2018). Research on the construction of o2o e-commerce and express industry collaborative development model in big data environment. In Proceedings of the 2018 International Conference on Internet and e-Business, 29-33. https://doi.org/10.1145/3230348.3230424
[7] Castro-Lopez, A., Alonso, J.M. (2019). Modeling human perceptions in e-commerce applications: A case study on business-to-consumers websites in the textile and fashion sector. Applying Fuzzy Logic for the Digital Economy and Society, 115-134. https://doi.org/10.1007/978-3-030-03368-2_6
[8] Zaim, H., Ramdani, M., Haddi, A. (2018). A model of e-commerce self-assessment system based on e-customer behavior. Smart Application and Data Analysis for Smart Cities (SADASC'18). http://dx.doi.org/10.2139/ssrn.3179244
[9] Sulova, S. (2018). Integration of structured and unstructured data in the analysis of e-commerce customers. International Multidisciplinary Scientific GeoConference: SGEM: Surveying Geology & Mining Ecology Management, 18: 499-505. http://dx.doi.org/10.5593/sgem2018/2.1/S07.063
[10] Hsieh, P.H. (2019). A study of models for forecasting e-commerce sales during a price war in the medical product industry. International Conference on Human-Computer Interaction, 3-21. https://doi.org/10.1007/978-3-030-22335-9_1
[11] García, M.D.M.R., García-Nieto, J., Aldana-Montes, J.F. (2016). An ontology-based data integration approach for web analytics in e-commerce. Expert Systems with Applications, 63: 20-34. https://doi.org/10.1016/j.eswa.2016.06.034
[12] Lee, H.C., Rim, H.C., Lee, D.G. (2019). Learning to rank products based on online product reviews using a hierarchical deep neural network. Electronic Commerce Research and Applications, 36: 100874. https://doi.org/10.1016/j.elerap.2019.100874
[13] Goswami, A., Mohapatra, P., Zhai, C. (2019). Quantifying and visualizing the demand and supply gap from e-commerce search data using topic models. In Companion Proceedings of the 2019 World Wide Web Conference, 348-353. https://doi.org/10.1145/3308560.3316605
[14] Huang, H.J., Yang, J., Zheng, B. (2019). Demand effects of product similarity network in e-commerce platform. Electronic Commerce Research, 1-31. https://doi.org/10.1007/s10660-019-09352-9
[15] Yoo, B., Jang, M. (2019). A bibliographic survey of business models, service relationships, and technology in electronic commerce. Electronic Commerce Research and Applications, 33: 100818. https://doi.org/10.1016/j.elerap.2018.11.005
[16] Hamidi, H., Moradi, S. (2017). Analysis of consideration of security parameters by vendors on trust and customer satisfaction in e-commerce. Journal of Global Information Management (JGIM), 25(4): 32-45. https://doi.org/10.4018/JGIM.2017100103
[17] Wakil, K., Alyari, F., Ghasvari, M., Lesani, Z., Rajabion, L. (2019). A new model for assessing the role of customer behavior history, product classification, and prices on the success of the recommender systems in e-commerce. Kybernetes. https://doi.org/10.1108/K-03-2019-0199
[18] Zhao, J., Wang, L., Li, D.A., Li, Y., Yang, B., Zhu, B., Bai, R. (2018). Mining shopping data with passive tags via velocity analysis. EURASIP Journal on Wireless Communications and Networking, 2018(1): 1-13. https://doi.org/10.1186/s13638-018-1033-5
[19] Sohaib, O., Naderpour, M., Hussain, W., Martinez, L. (2019). Cloud computing model selection for e-commerce enterprises using a new 2-tuple fuzzy linguistic decision-making method. Computers & Industrial Engineering, 132: 47-58. https://doi.org/10.1016/j.cie.2019.04.020
[20] Liu, S. (2016). The innovation study of e-business mode based on big database environment. In 2016 2nd International Conference on Education Technology, Management and Humanities Science, 416-419. https://doi.org/10.2991/etmhs-16.2016.92
[21] Behl, A., Dutta, P., Lessmann, S., Dwivedi, Y.K., Kar, S. (2019). A conceptual framework for the adoption of big data analytics by e-commerce startups: a case-based approach. Information Systems and e-Business Management, 17(2): 285-318. https://doi.org/10.1007/s10257-019-00452-5
[22] Leng, K., Jing, L., Lin, I.C., Chang, S.H., Lam, A. (2019). Research on mining collaborative behaviour patterns of dynamic supply chain network from the perspective of big data. Neural Computing and Applications, 31(1): 113-121. https://doi.org/10.1007/s00521-018-3666-z
[23] Jiang, H., Sabharwal, A., Henderson, A., Hu, D., Hong, L. (2019). Understanding the role of style in e-commerce shopping. In Proceedings of the 25th ACM SIGKDD International Conference on Knowledge Discovery & Data Mining, 3112-3120. https://doi.org/10.1145/3292500.3330760
[24] Kaushik, V., Khare, A., Boardman, R., Cano, M.B. (2020). Why do online retailers succeed? The identification and prioritization of success factors for Indian fashion retailers. Electronic Commerce Research and Applications, 39: 100906. https://doi.org/10.1016/j.elerap.2019.100906
[25] Leung, W., Shi, S., Chow, W. (2019), Impacts of user interactions on trust development in C2C social commerce: The central role of reciprocity. Internet Research. https://doi.org/10.1108/INTR-09-2018-0413
[26] Sharma, H., Aggarwal, A. (2019), Finding determinants of e-commerce success: a PLS-SEM approach. Journal of Advances in Management Research, 16(4): 453-471. https://doi.org/10.1108/JAMR-08-2018-0074