Soukaina Bouhsissin*![]() | Nawal Sael
| Nawal Sael![]() | Faouzia Benabbou
| Faouzia Benabbou![]()
© 2023 IIETA. This article is published by IIETA and is licensed under the CC BY 4.0 license (http://creativecommons.org/licenses/by/4.0/).
OPEN ACCESS
Global road transport safety concerns are escalating, evidenced by an annual increase in traffic-related accidents, fatalities, and injuries. In response, numerous governmental road safety initiatives aim to mitigate crash incidences and consequent harm. Extant literature documents myriad datasets collated to address road safety challenges and bolster intelligent transport systems (ITS). These datasets are amassed via diverse measurement modalities, including cameras, radar sensors, and unmanned aerial vehicles (UAVs), commonly known as drones. This study delineates ITS datasets pertinent to transport issue resolution and elucidates the measurement methodologies employed in dataset accrual for ITS. A dual comparative analysis forms the core of this research: the first examination juxtaposes data source methodologies for dataset collection, while the second compares disparate datasets. Both examinations are conducted using the Weighted Scoring Model (WSM). Criteria germane to the comparison are meticulously defined, and respective weights are assigned, mirroring their significance. Findings reveal the UAV-based method as superior in amassing datasets pertinent to drivers and vehicles. Among the datasets evaluated, the SinD dataset secures the preeminent position. This methodical approach facilitates astute decisions regarding data source and dataset selection, augmenting the comprehension of their efficacy and relevance within the ITS domain.
intelligent transport systems, road safety, Weighted Scoring Model, drone, onboard sensors, simulator, infrastructure sensors
Intelligent Transportation Systems (ITS) integrate advanced technologies and communication systems into the transportation infrastructure and vehicular fabric, aiming to bolster safety, mobility, and efficiency. ITS applications are engineered to enhance transportation performance by mitigating crash occurrences [1, 2], augmenting roadway visibility [3], alleviating congestion [4], reducing accident severity [5, 6], and optimizing fuel efficiency. These systems encompass intelligent solutions applied across all vehicular operation phases to realize the vision of safer and more efficient roadways.
Presently, ITS implementations are prevalent within urban centers and along highways, undergirded by an array of monitoring devices, including cameras, unmanned aerial vehicles (UAVs), light detection sensors (LIDAR), radar, and ultrasonic sensors. It is through these devices that critical data on driver behavior—encompassing acceleration, braking, lane changing, and speed—are harvested under both normal and adverse conditions.
At the core of ITS lies an extensive reliance on datasets, amassed through varied data collection methodologies, to catalyze a transformative shift in transportation paradigms. The potency of data is harnessed to elevate the operational efficiency, safety, and environmental sustainability of transportation networks.
Datasets constitute the foundational element of ITS, encapsulating crucial information on traffic flow, road conditions, user behavior, and environmental variables. By analyzing these datasets, ITS are empowered to decode the intricacies of transportation systems, thereby enabling informed decision-making and the deployment of intelligent responses.
Data acquisition techniques in Intelligent Transportation Systems (ITS) are crucial for the procurement of pertinent data, utilizing an array of methodologies including sensor technologies, imaging devices, and aerial surveying by drones. Ground-based sensors, strategically deployed along transportation arteries, are responsible for the real-time capture of traffic metrics such as volume, velocity, and congestion levels. Additional insights into roadway conditions and traffic dynamics are procured via vehicular and infrastructural cameras and sensors. Unmanned Aerial Vehicles (UAVs), or drones, offer a vantage point for aerial surveillance, further enriching the data landscape.
The synthesis of multifaceted datasets with advanced collection mechanisms forms the backbone of ITS, synergistically enhancing the intelligence and efficacy of modern transportation systems. These integrated datasets and collection sources are pivotal in steering transportation towards a more intelligent, efficient, and sustainable future.
Central to the discourse of this paper are several inquiries: Which methodologies are employed for the gathering of data to compile ITS datasets? Which datasets are considered preeminent within the ITS field? And crucially, how can these disparate methodologies and datasets be effectively compared?
To address these inquiries, the present study adopts the Weighted Scoring Model (WSM) to conduct two distinct comparative analyses. Initially, the comparison of data source methods—including drones, sensor-equipped vehicles, simulators, and infrastructure-based sensors—is undertaken. Subsequently, the focus shifts to the evaluation of datasets currently utilized in ITS research. Criteria for comparison are meticulously delineated, encompassing scenario depiction, naturalistic behavior capture, efficiency, flexibility, duration of monitoring, and error frequency for data collection methods. For datasets, essential parameters such as mapping detail, temporal resolution, feature richness, data provenance, and user typology are established. Following the establishment of these criteria, the WSM methodology is detailed and applied as delineated in Section 4. Results from the WSM analysis are subsequently presented in a spider graph format, providing a visual comparison of each data collection method and dataset against the defined criteria.
The structure of this paper is as follows: Section 2 elucidates the most significant datasets and data collection methods utilized in ITS. Section 3 presents a comparative analysis of these methods and datasets. Section 4 introduces the WSM methodology and outlines the research methodology. Sections 5 and 6 apply the WSM approach to evaluate the data collection methods and datasets respectively, using weighted attributions to compute and compare final scores. The paper concludes with a discussion of the findings and future perspectives in Section 7.
In this section, we present data sources used to collect datasets in ITS. Then we present datasets collected to solve ITS problems. Using drones as sensors for traffic monitoring, then existing datasets for onboard sensors and driving simulators.
To collect datasets, a range of innovative methods are employed. Drones equipped with cameras and sensors are deployed to capture aerial views and collect data on traffic patterns, road conditions, and infrastructure monitoring. In addition, ground-based sensors installed along roadways provide real-time information on traffic volume, speed, and vehicle classification. Driving simulators allow researchers and developers to generate simulated environments, enabling them to study driver behavior, test algorithms, and evaluate new transportation strategies.
The use of camera-equipped drones to measure every vehicle’s position and movements from an aerial perspective is a novel approach that has the potential to revolutionize the way traffic flow is monitored and managed. By having a continuous, real-time bird’s eye view of traffic, bottlenecks, and congestion can be identified and addressed more quickly and effectively. Additionally, this data can be used to study driver behavior and create alert systems in vehicles and to police systems to make the necessary decisions. Also, to optimize traffic patterns and road safety. Sensors on series-production vehicles are used to measure the vehicle´s environment and collect the data [7]. The data collected by the sensors can be used to improve the safety and efficiency of the vehicle and driver, it can be used to provide safety warnings to the driver in the form of visual, auditory, or haptic feedback. The sensors can also be used to monitor the health of the vehicle and its components. The installation of infrastructure sensors at dedicated masts or streetlights located along road segments can permanently monitor a certain road segment for signs of wear and tear. This is especially useful for detecting changes in road conditions like the flux of traffic and detecting abnormal driver behavior that could potentially lead to accidents. By constantly monitoring the condition of the road, these sensors can help to improve the safety of drivers and passengers alike. A simulator of conduits can be used to collect datasets for a variety of purposes. It can be used to collect data on the performance of a system, or to collect data for research purposes. Additionally, a simulator of conduits can be used to collect data for educational purposes or to collect data for marketing purposes.
A key component of ITS is the availability of diverse datasets that enable the system to tackle transportation challenges effectively. These datasets encompass real-time traffic information, weather conditions, road infrastructure details, vehicle data, and user behavior patterns. They provide crucial insights for addressing congestion, optimizing routes, and predicting traffic flow.
Drones equipped with high-resolution cameras can record traffic from a so-called "bird's-eye view" with high position precision. We present the most popular datasets dedicated to ITS. The Stanford Drone Dataset [8] was the first dataset with the trajectories of several road users that was created from the point of view of a drone. It is publicly available and was published in 2016. It is suitable for the analysis of the behaviors and interactions of pedestrians. It consists of nine hours of data from 8 locations on the Stanford campus. The dataset includes 10,300 pedestrian, bicycle, automobile, skateboard, cart, and bus trajectories. Only around 7% of the targets in the sample that have been tagged are cars, compared to a large ratio of identified bikes and pedestrians. The highD dataset [7], which was published in 2018, is the first extensive naturalistic vehicle trajectory dataset on German highways using drone-captured video data. The observations were conducted at six separate locations and involved 110,000 vehicles traveling 45,000 kilometers in 16.5 hours for the highD dataset. The CITR and DUT, two drone-based datasets, were published in 2019 [9]. The dataset, which lasted for less than 30 minutes, was centered on investigating pedestrian behavior when interacting with cars. The controlled experiment used to create the CITR dataset took place in a parking lot, in contrast to the DUT dataset, which comprises pedestrians' naturalistic, uninstructed trajectories. The INTERACTION dataset [10] is a dataset that was produced utilizing drones and includes the realistic motions of numerous traffic participants. Several highly interactive driving scenarios are included in the collection, which comes from China, Bulgaria, Germany, and the United States. It contains measurements from 11 locations and the recording time is up to 16.5 hours. The dataset offers HD-map data in lanelet2 format for the first time. In 2020, the inD dataset [11], which was captured at four various unsignalized junctions in Germany, was published. Over the course of 10 hours, it contains a total of 13,599 trajectories. The inD dataset divides all users of the road into four categories: cars, trucks or buses, bicyclists, and pedestrians. Another urban dataset named the rounD dataset [12] has been published in 2020; it contains over 13,746 trajectories recorded over six hours at three different locations, unsignalized roundabouts in Germany. The openDD dataset [13] is collected in Germany in 2020. openDD contains 84,774 trajectories in 62 hours and HD map data of seven different unsignalized roundabouts. At the signalized intersection in China, a drone dataset SIND [14] was collected and published in 2022. SIND includes traffic light states and HD maps, which contain 7 hours of recording including 13,248 trajectories and include 7 road user types: cars, trucks, buses, tricycles, bikes, motorcycles, and pedestrians. The trajectory dataset called as CitySim dataset [15] was published in 2023 and was taken from drone videos. CitySim has vehicle interaction trajectories extracted from 19 hours at 12 different locations. More severe and significant critical safety events are present in CitySim dataset, which offer supportive scenarios for safety-focused research. The Driving Behavior Net (DBNet) [16] is a dataset for driving behavior research. It includes aligned video, point cloud, GPS and driver behavior (speed and wheel). The dataset is collected in 2018.
The most widely used vehicle motion dataset in the behavioral research fields is the Next Generation Simulation (NGSIM) dataset [17]. Cameras positioned on buildings gathered the raw data, which was then automatically processed. NGSIM has been registered in four different locations: Peachtree Street in Atlanta, Georgia; Lankershim Boulevard, located in Los Angeles, California; eastbound I-80 in Emeryville, California; and U.S. Highway 101 in Los Angele. In the Five Roundabouts Dataset [18], which was published in 2019, over 23 000 vehicles at five unsignalized roundabouts in Australia were followed using a total of six Ibeo LIDAR scanners onboard a vehicle parked close to the roundabouts, yielding more than 60 hours of data. The Strategic Highway Research Program 2 (SHRP 2) NDS [19] database includes data from 50 million vehicle miles and 5.4 million trips, SHRP 2 was collected by 3,147 volunteers using radar, raw-video, and video of the driver at 6 different sites in the United States: central Indiana; Erie County, New York; Tampa, Florida; Durham, North Carolina; central Pennsylvania; and Seattle, Washington. The 100-Car Naturalistic Driving Study dataset [20] contains several examples of excessive driver behavior and performance, like extreme weariness, impairment, mistakes of judgment, risk-taking, aggressive driving, and traffic violations. The collection contains data from a very competent instrumentation system, including 5 channels of video, various vehicle statuses, and kinematic sensors. It also contains data from roughly 2 million vehicle miles and almost 43 thousand hours of data. The European Commission is the founder of the UDrive [21], a large naturalistic driving study in Europe. More than 1,200 drivers contributed the information on more than 35 million kilometers driven in UDrive dataset. The information includes raw video, GPS position, onboard CAN-bus records, front-facing radar, and camera images. However, the datasets UDrive and SHRP 2 are not freely available to the public. The driver behavior dataset [22] is gathered across four car excursions that last, on average, 13 minutes each, using a smartphone in 2017. The Honda Research Institute Driving Dataset (HDD) [23] was published in 2018. The dataset comprises of 104 hours of real human driving in the San Francisco Bay Area, the data was collected using a vehicle fitted with various sensors. The purpose of this dataset is to study driver behavior in real-life environments. The UAH-DriveSet [24] is a dataset that was gathered from six different drivers and cars and is used for the analysis and classification of driving behavior. Three unique driving behaviors were included in the data: normal, drowsy, and aggressive.
According to some researchers, it is challenging to directly model using equations the interactions between human drivers. In order to solve this issue, simulations like CARLA [25] developed by researchers at Intel, and AirSim [26], developed by Microsoft, are examples of such simulators that are both open-source. may more easily imitate a human driver's behavior thanks to learning-based methods for characterization of human-driver behavior. The HRI Driver Behavior Dataset (HDBD) [27] contains driver behavior collected using simulator and real scene videos from 32 participants. Each participant recorded 4 sessions, each consisting of 10 intersections that last approximately eight minutes.
In this section, we will compare the data sources and datasets discussed earlier based on several characteristics.
3.1 Data sources
Table 1 provides the outcomes of our initial analysis, examining the current state-of-the-art regarding data sources. It explores the strengths and weaknesses associated with each of these sources. To facilitate a more comprehensive comparison of these data sources, we present Table 2, which offers a detailed comparative study. In this process, we first identify and establish criteria that enable us to assess the effectiveness of a data source. Subsequently, we evaluate each data source based on these criteria, as illustrated in Table 2. The comparisons presented in Table 2 draw upon studies analyzed in the study [28] and other relevant references cited in the previous section (Section 2) of this work. The comparison criteria used to compare the data sources are:
1. Scenario description: Access to information belonging to the road (environment), such as the number of lanes, speed limits, and road curvature, must be accurately captured. Additionally, information describing road users' movements and positions must be measured accurately. Finally, information on environmental conditions needs to be recorded.
2. Naturalistic behavior: It is crucial that road users act naturally, and their behavior remains unaffected by the measurement process. For proper data collection, road users should be unaware of the research method, allowing them to continue behaving as they would under normal conditions.
3. Efficiency: Efficiency, or effort effectiveness, is calculated by determining the ratio of measured scenarios to the total effort expenditure. This encompasses both the one-time setup effort and ongoing operational requirements, resulting in the total effort expenditure.
4. Flexibility: High accessibility to capture the widest range of traffic parameters is essential. It is always crucial to measure traffic and under various conditions to ensure that all traffic variants are considered during data collection.
5. Time monitoring: Time monitoring is a technology used to continuously collect and store data on roads and vehicles.
6. Mistakes: Data from roads and vehicles must be collected with high quality and minimum errors to ensure the development of reliable algorithms for performance evaluation.
Table 1. Advantages and disadvantages of data sources
|
Method |
Advantages |
Disadvantages |
|
Drone |
Simple to maintain vehicle geometries and inter-vehicle distances. High longitudinal and lateral accuracy. There are no occlusions by road users. The traffic behavior recorded is natural. |
Daytime measurements are constrained by legal flight restrictions and environmental conditions. |
|
Vehicle with sensors |
Datasets require careful consideration of privacy and data protection concerns. |
The naturalistic behavior of road users may not always be accurately captured due to limitations in sensor capabilities and their visibility. |
|
Simulator |
Collect different types of data. Collect data that cannot be collected in the real world. |
The datasets are not naturalistic. |
|
Infrastructure sensors |
The data collected can provide a comprehensive overview of traffic patterns in the observed area. |
Accurately capturing the naturalistic behavior of road users is not always guaranteed. High initial effort for installation. Most of the data are not available to the public. |
Table 2. Comparative study for data sources
|
Criteria |
Detailed Criteria |
Drone |
Vehicle with Sensors |
Simulator |
Infrastructure Sensors |
|
Scenario description |
·Object detection |
Yes |
Yes |
Yes |
Yes |
|
·Scene flow |
Yes |
No |
Yes |
Yes |
|
|
·3D visual odometry |
Yes |
No |
Yes |
No |
|
|
·Road user types |
Yes |
Yes |
Yes |
Yes |
|
|
·HD maps with semantics |
Yes |
No |
No |
No |
|
|
·Traffic light states |
Yes |
Yes |
Yes |
Yes |
|
|
·User movements |
Yes |
Yes |
No |
Yes |
|
|
Naturalistic behavior |
·No occlusions by road users |
Yes |
Yes (partly) |
Yes |
Yes |
|
·Behavior recorded is natural |
Yes |
Yes |
No |
Yes |
|
|
Efficiency |
·Ease of installation |
Yes |
Yes |
No |
No |
|
·Difficulty in installation |
No |
No |
No |
Yes |
|
|
·Easy to use |
No |
Yes |
Yes |
No |
|
|
·Use a person to control |
Yes |
Yes |
Yes |
No |
|
|
Flexibility |
·Weather patterns |
No |
Yes |
Yes |
Yes |
|
·Different types of sensors |
No |
Yes |
No |
No |
|
|
·Low cost |
No |
Yes |
No |
No |
|
|
·Expensive |
Yes |
No |
Yes |
Yes |
|
|
·Lightweight |
Yes |
Yes |
No |
No |
|
|
·Need specific settings |
Yes |
No |
Yes |
Yes |
|
|
·Difficult to change |
No |
No |
No |
Yes |
|
|
Time of monitoring |
·Specific time |
Yes |
Yes |
Yes |
No |
|
·Any time |
No |
No |
No |
Yes |
|
|
Mistakes |
·Errors due to weather conditions |
Yes |
No |
No |
No |
|
·Errors due to noise |
No |
Yes |
No |
No |
|
|
·Errors of hardware collection of data |
Yes |
Yes |
No |
Yes |
|
|
·Errors due to the difference between the simulator environment and the real |
No |
No |
Yes |
No |
Figure 1. Data sources comparison
Based on Figure 1 and Table 2, several key observations emerge. In dynamic scenarios, the highest precision is attained through aerial perspectives and simulators, while static scenarios benefit most from digital maps or drone data. Infrastructure sensors offer accurate scene information. Drones provide an effective way to capture naturalistic behavior with minimal disruption to road users since they remain largely invisible to them. This method allows researchers to acquire the most accurate data sources for studying targeted behaviors. For efficiency, vehicle sensors can often be implemented with little effort and minimal modifications, providing essential data to enhance vehicle operation accuracy. Operating a drone necessitates approval and the employment of an experienced pilot. Infrastructure sensors demand a high initial setup effort; however, their operation is notably efficient. The flexibility of measurement vehicles is a significant advantage, as they can navigate nearly any terrain and endure various conditions. Infrastructure sensors require installation approval before use; nevertheless, they function reliably under diverse environmental conditions. Drones have the potential to adapt to different survey locations, but their adaptability is constrained by flight restrictions and weather patterns. Simulators, on the other hand, are the least flexible, designed with carefully defined conditions and parameters. At the monitoring level, most data sources can acquire substantial amounts of data, especially when integrated with the latest technology that facilitates data recording and retention. Lastly, error sources related to data collection can be categorized into two areas: collector error and material quality. Preprocessing, particularly in relation to sensors, is another possible source of errors. Overall, it is essential to consider these factors when gathering data.
3.2. Datasets
Diverse collection methods have been utilized to generate a wide array of datasets in the field of Intelligent Transport Systems (ITS). Furthermore, in this section, we will conduct a comparative analysis of these datasets.
Table 3 presents the comparison between the datasets and the criteria used for comparison. The criteria are as follows:
1. Dataset: Name of dataset.
2. Map: The underlying HD map of locations.
3. Hours: Number of hours taken to collect data.
4. Features: Number of features available in the dataset.
5. Data source: The method used to collect the data.
6. Road user type: The type of road users collected in the dataset.
7. Data types: The type of data used to achieve dataset objectives
8. Pre-processing: Steps taken to prepare and clean the dataset before it can be used for analysis or modeling.
9. Detection: The algorithms used to detect objects in the dataset.
10. Tracking: The algorithms used to track objects in the dataset.
11. Post-processing: post-processing tools that play a vital role in exploring dataset and refining acquired knowledge.
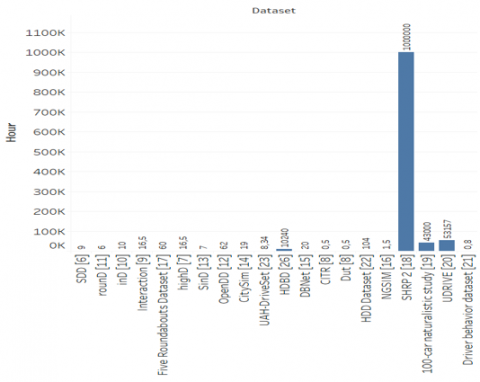
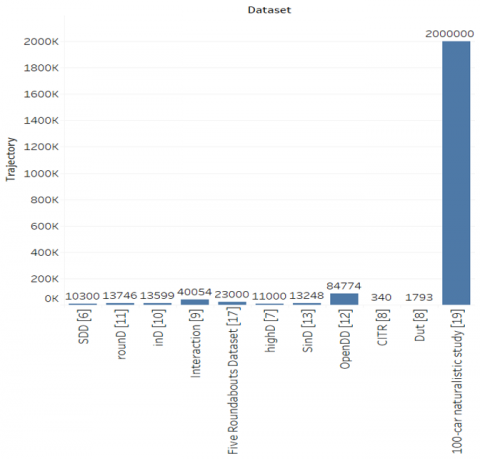
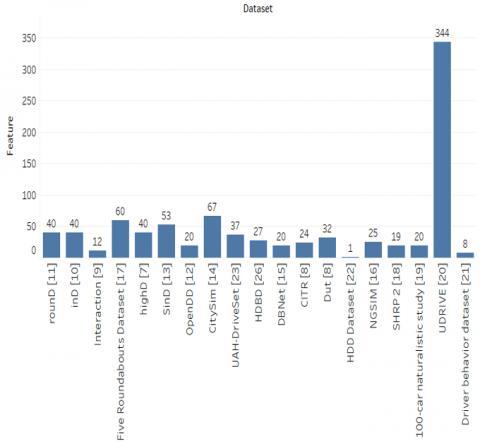
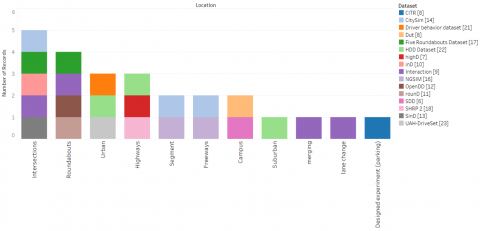
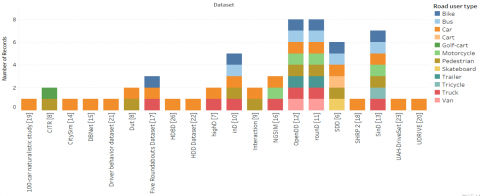
Based on the information provided from Table 3 and Figures 2, 3, 4, 5, and 6, the following observations can be made: Intersections are the most chosen locations as a field of study, followed by roundabouts. This indicates that researchers and practitioners often focus on studying the behavior and interactions of road users at these complex traffic junctions. The "rounD" and "OpenDD" datasets are notable for capturing more than eight types of road users, including Car, van, truck, bus, trailer, pedestrian, bicycle, and motorcycle. These datasets provide a comprehensive representation of various road user types, enabling a more holistic analysis of traffic scenarios. The "SinD," "OpenDD," "CitySim," "inD," and "interaction" datasets are among the datasets that comprise road maps. Having access to road maps enhances the context and accuracy of the collected data, facilitating better understanding and analysis of traffic behavior. The "Strategic Highway Research Program" dataset stands out as the largest dataset in terms of hours of collected data, with a massive 1 million hours. This extensive dataset offers a significant amount of information for in-depth research and analysis of long-term transportation trends and patterns. Datasets collected from drones, such as the "OpenDD" dataset, provide 62 hours of data collection. Drone-based data collection can offer unique perspectives and valuable insights into traffic behavior without disturbing road users. Regarding dataset functionalities, "UDRIVE" and "CitySim" are examples of datasets with a large number of functionalities, containing 344 and 67 functionalities, respectively. These datasets likely cover a wide range of features and measurements, providing comprehensive data for various analyses and applications.
Overall, the information from Table 3 and the accompanying figures offers a valuable overview of the different datasets available in the field of Intelligent Transport Systems. Researchers can use this information to select appropriate datasets based on their specific research goals and requirements, leading to more effective studies and advancements in intelligent transportation technologies. The most common problems treated in these datasets are :
Other issues related to transportation and traffic management may also be addressed using these datasets.
Figure 2. Distribution of hours of datasets
Figure 3. Distribution of number of trajectory of datasets
Figure 4. Distribution of number of features of dataset
Figure 5. Datasets location distribution
Figure 6. Distribution of road user types of datasets
Table 3. Comparative study for datasets
|
Dataset |
Location |
Map |
Hour |
Trajectory |
Feature |
Data Source |
Road User Type |
Data Types |
Pre-processing |
Detection |
Tracking |
Post-processing |
|
SDD [8] |
Campus |
No |
9 |
10300 |
n/a |
Drone |
Pedestrian, bicycle, car, skateboard, cart, bus |
Text files |
_ |
_ |
_ |
_ |
|
rounD [12] |
Roundabouts |
No |
6 |
13746 |
40 |
Drone |
Car, van, truck, bus, trailer, pedestrian, bicycle, motorcycle |
Text files |
Calibrate the drone camera Transformation estimator |
DeepLab-v3+ |
Kalman filter to track road users not detected |
Rauch-Tung-Striebel smoothing |
|
inD [11] |
Intersections |
Yes |
10 |
13599 |
40 |
Drone |
Pedestrian, bicycle, car, truck, bus |
Text files |
Calibrate the drone camera Time synchronization Downsampling and stabilization |
YOLOv5 |
IOU matching and linear Kalman filtering |
RTS smoother |
|
Interaction [10] |
Intersections, roundabouts, merging, lane change |
Yes |
16.5 |
40054 |
12 |
Drone Infrastructure sensors |
Cars, pedestrians |
Text files |
Camera parameter estimation |
2D bounding box |
IOU tracker |
RTS smoother |
|
Five Roundabouts Dataset [18] |
Intersections, roundabouts |
No |
60 |
23000 |
60 |
Vehicle with sensors |
Bike, car, truck |
Text files |
ID disambiguation Static/dynamic object flag Metadata creation |
_ |
_ |
_ |
|
highD [7] |
Highways |
No |
16.5 |
11000 |
40 |
Drone |
Cars, trucks |
Text files |
Calibrate the drone camera Stabilized using OpenCV |
U-Net |
_ |
RTS smoother |
|
SinD [14] |
Intersections |
Yes |
7 |
13248 |
53 |
Drone |
Car, tricycle, truck, pedestrians, bus, motorcycle, bike |
Text files |
Calibrate the drone camera Time synchronization Downsampling and stabilization |
YOLOv5 |
IOU matching and linear Kalman filtering |
RTS smoother |
|
OpenDD [13] |
Roundabouts |
Yes |
62 |
84774 |
20 |
Drone |
Car, van, truck, bus, trailer, pedestrian, bicycle, motorcycle |
Text files |
_ |
_ |
_ |
_ |
|
CitySim [15] |
Intersections, freeways, segment |
Yes |
19 |
n/a |
67 |
Drone |
Cars |
Text files |
Histogram color matching Scale-Invariant Feature Transform features Image blurring |
Mask R-CNN |
Spatial Reliability Tracker (CSRT) |
Enhanced Error Filtering with data fixing tool to further check potential errors |
|
UAH-DriveSet [24] |
Urban |
No |
8.34 |
n/a |
37 |
Vehicle with sensors |
Cars |
Text files |
_ |
_ |
_ |
_ |
|
HDBD [27] |
_ |
No |
10240 |
n/a |
27 |
Simulator |
Cars |
Text files |
Z-normalization synchronize and down-sample linearinterpolation |
CNN |
_ |
_ |
|
DBNet [16] |
_ |
No |
20 |
n/a |
20 |
Vehicle with sensors |
Cars |
Video/ |
Frames Fusion Synchronization Addressing Errors |
_ |
_ |
_ |
|
CITR [9] |
Designed experiment (parking) |
No |
0.5 |
340 |
24 |
Drone |
Pedestrian, golf-cart |
Text files |
Stabilization Scale-invariant feature transform algorithm Random sample consensus Coordinate transformation Kalman filter |
_ |
Correlation Filter with Channel Spatial Reliability |
_ |
|
Dut [9] |
Campus |
No |
0.5 |
1793 |
32 |
Drone |
Pedestrian, vehicles |
Text files |
Stabilization Scale-invariant feature transform algorithm Coordinate transformation Kalman filter |
_ |
Correlation Filter with Channel Spatial Reliability |
_ |
|
HDD Dataset [23] |
Suburban, urban and highway |
No |
104 |
n/a |
1 |
Vehicle with sensors |
Cars |
Text files |
The annotation by open source softwareELAN3 |
LSTM |
_ |
_ |
|
NGSIM [17] |
Freeways, arterial segments |
No |
1.5 |
n/a |
25 |
Infrastructure sensors |
Motorcycle, car, truck |
Text files |
_ |
_ |
_ |
_ |
|
SHRP 2 [19] |
Highways |
No |
1 M |
n/a |
19 |
Vehicle, infrastructure sensors |
Cars |
Text files |
Smoothing Kalman filter |
_ |
_ |
_ |
|
100-car naturalistic study [20] |
_ |
No |
43000 |
2 M |
+ 20 |
Vehicle with sensors |
Cars |
Text files |
|
_ |
_ |
_ |
|
UDRIVE [21] |
Different European regions |
No |
53157 |
n/a |
344 |
Vehicle, infrastructure sensors |
Cars |
Text files |
Decryption, Conversion, Synchronization, Harmonization Data enrichment |
_ |
_ |
_ |
|
Driver behavior dataset [22] |
Urban |
No |
0.8 |
n/a |
8 |
Vehicle with sensors |
Cars |
Text files |
_ |
_ |
_ |
_ |
3.3 Synthesis
In general, there are three main approaches for collecting data in ITS:
1. On-board sensors: Datasets collected from on-board sensors include two types of systems. The first type involves motion data of surrounding entities obtained from on-board LiDAR and front cameras, as exemplified by the Stanford Drone Dataset. The second type includes data on the movements of multiple vehicles collected from on-board GPS, as seen in a 100-car naturalistic study.
2. Drones: Drones equipped with high-resolution cameras can provide a "bird's-eye view" perspective, enabling the recording of traffic data with accurate vehicle geometry and distances between vehicles, as demonstrated in the highD dataset.
3. Driving simulators: Data captured from driving simulators allows for the simulation of traffic scenarios in a controlled and safe environment. This approach offers the advantage of having complete experimental control over the conditions under which the data is collected.
Each of these data collection approaches has its unique benefits and applications, and researchers can choose the most appropriate method based on their specific research goals and requirements in the field of ITS.
In the upcoming sections, we will introduce the Weighted Scoring Model (WSM) approach to validate and compare the data source methods and datasets presented in our research analysis. Through the application of the WSM approach, we aim to provide an objective and comprehensive evaluation of the data sources and datasets under consideration.
Multiple Criteria Decision Making is a subset of operations research dedicated to assessing and comparing various options or alternatives using multiple criteria or factors. It includes a variety of methods, like Weighted Scoring Model (WSM), Analytic Hierarchy Process (AHP), Analytic Network Process (ANP), etc. In this paper, we used the WSM [29] based on its simplicity and flexibility to compare data sources and datasets. In this approach, each criterion is assigned a weight, signifying its relative importance in the decision-making process. Subsequently, each option is evaluated and scored against these criteria. To calculate a weighted score for each option, the WSM multiplies the score of each criterion by its corresponding weight and then sums up these weighted scores. This process enables decision-makers to quantitatively analyze and rank the options, considering both the significance of each criterion and the performance of each option against those criteria. The WSM Method is utilized in this paper to compare the data source and dataset used in Intelligent Transport Systems (ITS). The application of this strategy involves the following steps:
Determine criteria: Firstly, the criteria that constitute the data collection methods are identified. These criteria serve as the basis for evaluating and comparing the data sources and datasets.
Assign weight to the criteria: Each criterion is assigned a weight that reflects its relative importance in comparison to the other criteria. The weights are determined based on the significance of each criterion in achieving the research objectives.
Create a table of criteria and measurement methods: A table is constructed, listing the chosen criteria and the corresponding measurement methods used to assess the data sources and datasets.
Table of weight: Next, a table is created that displays the assigned weights for each criterion. The scores indicate how well each element performs with respect to each criterion.
Calculation of method score: The WSM calculates a weighted score for each criterion in data source and dataset by multiplying the score of each criterion by its assigned weight and then summing them up. This results in an overall score for each element. The element with the highest weighted score is the one that you should choose.
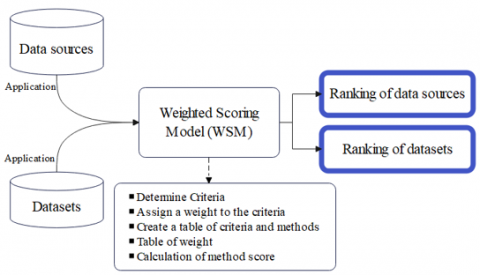
In this paper, the Weighted Scoring Model (WSM) method is applied at the data source level to determine the best method for data collection. The WSM method is further applied to choose the best dataset among the datasets presented in section 2. Figure 7 illustrates the step-by-step process of this approach.
Figure 7. Our methodology
5.1 Criteria
The choice of comparison criteria is based on intelligent transport system studies, with a specific focus on driver behavior. These criteria represent common characteristics that are widely considered standards used by many researchers to collect data on these topics. A detailed explanation of the comparison criteria can be found in Section 3 of the paper (: Scenario description, Naturalistic behavior, Efficiency, Flexibility, Time of monitoring, Mistakes), where each criterion is elaborated upon.
5.2 Comparison study
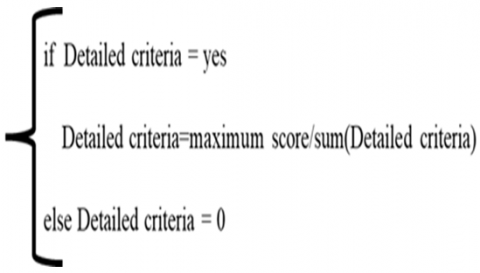
Table 4 presents the comparison between the data source methods and the criteria for comparison. In this table, the scores are provided, with a maximum score of 5 and a minimal score of 0, indicating the performance of each data source method against the established criteria. Figure 8 illustrates how the score of detailed criteria is calculated.
Figure 8. Criteria score for data sources
5.3 Application of Weighted Scoring Model
Table 5 shows the WSM results for each data source. According to how important a criterion is, weighting percentages are assigned. According to their importance, these two criteria: Scenario description and naturalistic behavior are given precedence. A weight of 0.2 is assigned to each of these criteria. Effectiveness, flexibility, time of monitoring, and mistakes are given the second category of priority for the criteria. This criterion is given a weight of 0.15. The sum of the weights is equal to 1.
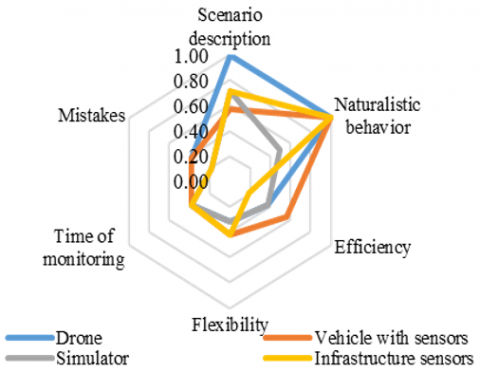
Figure 9, which displays the comparison of data source methods in terms of the six requirements, presents the results in a radar chart format. The radar chart allows for a visual representation of how each data source method performs across the different criteria. Based on the previous results and Table 5, the drone method emerges as the best data source for collecting a dataset for driver and vehicle studies, achieving a total score of 3.44. Following closely behind is the data collection from vehicles with sensors, which obtains a total score of 3.31. The infrastructure sensors rank next with a total score of 2.89, and simulators have a score of 2.47.
The radar chart offers a concise overview of the performance of each data source method concerning the requirements, enabling researchers to identify the most suitable data source for their specific research objectives, particularly when focusing on driver and vehicle-related studies. These findings provide valuable insights into the strengths and limitations of each data source method, aiding in informed decision-making for data collection in the field of ITS.
Figure 9. Multicriteria spider graph for data sources
Table 4. Comparative study for data sources
|
Criteria |
Detailed Criteria |
Drone |
Vehicle with Sensors |
Simulator |
Infrastructure Sensors |
|
Scenario description |
·Object detection |
0,71 |
0,71 |
0,71 |
0,71 |
|
·Scene flow |
0,71 |
0 |
0,71 |
0,71 |
|
|
·3D visual odometry |
0,71 |
0 |
0,71 |
0 |
|
|
·Road user types |
0,71 |
0,71 |
0,71 |
0,71 |
|
|
·HD maps with semantics |
0,71 |
0 |
0 |
0 |
|
|
·Traffic light states |
0,71 |
0,71 |
0,71 |
0,71 |
|
|
·User movements |
0,71 |
0,71 |
0 |
0,71 |
|
|
Total (natural number) |
5 |
3 |
4 |
4 |
|
|
Naturalistic behavior |
·No occlusions by road users |
2,5 |
2,5 |
2,5 |
2,5 |
|
·Behavior recorded is natural |
2,5 |
2,5 |
0 |
2,5 |
|
|
Total (natural number) |
5 |
5 |
3 |
5 |
|
|
Efficiency |
·Ease of installation |
1,25 |
1,25 |
0 |
0 |
|
·Difficulty in installation |
0 |
0 |
0 |
1,25 |
|
|
·Easy to use |
0 |
1,25 |
1,25 |
0 |
|
|
·Use a person to control |
1,25 |
1,25 |
1,25 |
0 |
|
|
Total (natural number) |
3 |
4 |
3 |
1 |
|
|
Flexibility |
·Weather patterns |
0 |
0,71 |
0,71 |
0,71 |
|
·Different types of sensors |
0 |
0,71 |
0 |
0 |
|
|
·Low cost |
0 |
0,71 |
0 |
0 |
|
|
·Expensive |
0,71 |
0 |
0,71 |
0,71 |
|
|
·Lightweight |
0,71 |
0,71 |
0 |
0 |
|
|
·Need specific settings |
0,71 |
0 |
0,71 |
0,71 |
|
|
·Difficult to change |
0 |
0 |
0 |
0,71 |
|
|
Total (natural number) |
2 |
3 |
2 |
3 |
|
|
Time of monitoring |
·Specific time |
2,5 |
2,5 |
2,5 |
0 |
|
·Any time |
0 |
0 |
0 |
2,5 |
|
|
Total (natural number) |
3 |
3 |
3 |
3 |
|
|
Mistakes |
·Errors due to weather conditions |
1,25 |
0 |
0 |
0 |
|
·Errors due to noise |
0 |
1,25 |
0 |
0 |
|
|
·Errors of hardware collection of data |
1,25 |
1,25 |
0 |
1,25 |
|
|
·Errors due to the difference between the simulator environment and the real |
0 |
0 |
1,25 |
0 |
|
|
Total (natural number) |
3 |
3 |
1 |
1 |
Table 5. Table of WSM results
|
Criteria |
Weight |
Drone |
Vehicle with Sensors |
Simulator |
Infrastructure Sensors |
|
Scenario description |
0,2 |
0,99 |
0,57 |
0,71 |
0,71 |
|
Naturalistic behavior |
0,2 |
1,00 |
1,00 |
0,50 |
1,00 |
|
Efficiency |
0,15 |
0,38 |
0,56 |
0,38 |
0,19 |
|
Flexibility |
0,15 |
0,32 |
0,43 |
0,32 |
0,43 |
|
Time of monitoring |
0,38 |
0,38 |
0,38 |
0,38 |
0,38 |
|
Mistakes |
0,15 |
0,38 |
0,38 |
0,19 |
0,19 |
|
Score |
1,00 |
3,44 |
3,31 |
2,47 |
2,89 |
In this section, we developed a comparative study of the most important datasets on ITS using the WSM method.
6.1 Criteria
The choice of criteria for comparing datasets is extracted from previous works that have contributed to the construction of datasets related to intelligent transport systems in general and driver behavior in particular. The comparison criteria adopted are map, hours, features, data source, and road user type.
6.2 Comparison study
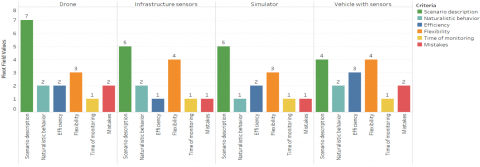
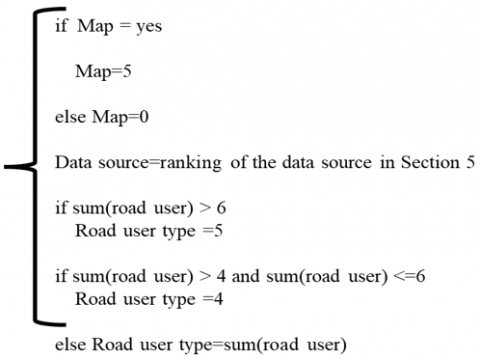
Table 6 shows for each criterion, the value that corresponds to each criterion is assigned. The values are derived from previous work conducted in sections 2 and 3 of the paper, and the calculations are illustrated in Figure 10 and Table 7. Each dataset is evaluated and assigned a score for each criterion, ranging from 0 to 5. These scores represent the performance of each dataset concerning the specific criteria established in the research.
6.3 Application of Weighted Scoring Model
The results in Table 8 show the WSM results for each dataset. The measurement method is given a weight of 0.3. Hours, features, and road user type are given the second category of priority for the criteria. This criterion is given a weight of 0.2. The last criteria is map; this criterion has a weight of 0.1. The sum of the weights is equal to 1.
Table 6. Comparative study of criteria for each dataset
|
Datasets |
Map |
Hour |
Features |
Data Source |
Road User |
|
SDD [8] |
0 |
1 |
0 |
5 |
4 |
|
rounD [12] |
0 |
1 |
3 |
5 |
5 |
|
inD [11] |
1 |
1 |
3 |
5 |
4 |
|
Interaction [10] |
1 |
1 |
1 |
5 |
2 |
|
Five Roundabouts Dataset [18] |
0 |
1 |
4 |
4 |
3 |
|
highD [7] |
0 |
1 |
3 |
5 |
2 |
|
SinD [14] |
1 |
1 |
3 |
5 |
5 |
|
OpenDD [13] |
1 |
1 |
2 |
5 |
5 |
|
CitySim [15] |
1 |
1 |
4 |
5 |
1 |
|
CITR [9] |
0 |
1 |
2 |
5 |
2 |
|
Dut [9] |
0 |
1 |
2 |
5 |
2 |
|
HDD [23] |
0 |
1 |
1 |
4 |
1 |
|
NGSIM [17] |
0 |
1 |
2 |
3 |
3 |
|
SHRP 2 [19] |
0 |
5 |
1 |
4 |
1 |
|
100car naturalistic study [20] |
0 |
3 |
2 |
4 |
1 |
|
UDRIVE [21] |
0 |
3 |
5 |
4 |
1 |
|
Driver behavior dataset [22] |
0 |
1 |
1 |
4 |
1 |
|
UAHDriveSet [24] |
0 |
1 |
2 |
4 |
1 |
|
HDBD [27] |
0 |
1 |
2 |
2 |
1 |
|
DBNet [16] |
0 |
1 |
2 |
4 |
1 |
Table 7. Criteria score for hours for datasets
|
Hours/Features |
Interval of Number of Hours |
Interval of Number of Features |
|
1 |
1-20000 |
1-20 |
|
2 |
20000-40000 |
20-40 |
|
3 |
40000-60000 |
40-60 |
|
4 |
60000-80000 |
60-80 |
Table 8. Table of WSM results
|
|
Map |
Hour |
Feature |
Data Source |
Road User |
Score |
|
Weightage |
0.1 |
0.2 |
0.2 |
0.3 |
0.2 |
1 |
|
SDD [8] |
0 |
0,2 |
0 |
1,5 |
0,8 |
2,5 |
|
rounD [12] |
0 |
0,2 |
0,6 |
1,5 |
1 |
3,3 |
|
inD [11] |
0,1 |
0,2 |
0,6 |
1,5 |
0,8 |
3,2 |
|
Interaction [10] |
0,1 |
0,2 |
0,2 |
1,5 |
0,4 |
2,4 |
|
Five Roundabouts Dataset [18] |
0 |
0,2 |
0,8 |
1,2 |
0,6 |
2,8 |
|
highD [7] |
0 |
0,2 |
0,6 |
1,5 |
0,4 |
2,7 |
|
SinD [14] |
0,1 |
0,2 |
0,6 |
1,5 |
1 |
3,4 |
|
OpenDD [13] |
0,1 |
0,2 |
0,4 |
1,5 |
1 |
3,2 |
|
CitySim [15] |
0,1 |
0,2 |
0,8 |
1,5 |
0,2 |
2,8 |
|
CITR [9] |
0 |
0,2 |
0,4 |
1,5 |
0,4 |
2,5 |
|
Dut [9] |
0 |
0,2 |
0,4 |
1,5 |
0,4 |
2,5 |
|
HDD [23] |
0 |
0,2 |
0,2 |
1,2 |
0,2 |
1,8 |
|
NGSIM [17] |
0 |
0,2 |
0,4 |
0,9 |
0,6 |
2,1 |
|
SHRP 2 [19] |
0 |
1 |
0,2 |
1,2 |
0,2 |
2,6 |
|
100-car naturalistic study [20] |
0 |
0,6 |
0,4 |
1,2 |
0,2 |
2,4 |
|
UDRIVE [21] |
0 |
0,6 |
1 |
1,2 |
0,2 |
3 |
|
Driver behavior dataset [22] |
0 |
0,2 |
0,2 |
1,2 |
0,2 |
1,8 |
|
UAH-DriveSet [24] |
0 |
0,2 |
0,4 |
1,2 |
0,2 |
2 |
|
HDBD [27] |
0 |
0,2 |
0,4 |
0,6 |
0,2 |
1,4 |
|
DBNet [16] |
0 |
0,2 |
0,4 |
1,2 |
0,2 |
2 |
Figure 10. Criteria score for dataset
Figure 11. Multicriteria spider graph for datasets
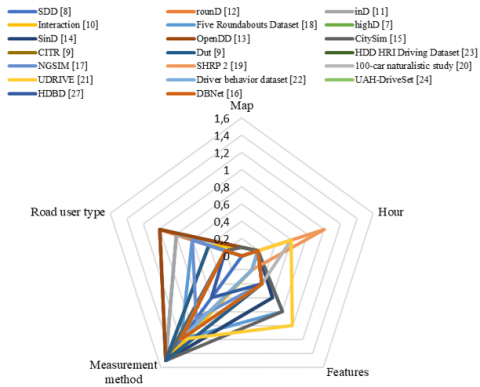
In this analysis, we compare the datasets based on the five requirements. The comparison results are depicted in a radar chart format, as shown in Figure 11. According to the findings, the SinD dataset achieves the highest score of 3.4, followed closely by the rounD dataset with a score of 3.3. The OpenDD and inD datasets both obtain a score of 3.2 for each. Other dataset scores are shown in Table 8.
The radar chart visually illustrates the performance of each dataset concerning the established requirements, offering a clear and concise overview of their strengths and capabilities. These results enable researchers to make informed decisions when selecting the most suitable dataset for their specific research objectives in the domain of intelligent transport systems.
By considering the scores obtained by each dataset against the requirements, researchers can identify the datasets that align best with their research goals, ensuring the optimal choice for conducting in-depth studies on driver behavior and other related aspects in the field of intelligent transport systems.
The paper initiates a comparative analysis of various data sources and datasets within the realm of ITS. Furthermore, it presents a comparative study employing a Weighted Scoring Model. It involves assigning weights to various criteria or factors that are relevant to the comparison of data sources and datasets. These criteria may include scenario description, naturalistic behavior, efficiency, flexibility, monitoring duration, and mistakes for data sources. On the other hand, criteria such as maps, hours, features, data source quality, and road user type are used to compare datasets. Each data source and dataset are then evaluated and scored against these criteria, considering their respective weights. The WSM calculates a weighted score for each data source and dataset, representing its overall performance based on the specified criteria. The results indicate that the drone method is the best measurement method to collect a dataset for the driver and vehicle, with a total score of 3.36. Additionally, the SinD dataset receives the highest score of 3.4. These models of WSM provide a quantitative and systematic approach to objectively compare data sources and datasets in the context of ITS, aiding decision-making processes and facilitating the selection of the most suitable data source and dataset for a given application. While this study is certainly important, it is worth noting that the choice of a dataset or data source also depends on various conditions, choices, and possibilities available to researchers. In future work, we explore the potential of machine learning and deep learning algorithms to study drivers' behavior.
[1] Bouhsissin, S., Sael, N., Benabbou, F. (2021). Enhanced VGG19 model for accident detection and classification from video. In 2021 International Conference on Digital Age & Technological Advances for Sustainable Development (ICDATA), Marrakech, Morocco, pp. 39-46. https://doi.org/10.1109/ICDATA52997.2021.00017
[2] Ghadi, M.Q. (2023). Multilevel analysis of road accident frequency: The impact of the road category. International Journal of Transport Development and Integration, 7(2): 123-130. https://doi.org/10.18280/ijtdi.070207
[3] Das, A., Ghasemzadeh, A., Ahmed, M.M. (2019). Analyzing the effect of fog weather conditions on driver lane-keeping performance using the SHRP2 naturalistic driving study data. Journal of Safety Research, 68: 71-80. https://doi.org/10.1016/j.jsr.2018.12.015
[4] Kamble, S.J., Kounte, M.R. (2020). Machine learning approach on traffic congestion monitoring system in internet of vehicles. Procedia Computer Science, 171: 2235-2241. https://doi.org/10.1016/j.procs.2020.04.241
[5] Bouhsissin, S., Sael, N., Benabbou, F. (2022). Prediction of risks in intelligent transport systems. In Proceedings of the 5th International Conference on Big Data and Internet of Things, Springer, Cham, pp. 303-316. https://doi.org/10.1007/978-3-031-07969-6_23
[6] Adeliyi, T.T., Oluwadele, D., Igwe, K., Aroba, O.J. (2023). Analysis of road traffic accidents severity using a pruned tree-based model. International Journal of Transport Development and Integration, 7(2): 131-138. https://doi.org/10.18280/ijtdi.070208
[7] Krajewski, R., Bock, J., Kloeker, L., Eckstein, L. (2018). The highD dataset: A drone dataset of naturalistic vehicle trajectories on german highways for validation of highly automated driving systems. In 2018 21st International Conference on Intelligent Transportation Systems (ITSC), Maui, HI, USA, pp. 2118-2125. https://doi.org/10.1109/ITSC.2018.8569552
[8] Robicquet, A., Sadeghian, A., Alahi, A., Savarese, S. (2016). Learning social etiquette: Human trajectory understanding in crowded scenes. In European Conference on Computer Vision - ECCV 2016, Springer, Cham, pp. 549-565. https://doi.org/10.1007/978-3-319-46484-8_33
[9] Yang, D.F., Li, L.H., Redmill, K., Ozguner, U. (2019). Top-view trajectories: A Pedestrian dataset of vehicle-crowd interaction from controlled experiments and crowded campus. In 2019 IEEE Intelligent Vehicles Symposium (IV), Paris, France, pp. 899-904. https://doi.org/10.48550/arXiv.1910.03088
[10] Zhan, W., Sun, L.T., Wang, D., Shi, H.J., Clausse, A., Naumann, M., Kummerle, J., Konigshof, H., Stiller, C., de La Fortelle, A., Tomizuka, M. (2019). Interaction dataset: An international, adversarial and cooperative motion dataset in interactive driving scenarios with semantic maps. arXiv Preprint arXiv, 1-13. http://arxiv.org/abs/1910.03088
[11] Bock, J., Krajewski, R., Moers, T., Runde, S., Vater, L., Eckstein, L. (2020). The inD dataset: A drone dataset of naturalistic road user trajectories at german intersections. In 2020 IEEE Intelligent Vehicles Symposium (IV), Las Vegas, USA, pp. 1929-1934. https://doi.org/10.1109/IV47402.2020.9304839
[12] Krajewski, R., Moers, T., Bock, J., Vater, L., Eckstein, L. (2020). The rounD dataset: A drone dataset of road user trajectories at roundabouts in Germany. In 2020 IEEE 23rd International Conference on Intelligent Transportation Systems (ITSC), Rhodes, Greece, pp. 1-6. https://doi.org/10.1109/ITSC45102.2020.9294728
[13] Breuer, A., Termohlen, J.A., Homoceanu, S., Fingscheidt, T. (2020). openDD: A large-scale roundabout drone dataset. In 2020 IEEE 23rd International Conference on Intelligent Transportation Systems (ITSC), Rhodes, Greece, pp. 1-6. https://doi.org/10.1109/ITSC45102.2020.9294301
[14] Xu, Y.C., Shao, W.B., Li, J., Yang, K., Wang, W.D., Huang, H., Lv, C., Wang, H. (2022). SIND: A drone dataset at signalized intersection in China. In 2022 IEEE 25th International Conference on Intelligent Transportation Systems (ITSC), Macau, China, pp. 2471-2478. https://doi.org/10.1109/ITSC55140.2022.9921959
[15] Zheng, O., Abdel-Aty, M., Yue, L., Abdelraouf, A., Wang, Z.J., Mahmoud, N. (2023). CitySim: A drone-based vehicle trajectory dataset for safety-oriented research and digital twins. Transportation Research Record: Journal of the Transportation Research Board. https://doi.org/10.1177/03611981231185768
[16] Chen, Y.P., Wang, J.K., Li, J., Lu, C.W., Luo, Z.P., Xue, H., Wang, C. (2018). Lidar-video driving dataset: Learning driving policies effectively. In 2018 IEEE Conference on Computer Vision and Pattern Recognition, Salt Lake City, USA, pp. 5870-5878. https://doi.org/10.1109/CVPR.2018.00615
[17] U.S.D. of T.F.H. Administration (2006). Next generation simulation (NGSIM) vehicle trajectories and supporting data. http://doi.org/10.21949/1504477
[18] Zyner, A., Worrall, S., Nebot, E.M. (2019). Acfr five roundabouts dataset: Naturalistic driving at unsignalized intersections. IEEE Intelligent Transportation Systems Magazine, 11(4): 8-18. https://doi.org/10.1109/MITS.2019.2907676
[19] Wu, J.Q., Xu. H. (2017). Driver behavior analysis for right-turn drivers at signalized intersections using SHRP 2 naturalistic driving study data. Journal of Safety Research, 63: 177-185. https://doi.org/10.1016/j.jsr.2017.10.010
[20] Dingus, T.A., Klauer, S., Lewis, V.R., Petersen, A., Lee, S.E. (2006). The 100-car naturalistic driving study phase II-results of the 100-car field experiment. National Highway Traffic Safety Administration. https://www.nhtsa.gov/sites/nhtsa.gov/files/100carmain.pdf
[21] Barnard, Y., Utesch, F., van Nes, N., Eenink, R., Baumann, M. (2016). The study design of UDRIVE: The naturalistic driving study across Europe for cars, trucks and scooters. European Transport Research Review, 8: 14. https://doi.org/10.1007/s12544-016-0202-z
[22] Carvalho, E., Ferreira, B.V., Ferreira, J., Souza, C.D., Carvalho, H.V., Suhara, Y., Pentland, A.S., Pessin, G. (2017). Exploiting the use of recurrent neural networks for driver behavior profiling. In 2017 International Joint Conference on Neural Networks (IJCNN), Anchorage, AK, USA, pp. 3016-3021. https://doi.org/10.1109/IJCNN.2017.7966230
[23] Ramanishka, V., Chen, Y.T., Misu, T., Saenko, K. (2018). Toward driving scene understanding: A dataset for learning driver behavior and causal reasoning. In 2018 IEEE/CVF Conference on Computer Vision and Pattern Recognition, Salt Lake City, USA, pp. 7699-7707. https://doi.org/10.1109/CVPR.2018.00803
[24] Romera, E., Bergasa, L.M., Arroyo, R. (2016). Need data for driver behaviour analysis? Presenting the public UAH-DriveSet. In 2016 IEEE 19th International Conference on Intelligent Transportation Systems (ITSC), Rio de Janeiro, Brazil, pp. 387-392. https://doi.org/10.1109/ITSC.2016.7795584
[25] Dosovitskiy, A., Ros, G., Codevilla, F., Lopez, A., Koltun, V. (2017). CARLA: An open urban driving simulator. In Proceedings of the 1st Annual Conference on Robot Learning, PMLR, 78: 1-16. https://doi.org/10.48550/arXiv.1711.03938
[26] Shah, S., Dey, D., Lovett, C., Kapoor, A. (2017). AirSim: High-fidelity visual and physical simulation for autonomous vehicles. Field and Service Robotics, 5: 621-635. https://doi.org/10.1007/978-3-319-67361-5_40
[27] Qiu, Y.N., Busso, C., Misu, T., Akash, K. (2022). Incorporating gaze behavior using joint embedding with scene context for driver takeover detection. In ICASSP 2022-2022 IEEE International Conference on Acoustics, Speech and Signal Processing (ICASSP), Singapore, Singapore, pp. 4633-4637. https://doi.org/10.1109/ICASSP43922.2022.9747779
[28] Bouhsissin, S., Sael, N., Benabbou, F. (2023). Driver behavior classification: A systematic literature review. IEEE Access, 11: 14128-14153. https://doi.org/10.1109/ACCESS.2023.3243865
[29] Griffith A., Headley, J.D. (1997). Using a weighted score model as an aid to selecting procurement methods for small building works. Construction Management and Economics, 15(4): 341-348. https://doi.org/10.1080/014461997372890