
Ziming Liu | Yuchen Wang | Yan Pan | Guisheng Xiang*
© 2026 The authors. This article is published by IIETA and is licensed under the CC BY 4.0 license (http://creativecommons.org/licenses/by/4.0/).
OPEN ACCESS
Urban gas pipeline accidents arise from interacting human, technical, managerial, and environmental deficiencies, yet accident-data studies often treat association discovery, structural interpretation, and probabilistic diagnosis as separate analytical steps. This study develops an association-informed framework integrating Apriori association mining, interpretive structural modeling (ISM), and Bayesian network (BN) diagnosis. A curated dataset of 150 urban gas pipeline accidents in China from 2016 to 2025 was compiled. Based on the 24Model, 1,065 accident-causation statements were consolidated into 24 factors and encoded as a 150 × 24 binary matrix. At central thresholds of 0.04 support, 0.60 confidence, and 1.10 lift, Apriori mining yielded 62 directional rules representing 58 unique factor pairs. Threshold robustness was examined using 27 parameter combinations and wider one-factor checks. The associated factor pairs were then independently oriented using 24Model logic, accident-process evidence, and domain knowledge. This produced 34 oriented candidate relations, which were reduced to 24 direct BN edges and a five-level directed dependency structure. Conditional probability tables were estimated directly from complete parent-state combinations with Beta(1,1) smoothing. Seven observable direct-cause factors were defined as diagnostic targets. Strong and bootstrap-stable diagnostic relations were identified between inadequate third-party work control and third-party damage, inadequate safety training and communication failure, inadequate maintenance and integrity management and pipeline aging/corrosion, and poor rule and responsibility implementation and design/construction defects. Repeated five-fold cross-validation and 1,000 bootstrap resamples supported the principal findings while revealing several sample-sensitive relations. The framework provides an auditable, accident-sample-conditioned approach to structural and probabilistic diagnosis without interpreting network marginals as population failure probabilities.
accident causation, association rule mining, Bayesian network, interpretive structural modeling, urban gas pipeline
Urban gas pipeline networks are critical components of urban lifeline infrastructure, but their safety is challenged by dense spatial exposure, aging assets, excavation activities, construction defects, operational errors, and changing environmental conditions. Previous studies have examined urban gas pipeline safety through accident-causation analysis [1], quantitative risk assessment [2], dynamic accident tracing [3], network safety and resilience assessment [4], emergency linkage modeling [5], and dynamic risk updating [6]. Related pipeline studies have also incorporated technical, operational, environmental, and human factors into probabilistic risk models [7, 8]. These advances provide important tools for factor identification and risk quantification, but a consistent analytical chain linking accident-case evidence, association discovery, structural interpretation, and probabilistic diagnosis remains limited.
Existing pipeline studies further show that different accident modes are governed by different combinations of technical and organizational conditions. Third-party excavation risk has been modeled using process-informed Bayesian networks (BN) that represent notification, facility records, locating, marking, excavation activities, and pipeline damage [9, 10], while dynamic Bayesian approaches have been used to characterize the evolution of third-party damage risk [11]. Corrosion-oriented Bayesian models link degradation mechanisms with inspection, maintenance, and integrity-management decisions [12]. Recent oil and gas pipeline accident research has also emphasized the joint contribution of human and organizational factors [13]. These findings are compatible with the 24Model, which organizes unsafe acts, unsafe conditions, individual safety capability, safety-management deficiencies, and safety-culture deficiencies within a multilevel accident-causation framework [14-16].
Two methodological issues are particularly important when accident-case data are used to connect association mining with hierarchical and Bayesian modeling. First, the directional notation of an association rule represents conditional co-occurrence rather than causal precedence; causal interpretation of observational associations requires additional structural assumptions or domain knowledge [17]. Safety applications of BN therefore commonly combine accident evidence with process logic or accident-causation theory when determining network structure [9, 18]. Second, finite accident samples introduce uncertainty into both network structure and parameter estimation. Bayesian parameter learning provides a formal basis for estimating local conditional probabilities from observed data [19], while bootstrap resampling can be used to quantify the stability of network features under limited samples [20].
Against this background, this study develops an association-informed Apriori-interpretive structural modeling (ISM)-BN framework using 150 urban gas pipeline accidents in China from 2016 to 2025. The study (i) constructs a 24-factor accident-causation system from 1,065 coded causal statements; (ii) identifies recurrent factor associations and examines their threshold robustness; (iii) constrains structural direction using accident-causation theory, accident-process evidence, and pipeline-safety knowledge before hierarchical modeling; and (iv) performs target-specific Bayesian diagnosis and robustness assessment. The objective is to identify interpretable and empirically supported dependency patterns within documented accident cases and to distinguish stable diagnostic relationships from sample-sensitive ones.
2.1 Accident cases and factor coding
A dataset of 150 urban gas pipeline accidents that occurred in China between 2016 and 2025 was compiled from publicly available accident investigation reports, government notices, professional or industry records, mainstream media reports, and other verifiable public materials. Based on the principal cited source for each case, 78 cases (52.0%) were supported primarily by government or other official sources, 45 (30.0%) by professional or industry sources, 19 (12.7%) by mainstream media, and 8 (5.3%) by other verifiable public materials. The study focused on municipal and yard gas pipelines, buried urban distribution networks, pipeline construction and rehabilitation, maintenance and emergency repair, excavation or drilling damage, corrosion and aging, pipeline-component defects, inadequate burial or separation distance, and relevant external disturbances. Cylinder-gas accidents, accidents confined to indoor end-use appliances, and cases outside the urban pipeline-system boundary were excluded. Because the cases were selected according to study relevance, documentation adequacy, and public availability rather than probability sampling, the dataset is not intended to be statistically representative of all urban gas pipeline accidents in China during 2016–2025.
Before coding, case records were standardized according to accident date, location or project, event description, and principal accident mechanism. Potential duplicates were screened using a normalized event identity combining accident date, location/project or organization, event title, and principal mechanism; high-similarity records were then checked manually against the original sources. Multiple reports referring to the same physical accident were treated as one event, whereas independently documented accidents within the same project or organization were retained as separate cases. Each retained accident was assigned a unique case identifier and linked to its principal source.
Accident-causation information was extracted from the case materials and coded using the 24Model framework. Semantically similar causal descriptions were consolidated into standardized factors. A binary coding scheme was applied: a factor was assigned a value of 1 when its occurrence was supported by the available accident evidence and 0 otherwise. In total, 1,065 original causation statements were consolidated into 24 factors, yielding a 150 × 24 binary accident-causation matrix for subsequent analysis.
To improve coding consistency and reliability, the coding results were independently cross-checked by safety-engineering researchers. Primary coding and any recoding identified during the case audit were verified against the cited source documents by a second researcher; disagreements were resolved through discussion and re-examination of the original evidence. After verification, the final 150 × 24 binary matrix was frozen and used as the single common input for all matrix-derived analyses reported in this study, including association mining, structural derivation, CPT estimation, cross-validation, and bootstrap analysis.
2.2 Accident-causation factor system
The accident-causation factor system was established based on the 24Model, which organizes accident causes across individual and organizational levels [14-16, 21-23]. The 24 factors were classified into five categories: unsafe actions (A), unsafe conditions (B), habitual unsafe behavior and individual safety capability (C), deficiencies in the safety management system (D), and deficiencies in safety culture (E). The factor definitions were adapted to the operational characteristics of urban gas pipeline systems while retaining the hierarchical logic of the 24Model. The resulting factor system is presented in Table 1.
Table 1. Accident-causation factor system for urban gas pipeline accidents
|
24Model Causal Level |
Category |
Code |
Accident-Causation Factor |
|
Direct causes |
Unsafe actions (A) |
A1 |
Third-party damage |
|
Direct causes |
Unsafe actions (A) |
A2 |
Unsafe operation |
|
Direct causes |
Unsafe actions (A) |
A3 |
Communication failure |
|
Direct causes |
Unsafe conditions (B) |
B1 |
Pipeline aging and corrosion |
|
Direct causes |
Unsafe conditions (B) |
B2 |
Coating/cathodic protection failure |
|
Direct causes |
Unsafe conditions (B) |
B3 |
Joint and weld defects |
|
Direct causes |
Unsafe conditions (B) |
B4 |
Insufficient burial/safety distance |
|
Direct causes |
Unsafe conditions (B) |
B5 |
Missing markers/warnings |
|
Direct causes |
Unsafe conditions (B) |
B6 |
Monitoring and alarm failure |
|
Direct causes |
Unsafe conditions (B) |
B7 |
Design/construction defects |
|
Direct causes |
Unsafe conditions (B) |
B8 |
External environmental damage |
|
Indirect causes |
Habitual unsafe behaviors (C) |
C1 |
Insufficient safety competence |
|
Indirect causes |
Habitual unsafe behaviors (C) |
C2 |
Poor risk perception |
|
Indirect causes |
Habitual unsafe behaviors (C) |
C3 |
Poor emergency-response capability |
|
Indirect causes |
Safety management system (D) |
D1 |
Inadequate inspection |
|
Indirect causes |
Safety management system (D) |
D2 |
Inadequate hazard rectification |
|
Indirect causes |
Safety management system (D) |
D3 |
Inadequate third-party work control |
|
Indirect causes |
Safety management system (D) |
D4 |
Poor pipeline records/disclosure |
|
Indirect causes |
Safety management system (D) |
D5 |
Inadequate safety training |
|
Indirect causes |
Safety management system (D) |
D6 |
Poor rule and responsibility implementation |
|
Indirect causes |
Safety management system (D) |
D7 |
Inadequate maintenance and integrity management |
|
Indirect causes |
Safety management system (D) |
D8 |
Inadequate emergency preparedness |
|
Root causes |
Safety culture (E) |
E1 |
Insufficient safety investment |
|
Root causes |
Safety culture (E) |
E2 |
Poor accident feedback and learning |
2.3 Apriori association mining and hierarchical structural modeling
Apriori association-rule mining was applied to identify recurrent co-occurrence relationships among the 24 coded factors [24, 25]. For a rule $X \rightarrow Y$, support, confidence, and lift were calculated as follows:
$\operatorname{Support}(X \rightarrow Y)=\frac{n(X \cap Y)}{N}$ (1)
$\operatorname{Confidence}(X \rightarrow Y)=\frac{n(X \cap Y)}{n(X)}$ (2)
$\operatorname{Lift}(X \rightarrow Y)=\frac{P(Y \mid X)}{P(Y)}$ (3)
where, N is the total number of accident cases, n(X) is the number of cases containing factor X, and n(X∩Y) is the number containing both factors. Association rules were retained when support, confidence, and lift were no lower than 0.04, 0.60, and 1.10, respectively. Reciprocal representations of the same factor association were consolidated at the factor-pair level for subsequent structural orientation, while both directional rules remained in the association-rule results.
Directional relationships used for hierarchical modeling were determined by combining the 24Model hierarchy with accident-process information and established pipeline-safety knowledge. Only relationships with a supported directional interpretation were included in the directed relation matrix. The matrix was transformed into a reachability matrix using Boolean operations, and ISM levels were identified iteratively from the reachability set R(i) and antecedent set A(i) [26]. A factor was assigned to the current upper level when
$R(i)=R(i) \cap A(i)$ (4)
After each level was removed, the procedure was repeated until all directionally connected factors had been classified. A transitive reduction was then applied to remove redundant direct links while preserving node reachability. The resulting direct relations were used as the structural basis of the BN.
2.4 Bayesian network modeling and diagnostic inference
A discrete BN was constructed from the directed dependency structure. Of the 24 coded accident-causation factors, the 20 factors with directionally supported relationships were represented as binary nodes with states Yes and No. B2, B6, B8, and E1 were retained in the factor system and association analysis but were not included in the directed BN because no sufficiently supported directional relationships were identified. For a BN containing nodes $X_1, \ldots, X_p$, the joint distribution was factorized as [19, 27, 28]
$P\left(X_1, \ldots, X_p\right)=\prod_{i=1}^p P\left(X_i \mid P a\left(X_i\right)\right)$ (5)
where, Pa(Xi) denotes the parent set of node Xi. Conditional probability tables (CPTs) were estimated directly from the binary accident matrix. For node Xi under parent-state configuration paj, a symmetric Beta(1,1) prior was adopted:
$\hat{P}\left(X_i=1 \mid p a_j, D\right)=\frac{N_{1 j}+1}{N_{1 j}+N_{0 j}+2}$ (6)
where, N1j and N0j are the numbers of cases in which Xi was coded as Yes and No, respectively, under paj. The same estimation procedure was applied to all parent-state configurations.
The BN was implemented and analyzed using GeNIe Modeler (BayesFusion, LLC), which was used for network visualization and probabilistic inference.
Diagnostic inference was conducted for direct-cause factors located at the upper level of the directed ISM and connected to at least one upstream node in the BN. Seven factors satisfied these criteria: A1, A2, A3, B1, B3, B4, and B7. For an upstream factor X and target factor T, the diagnostic probability change and conditional probability contrast were defined as
$\Delta_{\text {diag}}(X, T)=P(X=1 \mid T=1)-P(X=1)$ (7)
$\begin{gathered}\Delta_{\text {cond}}(X, T)=P(T=1 \mid X=1)-P(T=1 \mid X=0)\end{gathered}$ (8)
These two measures were used to characterize target-specific probabilistic dependencies among the accident-causation factors.
2.5 Robustness analysis
Robustness was evaluated at the association-rule, BN-parameter, and network-structure levels. Threshold sensitivity was first examined using 27 combinations of support (0.03, 0.04, and 0.05), confidence (0.55, 0.60, and 0.65), and lift (1.05, 1.10, and 1.15). Additional one-factor sensitivity tests extended the ranges to 0.02-0.06 for support, 0.50-0.70 for confidence, and 1.00-1.20 for lift. Similarity between each rule set and the central rule set was evaluated using the Jaccard index:
$J(A, B)=\frac{|A \cap B|}{|A \cup B|}$ (9)
The predictive stability of the BN parameters was assessed using 20 repetitions of five-fold cross-validation. CPTs were re-estimated within each training fold, and predictive performance on held-out cases was evaluated using mean negative log-likelihood per binary variable. Sensitivity to the Beta prior was examined using α = 0.5, 1.0, and 2.0.
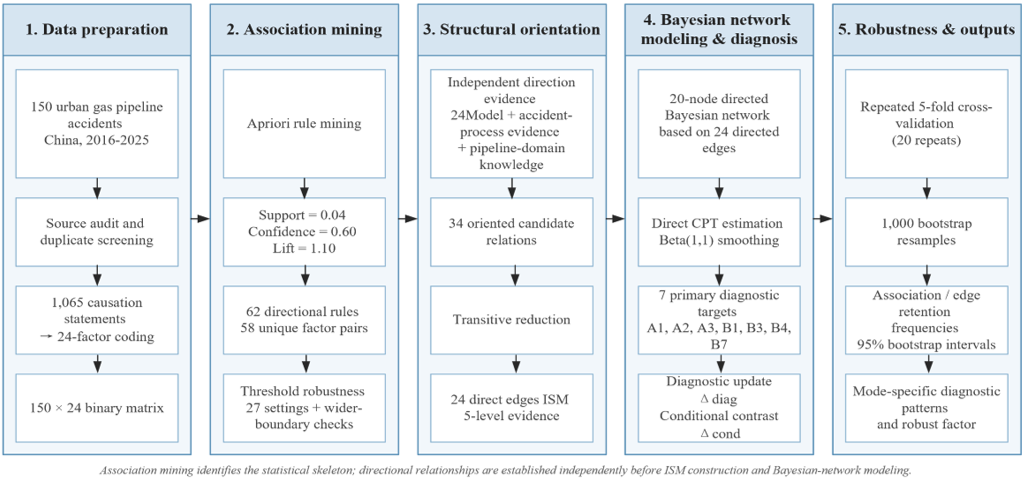
Sampling uncertainty was further evaluated using 1,000 non-parametric bootstrap replicates, with 150 cases sampled with replacement in each replicate [20]. For structural robustness, Apriori mining and the predefined direction-assignment procedure were repeated and the retention frequencies of the central associations and directed edges were recorded. For probabilistic inference, the final BN structure was retained and its CPTs were re-estimated for each bootstrap sample. The resulting distributions of Δdiag and Δcond were summarized using percentile-based 95% intervals, together with the frequencies with which each upstream factor ranked among the leading diagnostic factors. The complete analytical workflow is summarized in Figure 1.
Figure 1. Analytical workflow of the association-informed interpretive structural modeling (ISM)-BN framework
3.1 Association patterns and hierarchical dependency structure
At the central thresholds of support = 0.04, confidence = 0.60, and lift = 1.10, the Apriori analysis generated 62 directional association rules. Four factor pairs were represented by reciprocal rules, so the 62 rules corresponded to 58 unique associated factor pairs. Across the 27 threshold combinations, 38 directional rules were consistently retained. Support changes produced limited variation in the rule count, whereas confidence produced the largest changes in both rule number and composition. When support varied from 0.03 to 0.05, 61-62 rules were retained; changing confidence from 0.55 to 0.65 reduced the rule count from 80 to 43; and changing lift from 1.05 to 1.15 reduced it from 69 to 54.
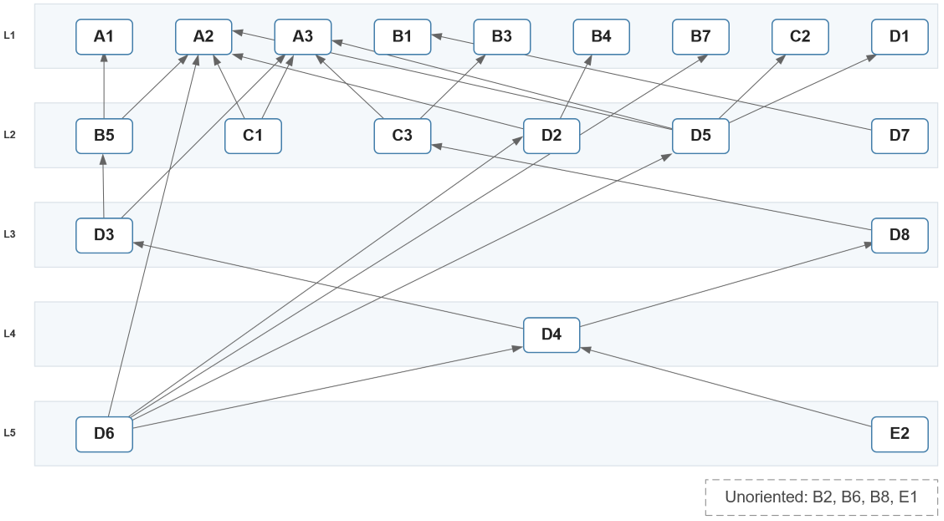
Among the 58 associated factor pairs, 34 were assigned directional relationships, whereas 24 remained association-only relationships. The resulting 34-edge directed graph contained no directed cycles. Transitive reduction removed 10 redundant links, yielding 24 direct relationships while preserving the reachability of the original directed graph.
The directionally connected factors were partitioned into five hierarchical levels by ISM (Figure 2). L1 contained A1, A2, A3, B1, B3, B4, B7, C2, and D1; L2 contained B5, C1, C3, D2, D5, and D7; L3 contained D3 and D8; D4 occupied L4; and D6 and E2 formed L5. B2, B6, B8, and E1 did not retain sufficiently supported directed relationships and were not assigned to the directed hierarchy.
Figure 2. Hierarchical dependency structure of urban gas pipeline accident-causation factors
3.2 Bayesian network structure and marginal activation patterns
The BN comprised 20 directionally supported binary accident-causation nodes and 24 direct dependency edges (Figure 3). The maximum parent count was five for A2, followed by four for A3 and two for D4; all other non-root nodes had one parent. The complete network required 82 CPT rows. Of these, 72 parent-state configurations were observed in the 150 accident cases and 10 were unobserved; 21 observed configurations were represented by fewer than five cases. For A2, 23 of 32 possible parent configurations were observed; for A3, 15 of 16 were observed; and all four configurations of D4 were represented.
Figure 3. Bayesian network of the 20 directionally supported urban gas pipeline accident-causation factors and marginal activation probabilities
The fitted marginal activation probabilities for the 20 nodes included in the directed BN are summarized in Table 2. D3 had the highest marginal probability (0.663), followed by D6 (0.559), C2 (0.558), A2 (0.530), A1 (0.526), and E2 (0.513). The BN-derived marginal probabilities closely reproduced the observed factor frequencies for these 20 nodes, with a mean absolute error of 0.0078 and a root-mean-square error of 0.0107.
Table 2. Descriptive statistics and network characteristics of the 24 accident-causation factors
|
Code |
Accident-Causation Factor |
Frequency n (%) |
Directed ISM Level |
BN Role |
Marginal P(Yes) |
|
A1 |
Third-party damage |
79 (52.7) |
L1 |
Primary diagnostic target |
0.526 |
|
A2 |
Unsafe operation |
84 (56.0) |
L1 |
Primary diagnostic target |
0.530 |
|
A3 |
Communication failure |
59 (39.3) |
L1 |
Primary diagnostic target |
0.417 |
|
B1 |
Pipeline aging and corrosion |
13 (8.7) |
L1 |
Primary diagnostic target |
0.097 |
|
B2 |
Coating/cathodic protection failure |
9 (6.0) |
Unoriented |
Not included in directed BN |
— |
|
B3 |
Joint and weld defects |
17 (11.3) |
L1 |
Primary diagnostic target |
0.123 |
|
B4 |
Insufficient burial/safety distance |
15 (10.0) |
L1 |
Primary diagnostic target |
0.110 |
|
B5 |
Missing markers/warnings |
16 (10.7) |
L2 |
Intermediate antecedent |
0.117 |
|
B6 |
Monitoring and alarm failure |
22 (14.7) |
Unoriented |
Not included in directed BN |
— |
|
B7 |
Design/construction defects |
32 (21.3) |
L1 |
Primary diagnostic target |
0.221 |
|
B8 |
External environmental damage |
19 (12.7) |
Unoriented |
Not included in directed BN |
— |
|
C1 |
Insufficient safety competence |
33 (22.0) |
L2 |
Root antecedent |
0.224 |
|
C2 |
Poor risk perception |
84 (56.0) |
L1 |
Terminal non-target |
0.558 |
|
C3 |
Poor emergency-response capability |
19 (12.7) |
L2 |
Intermediate antecedent |
0.136 |
|
D1 |
Inadequate inspection |
26 (17.3) |
L1 |
Terminal non-target |
0.182 |
|
D2 |
Inadequate hazard rectification |
63 (42.0) |
L2 |
Intermediate antecedent |
0.422 |
|
D3 |
Inadequate third-party work control |
100 (66.7) |
L3 |
Intermediate antecedent |
0.663 |
|
D4 |
Poor pipeline records/disclosure |
66 (44.0) |
L4 |
Intermediate antecedent |
0.444 |
|
D5 |
Inadequate safety training |
38 (25.3) |
L2 |
Intermediate antecedent |
0.260 |
|
D6 |
Poor rule and responsibility implementation |
84 (56.0) |
L5 |
Root antecedent |
0.559 |
|
D7 |
Inadequate maintenance and integrity management |
33 (22.0) |
L2 |
Root antecedent |
0.224 |
|
D8 |
Inadequate emergency preparedness |
23 (15.3) |
L3 |
Intermediate antecedent |
0.162 |
|
E1 |
Insufficient safety investment |
61 (40.7) |
Unoriented |
Not included in directed BN |
— |
|
E2 |
Poor accident feedback and learning |
77 (51.3) |
L5 |
Root antecedent |
0.513 |
3.3 Target-specific Bayesian diagnostic results
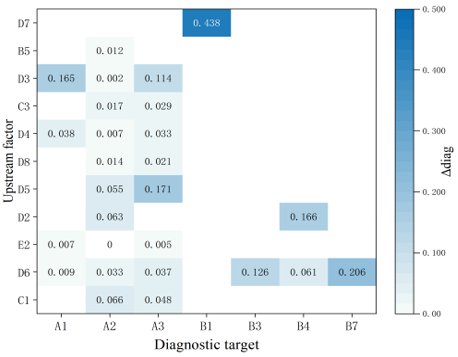
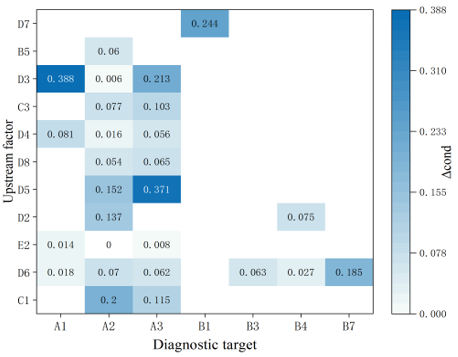
Seven result-side direct-cause factors were analyzed as primary diagnostic targets: A1, A2, A3, B1, B3, B4, and B7. Their upstream posterior changes and conditional probability contrasts differed substantially across targets (Figures 4, 5, and Table 3), indicating target-specific rather than uniform diagnostic patterns.
For third-party damage (A1), D3 showed the largest diagnostic update: its probability increased from 0.663 to 0.828 when A1 was observed, corresponding to Δdiag = 0.165 and Δcond = 0.388. For unsafe operation (A2), C1, D2, and D5 produced the three largest diagnostic changes, at 0.066, 0.063, and 0.055, respectively. Their similar magnitudes indicate a distributed upstream pattern rather than a single dominant antecedent.
For communication failure (A3), D5 produced the largest posterior increase (Δdiag = 0.171), followed by D3 (0.114). Distinct patterns were also observed for the physical-condition targets. D7 showed a diagnostic change of 0.438 for pipeline aging/corrosion (B1); D6 showed a change of 0.126 for joint and weld defects (B3); D2 showed the largest change for insufficient burial/safety distance (B4), at 0.166; and D6 increased by 0.206 for design/construction defects (B7).
Figure 4. Target-specific diagnostic probability changes in the Bayesian network
Figure 5. Conditional probability contrasts between upstream factors and diagnostic targets
Table 3. Principal target-specific diagnostic relationships
|
Target |
Antecedent |
Baseline P(X) |
Posterior P(X|T=Yes) |
Δdiag |
Δcond |
|
A1 |
D3 |
0.663 |
0.828 |
0.165 |
0.388 |
|
A1 |
D4 |
0.444 |
0.482 |
0.038 |
0.081 |
|
A1 |
D6 |
0.559 |
0.568 |
0.009 |
0.018 |
|
A2 |
C1 |
0.224 |
0.289 |
0.066 |
0.200 |
|
A2 |
D2 |
0.422 |
0.485 |
0.063 |
0.137 |
|
A2 |
D5 |
0.260 |
0.315 |
0.055 |
0.152 |
|
A3 |
D5 |
0.260 |
0.431 |
0.171 |
0.371 |
|
A3 |
D3 |
0.663 |
0.777 |
0.114 |
0.213 |
|
A3 |
C1 |
0.224 |
0.272 |
0.048 |
0.116 |
|
B1 |
D7 |
0.224 |
0.662 |
0.438 |
0.244 |
|
B3 |
D6 |
0.559 |
0.685 |
0.126 |
0.063 |
|
B4 |
D2 |
0.422 |
0.589 |
0.166 |
0.075 |
|
B4 |
D6 |
0.559 |
0.620 |
0.061 |
0.027 |
|
B7 |
D6 |
0.559 |
0.765 |
0.206 |
0.185 |
3.4 Robustness of the results
Repeated five-fold cross-validation showed limited sensitivity to the Beta smoothing parameter. Mean negative log-likelihood per variable and case was 0.5269 for α = 0.5, 0.5255 for α = 1.0, and 0.5251 for α = 2.0. The small differences indicate that predictive performance was not strongly dependent on smoothing strength.
Bootstrap resampling showed moderate overall stability of the association-derived structure. Across the 58 factor pairs in the central solution, the median bootstrap retention frequency was 0.724, with an interquartile range of 0.602-0.887. Twenty-two associations were retained in at least 80% of bootstrap samples, 14 in at least 90%, and 11 in at least 95%. After orientation and transitive reduction, bootstrap networks contained an average of 21.18 direct edges compared with 24 in the full-sample network. Highly retained edges included C1 → A2 (1.000), D5 → A2 (1.000), D6 → D2 (0.998), D3 → A1 (0.997), and D6 → B7 (0.983), whereas D5 → C2 (0.521), C1 → A3 (0.524), D2 → B4 (0.525), E2 → D4 (0.551), and D3 → B5 (0.555) were more sample-sensitive.
The bootstrap distributions also differentiated stable from uncertain diagnostic relationships (Table 4). D3 remained the leading antecedent for A1 in all 1,000 replicates, with a 95% interval of 0.095-0.235 for Δdiag. For A3, D5 had an interval of 0.105-0.242 and ranked first in 87.2% of replicates, while D3 remained positive with an interval of 0.047-0.173. D7-B1 and D6-B7 were also consistently positive. In contrast, the intervals for D6-B3 and D2-B4 crossed zero, indicating greater sampling uncertainty.
Table 4. Bootstrap stability of principal diagnostic relationships
|
Target |
Antecedent |
Δdiag |
95% Bootstrap Interval |
P(Δdiag > 0) |
Top-1 Frequency |
|
A1 |
D3 |
0.165 |
0.095-0.235 |
1.000 |
1.000 |
|
A2 |
C1 |
0.066 |
0.019-0.113 |
0.998 |
0.385 |
|
A2 |
D2 |
0.063 |
0.001-0.130 |
0.975 |
0.346 |
|
A2 |
D5 |
0.055 |
-0.004-0.108 |
0.967 |
0.264 |
|
A3 |
D5 |
0.171 |
0.105-0.242 |
1.000 |
0.872 |
|
A3 |
D3 |
0.114 |
0.047-0.173 |
1.000 |
0.127 |
|
B1 |
D7 |
0.438 |
0.212-0.631 |
1.000 |
1.000 |
|
B3 |
D6 |
0.126 |
-0.053-0.294 |
0.913 |
1.000 |
|
B4 |
D2 |
0.166 |
-0.033-0.379 |
0.951 |
0.951 |
|
B7 |
D6 |
0.206 |
0.077-0.329 |
0.995 |
1.000 |
4.1 Hierarchical organization of accident-causation factors
The directed ISM reveals a differentiated organization of accident-causation factors across the five levels. D6 and E2 occupy the deepest level, while D4, D3, and D8 connect broad organizational deficiencies with more specific management, behavioral, and physical factors. Most A- and B-category factors are concentrated toward the result side of the hierarchy. This configuration is broadly consistent with the 24Model, in which unsafe actions and unsafe conditions represent more immediate manifestations of accident causation, whereas organizational and safety-management deficiencies operate at deeper levels [14-16]. The resulting hierarchy is therefore best interpreted as a dependency structure rather than a deterministic causal chain.
The position of D3 is particularly informative. Inadequate third-party work control occupies an intermediate management level and is connected downstream with third-party damage, communication failure, and missing warning or marking conditions. Process-based third-party excavation models similarly represent pipeline damage through dependencies involving notification, facility records, locating, marking, and field control [9, 10]. The present structure therefore places D3 within a broader management-control process rather than treating third-party damage as an isolated event.
4.2 Target-specific diagnostic patterns
The Bayesian results show that dominant upstream relationships differ among the seven diagnostic targets. Third-party damage, communication failure, corrosion-related degradation, unsafe operation, and design/construction defects do not share a single universal antecedent. Instead, each accident manifestation is associated with a different combination of managerial, individual, and technical factors. This target-specific pattern suggests that prevention priorities should be organized around the dominant mechanisms of different accident modes rather than a single overall ranking of factor occurrence.
For A1, D3 exhibits a clear and highly stable diagnostic relationship, and the D3 → A1 edge is retained in almost all bootstrap samples. This result is consistent with natural-gas pipeline studies linking third-party damage to excavation-management and control processes [9-11]. For B1, D7 is the dominant diagnostic antecedent. Previous Bayesian research on externally corroded natural-gas pipelines has incorporated corrosion mechanisms, pipeline condition, and maintenance strategies within the same probabilistic framework [12]. The D7-B1 result therefore highlights maintenance and integrity management as an important dimension of corrosion-related accident cases.
A2 shows a different pattern: C1, D2, and D5 form a closely ranked antecedent group, and their internal ordering varies across bootstrap samples. This indicates that unsafe operation is associated with a combination of individual competence, hazard-control practice, and safety training rather than a single management deficiency. Recent oil and gas pipeline accident research similarly emphasizes the simultaneous involvement of human and organizational factors in accident development [13].
D6 has comparatively broad structural reach in the revised network and is connected directly or indirectly with several management-control nodes and multiple direct-cause targets. Its relationship with B7 is also bootstrap-stable. Rather than indicating that D6 is universally dominant, these results suggest that poor rule and responsibility implementation may function as a cross-cutting management condition influencing several more specific control processes, consistent with the multilevel organizational logic of the 24Model [14-16].
4.3 Methodological implications and robustness
A key feature of the framework is the separation of association discovery from structural orientation. Apriori identifies recurrent statistical relationships, whereas direction is constrained subsequently using accident-causation theory, process information, and engineering knowledge. This separation reduces the risk of interpreting conditional co-occurrence as causal precedence, a distinction that is fundamental in observational causal analysis [17].
The robustness analyses show that different components of the model have different levels of empirical stability. Confidence has the largest effect on the detailed rule set, while a subset of associations remains recurrent across parameter settings. Bootstrap analysis similarly shows that some directed relationships are highly stable whereas others are sensitive to sample composition. Greater evidential weight should therefore be assigned to relationships supported simultaneously by the full-sample structure, high bootstrap retention, and stable diagnostic updating. Bootstrap-based assessment of Bayesian-network features is particularly useful under limited samples [20].
Because the dataset contains accident cases only, the marginal node probabilities characterize factor activation within documented accidents rather than the probability that an operating pipeline will experience an accident. The principal probabilistic output is therefore target-specific evidence updating. This diagnostic use of BN is consistent with their general probabilistic formulation and with safety applications based on posterior or reverse inference [10, 18, 28].
4.4 Limitations and future research
Several limitations should be considered. First, the 150 cases constitute a purposively assembled accident dataset based on publicly available documentation rather than a probability sample of all urban gas pipeline operations in China. Differences in investigation depth, disclosure quality, and source availability may influence factor coding. A factor coded as 0 indicates that sufficient supporting evidence was not identified in the available material and does not necessarily demonstrate its objective absence from the accident process.
Second, the dataset contains accident cases but no matched non-accident operating observations. The model is therefore suitable for examining dependencies and diagnostic updating within accident cases but cannot estimate population-level accident incidence or absolute failure probability. Future studies could combine accident records with exposure data, normal-operation observations, and pipeline-segment operating histories to extend the framework toward predictive risk estimation.
Third, the retained directions are evidence-constrained structural relationships rather than experimentally identified causal effects. Residual uncertainty remains for some factor pairs, and several edges are sensitive to sample composition. Independent expert elicitation, temporally resolved accident sequences, and external datasets could provide further evaluation of structural orientation and generalizability. Sparse parent-state combinations also remain for several CPTs, particularly A2. Expanding the accident database and incorporating additional operational data would improve parameter estimation. For mechanisms with strong temporal characteristics, dynamic BN provide a natural extension and have already been applied to gas-pipeline risk evolution [11, 29].
This study developed an association-informed analytical framework integrating Apriori association mining, ISM, and Bayesian-network diagnosis to investigate the dependency patterns of urban gas pipeline accidents. Based on 150 accident cases in China from 2016 to 2025, 1,065 causation statements were consolidated into 24 factors under the 24Model and encoded as a 150 × 24 binary matrix. The framework links statistical association discovery with evidence-oriented structural interpretation and target-specific probabilistic diagnosis while incorporating threshold, parameter, and sampling-uncertainty analyses.
At the central Apriori thresholds, 62 directional rules corresponding to 58 unique factor pairs were identified. Independent directional assessment yielded 34 supported candidate relations, and transitive reduction produced a 24-edge dependency network with a five-level hierarchical structure. D6 and E2 were located at the deepest level, whereas most unsafe-action and unsafe-condition factors were concentrated toward the result side of the hierarchy. The structure indicates that broad organizational and management deficiencies are connected with accident manifestations through multiple intermediate management, behavioral, and physical-condition factors rather than through a single uniform pathway.
Bayesian diagnosis revealed clear differences among the seven direct-cause targets. D3 showed a strong and stable diagnostic relationship with third-party damage (A1); D5 and D3 were the principal antecedents associated with communication failure (A3); D7 exhibited the strongest diagnostic update for pipeline aging/corrosion (B1); and D6 showed a stable relationship with design/construction defects (B7). Unsafe operation (A2) differed from these patterns: C1, D2, and D5 formed a closely ranked antecedent group, indicating a more distributed combination of individual competence, hazard-control practice, and safety training.
Robustness analyses showed that the principal findings were more stable than several individual network relations. Threshold variation affected the detailed rule set, particularly through confidence, while bootstrap resampling identified both highly stable relationships and sample-sensitive edges. The network should therefore be interpreted as an evidence-based dependency representation whose individual relations have different levels of empirical support rather than as a fixed deterministic causal structure.
Overall, the framework provides a reproducible approach for converting heterogeneous accident-investigation information into structured association, hierarchical dependency, and probabilistic diagnostic evidence. Its principal value lies in identifying mode-specific upstream factors from documented accident cases rather than estimating an unconditional probability of accident occurrence. Future work incorporating normal-operation observations, exposure information, temporally resolved accident processes, and independent external datasets could extend the framework toward predictive risk assessment and stronger evaluation of structural generalizability.
The datasets used and/or analysed during the current study are available from the corresponding author on reasonable request.
[1] Li, F., Wang, W., Dubljevic, S., Khan, F., Xu, J., Yi, J. (2019). Analysis on accident-causing factors of urban buried gas pipeline network by combining DEMATEL, ISM and BN methods. Journal of Loss Prevention in the Process Industries, 61: 49-57. https://doi.org/10.1016/j.jlp.2019.06.001
[2] Ma, L., Cheng, L., Li, M. (2013). Quantitative risk analysis of urban natural gas pipeline networks using geographical information systems. Journal of Loss Prevention in the Process Industries, 26(6): 1183-1192. https://doi.org/10.1016/j.jlp.2013.05.001
[3] Qiu, Z., Liang, W., Zhang, L. (2018). Tracing and prediction analysis of an urban pipeline leakage accident based on the catastrophe DBN model. Journal of Natural Gas Science and Engineering, 57: 339-348. https://doi.org/10.1016/j.jngse.2018.07.019
[4] Chen, X.L., Huang, Z.H., Ge, F.L., Lin, W.D., Yang, F.Q. (2024). A probabilistic analysis method for evaluating the safety & resilience of urban gas pipeline network. Reliability Engineering & System Safety, 248: 110170. https://doi.org/10.1016/j.ress.2024.110170
[5] Li, S.Y., Huang, Z.H., Ge, F.L., Lin, W.D., Yang, F.Q. (2024). An emergency linkage system of urban gas pipeline network based on Bayesian network. Journal of Loss Prevention in the Process Industries, 92: 105493. https://doi.org/10.1016/j.jlp.2024.105493
[6] Zhou, Y., Fan, J., Dai, B., et al. (2025). Risk analysis of urban low-pressure natural gas networks based on hybrid dynamic Bayesian networks. Journal of Loss Prevention in the Process Industries, 96: 105649. https://doi.org/10.1016/j.jlp.2025.105649
[7] Hassan, S., Wang, J., Kontovas, C., Bashir, M. (2022). An assessment of causes and failure likelihood of cross-country pipelines under uncertainty using Bayesian networks. Reliability Engineering & System Safety, 218: 108171. https://doi.org/10.1016/j.ress.2021.108171
[8] Chis, T., Radulescu, R., Stoianovici, D., Vlădescu, R. (2023). A new model of oil pipeline (oleduct) risk assessment. International Journal of Safety and Security Engineering, 13(1): 175-185. https://doi.org/10.18280/ijsse.130120
[9] Ruiz-Tagle, A., Lewis, A.D., Schell, C.A., Lever, E., Groth, K.M. (2022). BaNTERA: A Bayesian network for third-party excavation risk assessment. Reliability Engineering & System Safety, 223: 108507. https://doi.org/10.1016/j.ress.2022.108507
[10] Zhu, B., Yang, X., Wang, J., et al. (2022). Third-party damage model of a natural gas pipeline based on a Bayesian network. Energies, 15(16): 6067. https://doi.org/10.3390/en15166067
[11] Hong, B., Shao, B., Guo, J., Fu, J., Li, C., Zhu, B. (2023). Dynamic Bayesian network risk probability evolution for third-party damage of natural gas pipelines. Applied Energy, 333: 120620. https://doi.org/10.1016/j.apenergy.2022.120620
[12] Li, Y.T., He, X.N., Shuai, J. (2022). Risk analysis and maintenance decision making of natural gas pipelines with external corrosion based on Bayesian network. Petroleum Science, 19(3): 1250-1261. https://doi.org/10.1016/j.petsci.2021.09.016
[13] Gong, Y., Xiong, Y. (2025). HFACS-OGP: An analysis framework for oil and gas pipeline accident causation. Journal of Loss Prevention in the Process Industries, 98: 105747. https://doi.org/10.1016/j.jlp.2025.105747
[14] Fu, G., Cao, J.L., Zhou, L., Xiang, Y.C. (2017). Comparative study of HFACS and the 24Model accident causation models. Petroleum Science, 14(3): 570-578. https://doi.org/10.1007/s12182-017-0171-4
[15] Lyu, Q., Fu, G., Wang, Y., et al. (2022). How accident causation theory can facilitate smart safety management: An application of the 24Model. Process Safety and Environmental Protection, 162: 878-890. https://doi.org/10.1016/j.psep.2022.04.068
[16] Wu, Y., Fu, G., Wu, Z., et al. (2023). A popular systemic accident model in China: Theory and applications of 24Model. Safety Science, 159: 106013. https://doi.org/10.1016/j.ssci.2022.106013
[17] Pearl, J. (2009). Causal inference in statistics: An overview. Statistics Surveys, 3: 96-146. https://doi.org/10.1214/09-SS057
[18] Zhang, Q.H., Zheng, S.Y. (2024). Causal analysis of accidents during wind power engineering construction using Bayesian networks. International Journal of Safety and Security Engineering, 14(1): 309-319. https://doi.org/10.18280/ijsse.140130
[19] Heckerman, D., Geiger, D., Chickering, D.M. (1995). Learning Bayesian networks: The combination of knowledge and statistical data. Machine Learning, 20(3): 197-243. https://doi.org/10.1007/BF00994016
[20] Broom, B.M., Do, K.A., Subramanian, D. (2012). Model averaging strategies for structure learning in Bayesian networks with limited data. BMC Bioinformatics, 13(Suppl 13): S10. https://doi.org/10.1186/1471-2105-13-S13-S10
[21] Fu, G., Xie, X., Jia, Q., Li, Z., Chen, P., Ge, Y. (2020). The development history of accident causation models in the past 100 years: 24Model, a more modern accident causation model. Process Safety and Environmental Protection, 134: 47-82. https://doi.org/10.1016/j.psep.2019.11.027
[22] Fu, G., Chen, Y., Xu, S., Chen, P., Yuan, C., Wu, Y. (2022). Detailed explanations of 24Model and development of its 6th version [in Chinese]. China Safety Science Journal, 32(1): 12-19. https://doi.org/10.16265/j.cnki.issn1003-3033.2022.01.002
[23] Fu, G., Lu, B., Chen, X.Z. (2005). Behavior-based model for organizational safety management [in Chinese]. China Safety Science Journal, 15(9): 21-27. https://doi.org/10.16265/j.cnki.issn1003-3033.2005.09.005
[24] Agrawal, R., Srikant, R. (1994). Fast algorithms for mining association rules in large databases. In Proceedings of the 20th International Conference on Very Large Data Bases (VLDB), Santiago de Chile, Chile, pp. 487-499.
[25] Hong, J., Tamakloe, R., Park, D. (2020). Application of association rules mining algorithm for hazardous materials transportation crashes on expressway. Accident Analysis & Prevention, 142: 105497. https://doi.org/10.1016/j.aap.2020.105497
[26] Sorooshian, S., Tavana, M., Ribeiro-Navarrete, S. (2023). From classical interpretive structural modeling to total interpretive structural modeling and beyond: A half-century of business research. Journal of Business Research, 157: 113642. https://doi.org/10.1016/j.jbusres.2022.113642
[27] Machado, P.G., de Oliveira Ribeiro, C., do Nascimento, C.A.O. (2023). Risk analysis in energy projects using Bayesian networks: A systematic review. Energy Strategy Reviews, 47: 101097. https://doi.org/10.1016/j.esr.2023.101097
[28] Hänninen, M. (2014). Bayesian networks for maritime traffic accident prevention: Benefits and challenges. Accident Analysis & Prevention, 73: 305-312. https://doi.org/10.1016/j.aap.2014.09.017
[29] Wang, Z., Gui, X., Wang, W., Zhao, X., Ji, X. (2025). Gas pipeline leakage risk analysis based on dynamic Bayesian network. Processes, 13(4): 927. https://doi.org/10.3390/pr13040927