Yasser Sahib Nassar*![]() | Ali Hasan. Hadi
| Ali Hasan. Hadi![]() | Ryad Tuma Hazem
| Ryad Tuma Hazem![]()
© 2025 The authors. This article is published by IIETA and is licensed under the CC BY 4.0 license (http://creativecommons.org/licenses/by/4.0/).
OPEN ACCESS
Construction projects face numerous risks that can impact success, particularly from the employer's perspective. This study applies the Fuzzy DEMATEL (FD) technique to enhance risk assessment by systematically identifying, analysing, and prioritising risks based on their causal relationships and interdependencies. Fuzzy logic helps address uncertainty, enhancing assessment accuracy. The study's importance lies in early risk assessment in the construction sector and identifying key threats to ensure cost control, schedule adherence, quality, and efficient performance. The study examines key risk factors and their sub-factors identified through literature review, brainstorming, and expert interviews. Nine industry experts from employers with over 15 years of experience contributed to the analysis. FD categorises risks into cause-and-effect groups, helping with targeted risk management. Key findings highlight force majeure, legal and contractual risks, and technical design as the primary causal factors most influential in the event. Critical secondary causal factors include political interference, religious events, natural disasters, corruption loopholes, lack of regulatory expertise, and ambiguous bid documents. By categorising risks based on causality, impact, and importance, the study provides managers with practical insights to mitigate risks and make proactive decisions.
construction management, construction risks, risk assessment, risk prioritization, Fuzzy DEMATEL
Risks play a crucial and significant role in the complex world of the construction industry, where their inherent uncertainty can have significant and far-reaching impacts on the overall performance of various projects [1]. The ultimate success of construction projects depends primarily on the quality and robustness of the associated risk management strategies implemented throughout the project duration [2]. Therefore, it is essential for any method adopted in this broad field to be able to efficiently and effectively identify, assess, and manage the various risk elements associated with different phases of various construction projects [3].
A construction project can be viewed as risky, as the various risk elements present during the implementation phase are likely to impact project objectives significantly [4]. These objectives typically include critical aspects such as the initial budget, expected construction timeframe, and quality, which have been mutually agreed upon by all stakeholders [5]. Therefore, it is essential to have consistent, comprehensive, and effective methods used to identify, assess, and address risks throughout this inherently dynamic and multifaceted process [6]. Many sophisticated techniques and tools have been developed specifically for effective project risk management; however, it is crucial for practitioners in this field to make the necessary adjustments to relevant construction processes and tools to remain current and effective [4]. Among these tools, the Decision Experiment and Evaluation Laboratory, commonly referred to as DEMATEL, stands out as a powerful and highly sophisticated mathematical tool designed for use by researchers, policymakers, and industry professionals alike [7]. FD was specifically developed to skillfully manage the inherent ambiguity associated with human cognitive processes, particularly when it comes to the implications and interpretations of risks. This approach makes it exceptionally effective for civil engineering practitioners, project owners, and investors seeking to understand the complex interactions of risk elements related to construction projects [8]. Furthermore, the FD model for the construction industry provides a more accurate development of Risk Priority Scores (RPS), moving beyond the simplistic use of frequency indices and relying solely on the judgment skills of experts in the field. This advanced methodology ensures a more comprehensive understanding of risks, enhancing decision-making processes, and ultimately improving project outcomes [8]. Therefore, the use of the FD method can be considered an exceptionally useful and beneficial approach for construction industry professionals, including project managers, contractors, engineers, and investors alike, seeking to navigate the complexities of risk [9]. This research aims to provide a comprehensive and detailed review of current research efforts in the relevant area of risk analysis within construction projects, complementing this examination with the development and experimental testing of a fuzzy synthetic model (FSM) specifically designed for risk assessment within the civil engineering sector [10].
The following are the main points of the objectives, importance, and hypothesis of the research study.
2.1. Objectives of the study
Identifying, classifying, and assessing construction project risks enables project owners to obtain important information to improve risk management. Therefore, a systematic model was developed to achieve the following three objectives:
1. Select risk factors from a systematic perspective for risk assessment in construction.
2. Develop a hierarchical structure that illustrates the relationships between risk factors, thereby constructing a decision-making matrix that forms the core of the FD model. Alternatively, analyze the causal relationships between these risks using the FD technique.
3. Adopt the FD technique to explore the causal relationships of the risk factors identified during the previous steps to draw insights for enhancing construction risk management for projects.
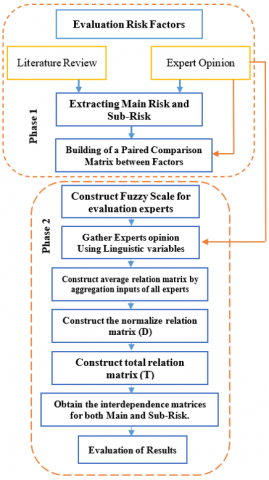
Figure 1. Methodology for analyzing and evaluating the main and sub-risk factors
2.2. Importance of the study
In practical practice, front-line construction decision makers identify the most relevant construction risks to the workflow in terms of cost, time, and quality. A multidimensional framework is created based on construction-related risks by classifying risks from three aspects: sector, phase, and criteria. Thus, the risks are identified as having a significant impact from the owner's perspective. Although the project has been awarded to a qualified contractor, the results of this investigation clearly inform the owner that they need to implement risk control measures to mitigate these risks.
The primary objective of the study is to analyze and evaluate the main and sub-factors of construction risks. The study population consists of five construction project management specialists (experts). This study also relies on the experts' perspectives on the project and risk management model. Based on the standard process for assessing risk factors, the researcher used the FD method to identify the main points of the research study, examine the internal causal relationships between the main and sub-criteria, and determine the weights of these criteria. Figure 1 illustrates the proposed methodology for applying the FD method to analyze and evaluate the main and sub-criteria in the model for analyzing and evaluating various risk factors.
FD is a highly regarded and widely used analytical tool, particularly in the critical and important area of risk identification in construction projects [11]. As a key component of a hybrid analytical framework, it plays a key role during the comprehensive processes of risk analysis, in-depth assessment, and the development of robust risk responses. The impressive effectiveness of FD is primarily due to its remarkable ability to clearly and concisely define and articulate the construction project life cycle [12]. This clarity is crucial to ensuring effective project implementation and overall management [13]. This is achieved through precise life cycle segmentations, considering the various domains and multiple aspects inherent in construction projects [14, 15]. This detailed analysis allows for precise prioritisation and the critical importance of different phases throughout the entire project life cycle [16]. Many rigorous and well-conducted studies have been conducted to enhance and expand the FD application framework, especially when specifically designed for the construction sector, which is characterized by its many nuances and complexities [11]. It is worth noting that among the various fields discussed and explored, the construction industry has received particular emphasis and focused attention from both researchers and practitioners.
Furthermore, the growing acceptance of FD from an owner's perspective is noteworthy and significant, as more researchers have begun to integrate this analytical tool into their specific application areas across various sectors, enhancing its utility and relevance [17]. The various scholars surveyed expressed their diverse perspectives regarding this growing acceptance in various ways [18]. Each author adhered to core concepts such as setting clear boundaries, acknowledging limitations within their studies, and employing some form of validation, while also leveraging diverse methodologies across their research endeavors to strengthen findings and conclusions [19]. Table 1 shows a summary of previous studies on the use of FD technology in assessing risk factors.
Table 1. Summarizes previous studies on the use of FD technology in assessing risk factors
|
Authors (Ref.) |
Study |
Focus |
Key Findings |
|
Zhu et al. [20] |
Risk Assessment Model for ICP |
Interdependence of risks |
Proposed a model considering interdependence among risks using FD. |
|
Sun et al. [21] |
Risk Factors in Healthcare Construction |
Cost overruns in healthcare projects |
Investigated risk factors contributing to cost overruns and their impacts. |
|
Muianga et al. [22] |
Risk of Design Change |
Design change risks |
Identified factors inducing design change risks across six aspects. |
|
Yu and Ma [23] |
Causal Relationships of Safety Program Factors |
Safety in construction projects |
Evaluated causal relationships of safety factors using Fuzzy DEMATEL. |
|
Abeysekara [24] |
Risk Assessment in Persian Gulf Bridge Project |
Risk assessment in megaprojects |
Applied Fuzzy DEMATEL for risk assessment in a major bridge project. |
|
Hatefi and Tamošaitienė [25] |
Integrated Fuzzy DEMATEL-Fuzzy ANP Model |
Evaluating construction projects |
Proposed an integrated model for assessing risk factors and prioritizing projects based on interrelations. |
|
Seker and Zavadskas [26] |
Systematic Risk Assessment Methodology |
Occupational hazards |
Developed a systematic methodology combining fuzzy theory and DEMATEL for assessing occupational hazards. |
Table 2. Shows the main and sub-risk criteria for construction project risks and their descriptions
|
Main Risk |
Sub-Risks |
Description |
|
A: Financial Risks |
A1: Cost Overruns [40] |
Unplanned increases in project costs or Rising material costs due to global supply chain disruptions |
|
A2: Budget Misallocation [41] |
Poor allocation of funds across project phases. |
|
|
A3: Funding Delays [42, 43] |
Delays in securing financing or cash flow issues or Late payment by the owner |
|
|
A4: Inflation [40, 43] |
Rising costs of materials and labor or Inflation and interest rate hikes |
|
|
A5: Financial failure of the contractor [44] |
Financial failure by a contractor occurs when they are unable to meet their financial obligations, leading to project delays, cost overruns, or even abandonment. |
|
|
A6: Inaccurate cost estimates [45] |
Inaccurate cost estimates occur when project budgets are not aligned with actual expenses, leading to financial shortfalls, scope reductions, or project delays. |
|
|
A7: Currency Fluctuations [40, 46] |
For projects involving international transactions or Crypto currency or block chain-based payment risks. |
|
|
B: Schedule Risks |
B1: Delays in project timelines [41, 42, 47] |
Unreasonably tight schedule |
|
B2: Poor planning and scheduling [46] |
Inadequate planning leading to delays or cost overruns |
|
|
B3: Unforeseen site conditions [41, 48] |
Discovery of archaeological sites or contaminated land |
|
|
B4: Delays in material delivery [48] |
Delays or failures in the supply chain |
|
|
B5: Delays in permits [41] |
Delays due to remote work inefficiencies in planning teams. |
|
|
B6; Lack of labor, materials and equipment [46, 49, 50] |
Lack of skilled workers or high turnover rates or Skilled labor shortages due to aging workforce. |
|
|
C: Quality Risks |
C1: Non-compliance with specifications [51] |
Non-compliance with specifications refers to the failure of a structural element, system, or material to meet the prescribed design, construction, or performance standards as outlined in relevant codes, standards. |
|
C2: Poor workmanship [52] |
Poor workmanship refers to the potential for defects, failures, or safety hazards in a construction project due to substandard quality of work by contractors, laborers, or subcontractors |
|
|
C3: Use of substandard materials [52] |
Use of recycled or alternative materials with inconsistent quality |
|
|
C4: Inadequate quality control processes [53] |
Inadequate training on new construction technologies or Weak oversight by regulatory authorities |
|
|
C5: Failure to meet regulatory standards [51] |
the failure of a structural system, component, or material to adhere to the legally mandated codes, regulations, and standards established by governing bodies. |
|
|
D: Stakeholder and Communication Risks |
D1: Poor Communication Between Project Teams or with Clients [54-56] |
Poor communication occurs when information is not effectively shared, understood, or acted upon between project teams or with clients. |
|
D2: Conflicting stakeholder interests [57] |
A conflict of interest arises when a stakeholder’s personal or professional interests interfere with their ability to make impartial decisions for the project. |
|
|
D3: Lack of stakeholder engagement [58] |
Lack of stakeholder engagement occurs when key stakeholders are not actively involved or consulted during the project lifecycle. |
|
|
D4: Poor decision-making processes [59] |
Poor decision-making processes occur when stakeholders lack the necessary information, expertise, or frameworks to make informed and timely decisions. |
|
|
D5: Poor communication [57] |
Poor communication between head offices and field offices |
|
|
E: Legal and Contractual Risks |
E1: Litigation [60, 61] |
Refers to the potential for legal disputes arising during or after a construction project. These disputes can involve contractors, subcontractors, owners, designers, suppliers, or other stakeholders, and they often stem from issues such as contract breaches, delays, cost overruns, defects, or safety incidents. |
|
E2: Contract Disputes |
Conflicts with contractors, suppliers, or stakeholders. |
|
|
E3: Regulatory Non-Compliance [62] |
Failure to meet legal or regulatory requirements or GDPR and data privacy regulations for project data. |
|
|
E4: absence of project anti-corruption systems (Bri., Exp.) |
absence of project anti-corruption systems in government departments. |
|
|
E5: The organization's lack of experience in evaluating bids (Bri., Exp.) |
refers to the potential negative impacts on a construction project due to the organization's inability to effectively assess and select contractors or vendors during the bidding process. |
|
|
E6: Deliberate ambiguity in the tender documents (Bri., Exp.) |
Deliberate ambiguity in the tender documents in order to open the way for making change orders during implementation for the benefit of the contractor |
|
|
F: Technical and Design Risks |
F1: Design errors or Domissions or Change design (Bri., Exp..) |
Flaws in project design leading to rework or Adoption of AI-driven design tools with potential errors |
|
F2: Poor estimates [42, 43] |
Poor estimates/inaccurate quantities or Difference between actual and contracted quantities |
|
|
F3: Insufficient or inconsistent design documents [42, 58] |
Inconsistency between bills of quantities, drawings and specifications or Over-reliance on BIM without proper validation |
|
|
F4: Technology failures or obsolescence (Bri., Exp.) |
Malfunctioning equipment or software. |
|
|
F5: Construction Defects [58] |
poor workmanship or material quality |
|
|
F6: Scope Creep [62] |
the gradual and uncontrolled expansion of a project's scope, often through the addition of new features, tasks, or requirements that were not part of the original project plan. |
|
Main Risk |
Sub-Risks |
Description |
|
G: Force Majeure and External Risks |
G1: Natural disasters (e.g., earthquakes, floods) [42, 46, 63] |
bad weather conditions, Acts of God (floods, earthquakes, heavy rains, etc.) |
|
G2: Pandemics or health crises [64, 65] |
Health crises disrupting labor or COVID-19 or future pandemics impacting workforce availability |
|
|
G3: Political instability or war [42, 63] |
Changes in government policies or regulations |
|
|
G4: Economic downturns [66] |
An economic downturn refers to a period of reduced economic activity, characterized by declining GDP, reduced consumer spending, lower investment levels, and increased unemployment. |
|
|
G5: Changes in government policies [67] |
Shifts in infrastructure spending priorities due to elections |
|
|
G6: Corruption and bribery [68] |
Corruption and bribery in government departments |
|
|
G7: Political party interference (political quotas) (Bri., Exp..) |
Their implementation can sometimes lead to political party interference, where parties manipulate quota systems to serve their own interests rather than promoting genuine inclusivity. |
|
|
G8: Religious occasions (Bri.., Exp..) |
Such as festivals, pilgrimages, and holy days—can pose various risks when intersecting politics, governance, or social dynamics. |
|
|
H: Environmental and Regulatory Risks |
H1: Non-compliance with environmental regulations [69] |
It occurs when an organization fails to adhere to laws, standards, or guidelines set by governmental or regulatory bodies to protect the environment. |
|
H2: Poor safety procedures [42, 70] |
Inadequate safety measures can lead to workplace accidents, injuries, or fatalities, resulting in legal liabilities, financial losses, and damage to employee morale and company reputation. |
|
|
H3: Changes in regulatory requirements [70-72] |
Stricter carbon emission regulations or Regulatory landscapes are evolving rapidly, particularly in areas like climate change, data privacy, and labor laws. |
|
|
H4: Environmental damage or pollution [73] |
Activities that result in environmental harm, such as air or water pollution, deforestation, or soil contamination, can lead to severe consequences, including legal action, cleanup costs, and loss of public trust |
The role of the construction project owner in risk assessment cannot be underestimated and is vital during the assessment process [27]. Project owners have always been on the more extreme side of the risk triangle [28]. Project owners always seek solutions to threats that may arise in projects. The responsibility for construction projects, the financial implications, and project implementation within the assumed scope, time, and budget must be considered from the project owner's perspective [29]. Due to contractual and ownership conditions, project owners are required to experience the greatest degree of risk. Therefore, construction project risk assessment and construction project risk management strategies must be evaluated from the project owner's perspective, and decisions must be made with caution [30].
Understanding the perceptions of a particular discipline is also more effective in enhancing the decision-making process. As a result of this basic perception, an industry-focused case study is conducted that is relevant to the discipline [31]. Efforts are being made to expand this perception based on the details of the discussion. Involving the project owner in risk assessment enhances the accountability and transparency embedded in projects [32]. As a precautionary measure, the severity level of risks encountered throughout the project was assessed through consultation with project stakeholders [33].
Furthermore, the third step of the contracting process was reviewed based on the acquired empirical results [34]. Finally, project risk management practices were proposed, identified, and concluded through standard procedures. It aims to illustrate the great importance of providing partnership in the early stages through risk management strategies that emerged as a result of the assessment from the project owner's perspective and their feasibility in terms of project sustainability and any potential budget expansion.
It is very important to understand the owner's perspective when analyzing risks in construction projects, as the owner's criteria have the highest level of influence on all other decisions [35]. Neither innovative design nor high-quality construction can achieve the success the project owner aspires to (reducing project duration, reducing project costs determined by cost criteria, technical performance resulting from performance and equipment criteria, and ensuring good reception and serviceability in future periods) [36]. All of these criteria and sub-criteria are closely related to financial resources: payment terms based on absolute availability of funds, liquidation efficiency at the auction date, and availability of funds determined by the availability criterion; guarantee and geographical location of the participant arising from the participant criteria; market share in the sector and fixed criteria determined by the market share criteria; and guarantee of completion, buyback upon completion, and compensation in case of liquid damages determined by legal and additional criteria [37].
However, no traditional approach has been considered from the owner's perspective. Furthermore, many of the owner's criteria only indirectly affect the construction process (influencing project design criteria such as building size, scope of work to be completed, and planned completion date; choosing a tendering method such as open bidding or prequalification) [38]. Therefore, it is essential to clearly define the criteria that govern the owner's decision in some section, as the most rational choices from the contractor's perspective can be irrational from the owner's perspective [39]. Table 2 shows the main and sub-risk criteria, their descriptions, and their sources. Therefore, the purpose of this section is to discuss the owner's criteria that determine decisions, identify the main criteria and associated sub-criteria, and catalogue the associated risks. Note that some secondary or sub-criteria were identified by the researcher through brainstorming (Br..) or experts interviews (Ex..) involved in construction project management.
FD is an extension of the traditional DEMATEL method, which is used to analyze and visualize causal relationships between complex factors in a system [74]. FD incorporates fuzzy logic to address the uncertainty and ambiguity inherent in human judgments, making it more suitable for real-world decision-making problems where information is often imprecise [75]. In the FD approach, experts make their judgments using linguistic terms (e.g.,“very high impact,” “low impact”) that are then converted into fuzzy numbers. These fuzzy numbers are processed to create a straightforward relationship matrix, which is subsequently defuzzified to yield clear values. The final step involves calculating cause-and-effect relationships between factors, identifying influencing factors (causes) and affected factors (effects). This method is particularly useful in fields such as supply chain management, environmental sustainability, and risk assessment, where decision-making involves multiple criteria and uncertain data.
8.1 Statical analysis
The questionnaire was divided into two main sections. This step aims to simplify and facilitate the questionnaire results, as shown below:
Part One: Personal Information
Nine experts from employers and the public and private sectors studied the main and sub-criteria of construction project risks in the construction sector before applying this approach. The sample was selected from different age groups and varying levels of professional experience (Above 15 years) to reflect their level of expertise and responsibilities. The assessors shared their opinions about their knowledge, experience, and skills. Table 3 shows the details of the experts.
Table 3. Profile of the experts
|
|
Years of Experience |
Sector |
Age Range |
|||||
|
Description |
15-20 years |
21-29 years |
Above 30 years |
Puplic |
Private |
35-49 |
50-59 |
60-65 |
|
Number |
2 |
3 |
4 |
5 |
4 |
3 |
3 |
3 |
|
Percentage |
22% |
33% |
44% |
55% |
44% |
33% |
33% |
33% |
Table 4. Fuzzy scale for pairwise comparison of evaluation criteria
|
(Crisp Value) Code |
Degree of Influence |
Linguistic Terms |
Fuzzy Value (TFNs) |
||
|
L |
M |
U |
|||
|
1 |
No influence |
No |
0 |
0 |
0.25 |
|
2 |
Very low influence |
VL |
0 |
0.25 |
0.5 |
|
3 |
Low influence |
L |
0.25 |
0.5 |
0.75 |
|
4 |
High influence |
H |
0.5 |
0.75 |
1 |
|
5 |
Very high influence |
VH |
0.75 |
1 |
1 |
Part Two: Creating the Fuzzy Direct Relationship Matrix
An n*n matrix is first constructed to define the model of relationships between the n criteria. A fuzzy number can be used in this matrix to show the effect of each element in each row on each element in each column. If more than one expert opinion is required, all experts are asked to complete the matrix. The z-direct relationship matrix is constructed using the arithmetic mean of all expert ratings. Table 4 shows the fuzzy measure for comparing evaluation criteria in pairs. Table 4 shows the fuzzy measure used in the model.
Part Three: Analysis and Evaluation of the Main and Sub-Risk Factors of Construction Projects
(1) Analysis and Evaluation of Main Criteria for Construction Risks
To obtain the results of the FD model, the researcher identified a set of key steps necessary to analyze and evaluate the key criteria, as follows:
Step 1: Identifying the main criteria for the proposed model for all criteria: The researcher compiled diverse literature on the key and sub-risks from the owner's perspective, as shown in Table 2.
Step 2: Before formulating this approach, five evaluators working in project management evaluated the model for the key and sub-criteria. Their diverse expertise in project management, particularly risk, was utilized. Finally, the key and sub-criteria for the various risks were extracted.
Step 3: The evaluators used a five-point scale (see Table 4) with no impact, very low impact, medium impact, strong impact, and very high impact as categories.
Step 4: Linguistic variables were used to conduct pairwise comparisons, which were then converted to a numerical scale from 1 to 5 using the scale shown in Table 4. Table 4 shows the average numerical scores of the evaluators' opinions. Using the fuzzy scale shown in Table 4, a first matrix of direct relationships was created. Table 5 shows the direct relationship matrix for the average of the five respondents' opinions. Table 6 shows the direct relationship matrix (levels of the main stages of the crisis).
Table 5. Linguistic evaluation of an expert's opinion
|
Main Risk |
A |
B |
C |
D |
E |
F |
G |
H |
|
A |
1 |
|
|
|
|
|
|
|
|
B |
|
1 |
|
|
|
|
|
|
|
C |
|
|
1 |
|
|
|
|
|
|
D |
|
|
|
1 |
|
|
|
|
|
E |
|
|
|
|
1 |
|
|
|
|
F |
|
|
|
|
|
1 |
|
|
|
G |
|
|
|
|
|
|
1 |
|
|
H |
|
|
|
|
|
|
|
1 |
Table 6. The direct relation matrix (average of the five respondents' opinions)
|
|
A |
B |
C |
D |
E |
F |
G |
H |
|
A |
(0.000,0.000,0.00) |
(0.750,1.000,1.00) |
(0.400,0.650,0.90) |
(0.250,0.500,0.75) |
(0.150,0.400,0.65) |
(0.250,0.500,0.75) |
(0.150,0.400,0.65) |
(0.000,0.250,0.50) |
|
B |
(0.350,0.600,0.85) |
(0.000,0.000,0.00) |
(0.150,0.400,0.65) |
(0.250,0.500,0.75) |
(0.400,0.650,0.90) |
(0.350,0.600,0.85) |
(0.100,0.350,0.60) |
(0.000,0.100,0.35) |
|
C |
(0.000,0.250,0.50) |
(0.000,0.250,0.50) |
(0.000,0.000,0.00) |
(0.100,0.350,0.60) |
(0.250,0.500,0.75) |
(0.350,0.600,0.85) |
(0.100,0.350,0.60) |
(0.000,0.100,0.35) |
|
D |
(0.300,0.550,0.80) |
(0.400,0.650,0.90) |
(0.250,0.500,0.75) |
(0.000,0.000,0.00) |
(0.300,0.550,0.80) |
(0.250,0.500,0.75) |
(0.100,0.350,0.60) |
(0.000,0.250,0.50) |
|
E |
(0.250,0.500,0.75) |
(0.250,0.500,0.75) |
(0.250,0.500,0.75) |
(0.350,0.600,0.85) |
(0.000,0.000,0.00) |
(0.250,0.500,0.75) |
(0.650,0.900,1.00) |
(0.600,0.850,1.00) |
|
F |
(0.600,0.850,1.00) |
(0.650,0.900,1.00) |
(0.400,0.650,0.90) |
(0.350,0.600,0.85) |
(0.400,0.650,0.90) |
(0.000,0.000,0.00) |
(0.250,0.500,0.75) |
(0.250,0.500,0.75) |
|
G |
(0.750,1.000,1.00) |
(0.600,0.850,1.00) |
(0.650,0.900,1.00) |
(0.350,0.600,0.85) |
(0.750,1.000,1.00) |
(0.650,0.900,1.00) |
(0.000,0.000,0.00) |
(0.500,0.750,1.00) |
|
H |
(0.000,0.250,0.50) |
(0.000,0.250,0.50) |
(0.250,0.500,0.75) |
(0.100,0.350,0.60) |
(0.300,0.550,0.80) |
(0.000,0.250,0.50) |
(0.250,0.500,0.75) |
(0.000,0.000,0.00) |
Table 7. The fuzzy direct-relation matrix, normalized
|
|
A |
B |
C |
D |
E |
F |
G |
H |
|
A |
(0.000,0.000,0.00) |
(0.109,0.146,0.15) |
(0.058,0.095,0.131) |
(0.036,0.073,0.109) |
(0.022,0.058,0.095) |
(0.036,0.073,0.109) |
(0.022,0.058,0.095) |
(0.000,0.036,0.073) |
|
B |
(0.051,0.088,0.12) |
(0.00,0.000,0.000) |
(0.022,0.058,0.095) |
(0.036,0.073,0.109) |
(0.058,0.095,0.131) |
(0.051,0.088,0.124) |
(0.015,0.051,0.088) |
(0.000,0.015,0.051) |
|
C |
(0.00,0.036,0.073) |
(0.00,0.036,0.073) |
(0.000,0.000,0.000) |
(0.015,0.051,0.088) |
(0.036,0.073,0.109) |
(0.051,0.088,0.124) |
(0.015,0.051,0.088) |
(0.000,0.015,0.051) |
|
D |
(0.044,0.080,0.117) |
(0.058,0.095,0.13) |
(0.036,0.073,0.109) |
(0.000,0.000,0.000) |
(0.044,0.080,0.117) |
(0.036,0.073,0.109) |
(0.015,0.051,0.088) |
(0.000,0.036,0.073) |
|
E |
(0.036,0.073,0.19) |
(0.03,0.073,0.109) |
(0.036,0.073,0.109) |
(0.051,0.088,0.124) |
(0.000,0.000,0.000) |
(0.036,0.073,0.109) |
(0.095,0.131,0.146) |
(0.088,0.124,0.146) |
|
F |
(0.088,0.124,0.146) |
(0.09,0.131,0.146) |
(0.058,0.095,0.131) |
(0.051,0.088,0.124) |
(0.058,0.095,0.131) |
(0.000,0.000,0.000) |
(0.036,0.073,0.109) |
(0.036,0.073,0.109) |
|
G |
(0.109,0.146,0.16) |
(0.08,0.124,0.146) |
(0.095,0.131,0.146) |
(0.051,0.088,0.124) |
(0.109,0.146,0.146) |
(0.095,0.131,0.146) |
(0.000,0.000,0.000) |
(0.073,0.109,0.146) |
|
H |
(0.00,0.036,0.073) |
(0.00,0.036,0.073) |
(0.036,0.073,0.109) |
(0.015,0.051,0.088) |
(0.044,0.080,0.117) |
(0.000,0.036,0.073) |
(0.036,0.073,0.109) |
(0.000,0.000,0.000) |
Table 8. The fuzzy total-relation matrix
|
|
A |
B |
C |
D |
E |
F |
G |
H |
|
A |
(0.018,0.092,0.347) |
(0.124,0.232,0.490) |
(0.072,0.179,0.478) |
(0.049,0.149,0.437) |
(0.041,0.153,0.455) |
(0.054,0.158,0.450) |
(0.032,0.131,0.406) |
(0.008,0.096,0.355) |
|
B |
(0.065,0.166,0.449) |
(0.021,0.095,0.353) |
(0.037,0.139,0.439) |
(0.049,0.143,0.428) |
(0.072,0.174,0.474) |
(0.063,0.162,0.452) |
(0.027,0.120,0.392) |
(0.011,0.076,0.332) |
|
C |
(0.011,0.102,0.359) |
(0.011,0.108,0.370) |
(0.009,0.066,0.302) |
(0.022,0.107,0.363) |
(0.045,0.137,0.405) |
(0.057,0.144,0.403) |
(0.022,0.105,0.348) |
(0.008,0.064,0.292) |
|
D |
(0.057,0.160,0.448) |
(0.074,0.181,0.474) |
(0.050,0.153,0.456) |
(0.012,0.076,0.334) |
(0.058,0.164,0.468) |
(0.050,0.151,0.445) |
(0.025,0.121,0.397) |
(0.009,0.094,0.353) |
|
E |
(0.061,0.179,0.487) |
(0.063,0.188,0.503) |
(0.062,0.181,0.505) |
(0.068,0.178,0.489) |
(0.030,0.119,0.413) |
(0.059,0.175,0.491) |
(0.108,0.212,0.487) |
(0.100,0.193,0.454) |
|
F |
(0.108,0.226,0.532) |
(0.121,0.244,0.549) |
(0.081,0.202,0.538) |
(0.070,0.182,0.504) |
(0.083,0.207,0.545) |
(0.025,0.111,0.408) |
(0.053,0.164,0.471) |
(0.049,0.146,0.434) |
|
G |
(0.139,0.275,0.573) |
(0.127,0.271,0.591) |
(0.127,0.265,0.593) |
(0.079,0.210,0.544) |
(0.143,0.283,0.601) |
(0.124,0.258,0.577) |
(0.029,0.125,0.411) |
(0.092,0.203,0.499) |
|
H |
(0.009,0.104,0.368) |
(0.009,0.109,0.380) |
(0.045,0.138,0.413) |
(0.021,0.110,0.373) |
(0.053,0.148,0.424) |
(0.010,0.103,0.372) |
(0.043,0.128,0.377) |
(0.008,0.051,0.252) |
Table 9. The crisp total-relation matrix
|
|
A |
B |
C |
D |
E |
F |
G |
H |
|
A |
0.134 |
0.263 |
0.221 |
0.192 |
0.198 |
0.201 |
0.171 |
0.137 |
|
B |
0.207 |
0.137 |
0.185 |
0.186 |
0.219 |
0.205 |
0.161 |
0.118 |
|
C |
0.142 |
0.149 |
0.105 |
0.147 |
0.179 |
0.184 |
0.143 |
0.102 |
|
D |
0.202 |
0.222 |
0.198 |
0.119 |
0.209 |
0.195 |
0.162 |
0.135 |
|
E |
0.221 |
0.23 |
0.226 |
0.22 |
0.166 |
0.219 |
0.244 |
0.227 |
|
F |
0.263 |
0.28 |
0.246 |
0.225 |
0.252 |
0.159 |
0.205 |
0.187 |
|
G |
0.302 |
0.302 |
0.299 |
0.249 |
0.315 |
0.291 |
0.168 |
0.238 |
|
H |
0.145 |
0.151 |
0.181 |
0.151 |
0.191 |
0.146 |
0.166 |
0.085 |
Table 10. By taking into account the threshold value, the crisp total-relationships matrix is created
|
|
A |
B |
C |
D |
E |
F |
G |
H |
|
A |
0 |
0.263 |
0.221 |
0 |
0.198 |
0.201 |
0 |
0 |
|
B |
0.207 |
0 |
0 |
0 |
0.219 |
0.205 |
0 |
0 |
|
C |
0 |
0 |
0 |
0 |
0 |
0 |
0 |
0 |
|
D |
0.202 |
0.222 |
0.198 |
0 |
0.209 |
0 |
0 |
0 |
|
E |
0.221 |
0.23 |
0.226 |
0.22 |
0 |
0.219 |
0.244 |
0.227 |
|
F |
0.263 |
0.28 |
0.246 |
0.225 |
0.252 |
0 |
0.205 |
0 |
|
G |
0.302 |
0.302 |
0.299 |
0.249 |
0.315 |
0.291 |
0 |
0.238 |
|
H |
0 |
0 |
0 |
0 |
0 |
0 |
0 |
0 |
Table 11. The final output
|
Main Risk |
Code |
D |
R |
D+R |
Rank |
D-R |
Identify |
|
Financial Risks |
A |
1.616 |
1.517 |
3.133 |
5 |
-0.186 |
Effect |
|
Schedule Risks |
B |
1.734 |
1.418 |
3.152 |
4 |
-0.097 |
Effect |
|
Quality Risks |
C |
1.662 |
1.151 |
2.813 |
7 |
-0.12 |
Effect |
|
Stakeholder and Communic |
D |
1.489 |
1.443 |
2.932 |
6 |
-0.395 |
Effect |
|
Legal and Contractual |
E |
1.729 |
1.752 |
3.481 |
2 |
0.307 |
Cause |
|
Technical and Design |
F |
1.599 |
1.817 |
3.416 |
3 |
0.114 |
Cause |
|
Force Majeure and External |
G |
1.419 |
2.165 |
3.584 |
1 |
0.661 |
Cause |
|
Environmental and Regulato |
H |
1.228 |
1.215 |
2.443 |
8 |
-0.284 |
Effect |
Step 5: The existence of the initial direct contact matrix is used to create the unified fuzzy direct contact matrix "N". The unified fuzzy direct contact matrix can be calculated (see Table 7).
Step 6: A fuzzy matrix with total correlation is generated after obtaining a uniform direct correlation fuzzy matrix. The identity matrix (n*n) can be calculated. The fuzzy relationship matrix is shown in Table 8.
Step 7: To produce an accurate value for the overall relationship matrix, reduce the fuzzy data to accurate scores. Table 9 represents the accurate overall relationship matrix.
Step 8: In this research, the threshold value is equal to (0.195). All values of the T-matrix smaller than (0.195) are set to zero, which means ignoring the causal relationship described previously. Table 10 shows the important relationship model.
Step 9: The next step is to calculate the total for each column and row (in step 8). The total number of rows (D) and columns (R) can be calculated. D and R are then used to calculate D+R and D-R, where D+R represents the importance of the i component in the entire system, and D-R represents the net effects of the system. The final result is shown in Table 11.
Figure 2 illustrates the significant relationship model. This model represents a graph with (D+R) values on the horizontal axis and (D-R) values on the vertical axis. The coordinate system determines the location of each factor and its interaction with a point in the coordinates (D+R, D-R).
Figure 2. The final internal causal relationship for main risk criteria
Step 10: Interpret the results
According to the Figure 2 and Table 11, each factor can be assessed based on the following aspects:
- Horizontal vector (D + R) represents the degree of importance between each factor plays in the entire system. In other words, (D + R) indicates both factor i’s impact on the whole system and other system factors’ impact on the factor. in terms of degree of importance, G: Force Majeure and External Risks is ranked in first place and E: Legal and Contractual Risks, F: Technical and Design Risks, B: Schedule Risks, A: Financial Risks, D: Stakeholder and Communication Risks, C: Quality Risks and H: Environmental and Regulatory Risks, are ranked in the next places.
Table 12. Risk prioritization for construction projects
|
Prioritization of Risk Factors (Rank) |
1 |
2 |
3 |
4 |
5 |
6 |
7 |
8 |
|
Force Majeure... (First) |
G5 |
G6 |
G3 |
G7 |
G4 |
G2 |
G8 |
G1 |
|
Legal and Con... (Second) |
E1 |
E2 |
E5 |
E4 |
E6 |
E3 |
|
|
|
Technical and (Third) |
F6 |
F1 |
F3 |
F2 |
F5 |
F4 |
|
|
|
Schedule...(Forth) |
B2 |
B3 |
B6 |
B1 |
B4 |
B5 |
|
|
|
Financial.... (Fifth) |
A1 |
A3 |
A6 |
A2 |
A7 |
A4 |
A5 |
|
|
Stakeholder and (Sixth) |
D4 |
D3 |
D1 |
D2 |
|
|
|
|
|
Quality (Seventh) |
C2 |
C1 |
C4 |
C3 |
C5 |
|
|
|
|
Environmental... (Eight) |
H1 |
H3 |
H2 |
H4 |
|
|
|
|
Table 13. Final output for sub-risk criteria for all criteria
|
Sub-Risk Factors |
Code |
D |
R |
D+R |
Rank |
D-R |
Identify |
|
A: Financial Risks |
A |
|
|
|
|
|
|
|
Cost Overruns |
A1 |
2.561 |
2.408 |
4.969 |
1 |
-0.153 |
Effect |
|
Budget Misallocation |
A2 |
2.132 |
2.475 |
4.606 |
4 |
0.343 |
Cause |
|
Funding Delays |
A3 |
2.649 |
2.219 |
4.868 |
2 |
-0.429 |
Effect |
|
Inflation |
A4 |
1.969 |
1.835 |
3.804 |
6 |
-0.135 |
Effect |
|
Financial failure of the contractor |
A5 |
2.101 |
1.665 |
3.766 |
7 |
-0.436 |
Effect |
|
Inaccurate cost estimates |
A6 |
2.309 |
2.497 |
4.806 |
3 |
0.188 |
Cause |
|
Currency Fluctuations |
A7 |
1.958 |
2.581 |
4.539 |
5 |
0.622 |
Cause |
|
B: Schedule Risk |
B |
|
|
|
|
|
|
|
Delays in project timelines |
B1 |
2.342 |
2.197 |
4.539 |
4 |
-0.146 |
Effect |
|
Poor planning and scheduling |
B2 |
2.79 |
2.828 |
5.618 |
1 |
0.038 |
Cause |
|
Unforeseen site conditions |
B3 |
2.746 |
2.584 |
5.329 |
2 |
-0.162 |
Effect |
|
Delays in material delivery |
B4 |
2.266 |
1.93 |
4.196 |
5 |
-0.337 |
Effect |
|
Delays in permits |
B5 |
1.598 |
2.262 |
3.86 |
6 |
0.664 |
Cause |
|
Lack of labor, materials and equipment |
B6 |
2.409 |
2.352 |
4.76 |
3 |
-0.057 |
Effect |
|
C: Quality Risks |
C |
|
|
|
|
|
|
|
Non-compliance with specifications |
C1 |
2.594 |
2.798 |
5.392 |
2 |
0.204 |
Effect |
|
Poor workmanship |
C2 |
3.03 |
2.427 |
5.457 |
1 |
-0.603 |
Effect |
|
Use of substandard materials |
C3 |
3.122 |
1.951 |
5.072 |
4 |
-1.171 |
Effect |
|
Inadequate quality control processes |
C4 |
1.924 |
3.087 |
5.01 |
3 |
1.163 |
Cause |
|
Failure to meet regulatory standards |
C5 |
2.286 |
2.693 |
4.978 |
5 |
0.407 |
Effect |
|
D: Stakeholder and Communication Risks |
D |
|
|
|
|
|
|
|
Poor Communication Between Project Teams |
D1 |
2.29 |
2.574 |
4.864 |
3 |
0.285 |
Cause |
|
Conflicting stakeholder interests |
D2 |
1.981 |
2.583 |
4.564 |
4 |
0.602 |
Cause |
|
Lack of stakeholder engagement |
D3 |
2.531 |
2.448 |
4.979 |
2 |
-0.083 |
Effect |
|
Poor decision-making processes |
D4 |
3.044 |
2.24 |
5.284 |
1 |
-0.804 |
Effect |
|
E: Legal and Contractual Risk |
E |
|
|
|
|
|
|
|
Litigation |
E1 |
2.051 |
1.1 |
3.151 |
1 |
-0.951 |
Effect |
|
Contract Disputes |
E2 |
1.721 |
1.369 |
3.089 |
2 |
-0.352 |
Effect |
|
Regulatory Non-Compliance |
E3 |
1.076 |
1.496 |
2.572 |
6 |
0.42 |
Cause |
|
Absence of project anti-corruption systems |
E4 |
1.012 |
1.819 |
2.831 |
4 |
0.807 |
Cause |
|
The organization's lack of experience… |
E5 |
1.429 |
1.453 |
2.882 |
3 |
0.024 |
Cause |
|
Deliberate ambiguity in the tender documents |
E6 |
1.29 |
1.341 |
2.631 |
5 |
0.051 |
Cause |
|
F: Technical and Design Risks |
F |
|
|
|
|
|
|
|
Design errors or omissions or Change design |
F1 |
2.145 |
2.626 |
4.771 |
2 |
0.481 |
Cause |
|
Poor estimates |
F2 |
2.733 |
1.78 |
4.514 |
4 |
-0.953 |
Effect |
|
Insufficient or inconsistent design documents |
F3 |
2.199 |
2.559 |
4.757 |
3 |
0.36 |
Cause |
|
Technology failures or obsolescence |
F4 |
1.489 |
2.019 |
3.508 |
6 |
0.53 |
Cause |
|
Construction Defects |
F5 |
2.156 |
1.633 |
3.789 |
5 |
-0.523 |
Effect |
|
Scope Creep |
F6 |
2.338 |
2.443 |
4.781 |
1 |
0.105 |
Cause |
|
G: Force Majeure and External Risk |
G |
|
|
|
|
|
|
|
Natural disasters (e.g., earthquakes, floods) |
G1 |
1.542 |
1.691 |
3.233 |
8 |
0.149 |
Cause |
|
Pandemics or health crises |
G2 |
1.981 |
1.797 |
3.778 |
6 |
-0.184 |
Effect |
|
Political instability or war |
G3 |
2.611 |
2.284 |
4.895 |
3 |
-0.327 |
Effect |
|
Economic downturns |
G4 |
2.538 |
2.037 |
4.575 |
5 |
-0.501 |
Effect |
|
Changes in government policies |
G5 |
2.482 |
2.442 |
4.924 |
1 |
-0.04 |
Effect |
|
Corruption and bribery |
G6 |
2.591 |
2.31 |
4.901 |
2 |
-0.281 |
Effect |
|
Political party interference (political quotas) |
G7 |
2.236 |
2.442 |
4.679 |
4 |
0.206 |
Cause |
|
Religious occasions |
G8 |
1.168 |
2.146 |
3.313 |
7 |
0.978 |
Cause |
|
H: Environmental and Regulation Risk |
H |
|
|
|
|
|
|
|
Non-compliance with environmental regulations |
H1 |
1.937 |
2.698 |
4.635 |
1 |
0.762 |
Cause |
|
Poor safety procedures |
H2 |
2.015 |
2.447 |
4.461 |
3 |
0.432 |
Cause |
|
Changes in regulatory requirements |
H3 |
2.352 |
2.134 |
4.486 |
2 |
-0.217 |
Effect |
|
Environmental damage or pollution |
H4 |
2.704 |
1.728 |
4.432 |
4 |
-0.976 |
Effect |
A: Financial Risks
B: Schedule Risk
C: Quality Risks
D: Stakeholder and Communication Risks
E: Legal and Contractual Risk
F: Technical and Design Risks
G: Major Force and Eternal Risk
H: Environmental and Regulation Risk
Figure 3. The final internal causal relationship for all sub-risk criteria
- The vertical vector (D-R) represents the degree of a factor’s influence on the system. The positive value of D-R generally represents a causal variable, and the negative value represents an effect. In this study, E: Legal and Contractual Risks, F: Technical and Design Risks, G: Force Majeure and External Risks are considered to be causal variables, A: Financial Risks, B: Schedule Risks, C: Quality Risks, D: Stakeholder and Communication Risks, H: Environmental and Regulatory Risks are regarded as effects.
(2) Analysis and Evaluation of Sub-Risk Criteria for Construction Risks
To obtain the results of the FD model for the Sub-risk criteria, the researcher applied the same steps previously from (Step 1- Step 9) when analyzing and evaluating the main criteria. Table 12 Risk Prioritisation for Construction Projects, The categories are arranged in order of severity: Force Majeure (highest) → Legal → Technical → Schedule → Financial → Stakeholders → Quality → Environmental (lowest). Note that the codes (e.g., G5, E1) represent sub-risks within each category, where the letter indicates the category (A = Financial, B = Schedule, etc.), and the number indicates its priority within it (1 = least severe). The horizontal order (from left to right) illustrates the priority of the sub-risks within their category, with the first code in each row being the most severe (e.g., G5 for Force Majeure, E1 for Legal). The highest risk of all was G5 (the first sub-risk in the most severe category-force majeure), as well as Table 13, which represents the final results of the model, represented by finding the importance level of the factors by adding (Ri+Di) and finding the degree of causality and influence by finding (Ri-Di), Table 13 evaluates project risks based on two main criteria: probability of occurrence (D) and severity of impact (R). Here's the explanation in 5 lines:
Objective: To rank project risks according to their overall severity (D+R) and determine whether they are a cause (D+R) or a consequence (D+R).
Severity calculation: The priority of each sub-risk within its category (the Rank column) is determined based on the sum of the D+R-the higher the sum, the greater the severity.
Distinguishing between cause and effect: The Identify column classifies the risk as:
Cause: If D-R is positive (i.e., the probability is higher than the effect).
Effect: If D-R is negative (i.e., the effect is higher than the probability).
Highest risk: Based on D+R, the most serious sub-risk is Poor planning and scheduling (B2) with a score of 5.618, followed by Poor workmanship (C2) with a score of 5.457.
Importance of classification: Focusing on high D+R risks and addressing the causes helps reduce the effects.
Step 10 explains the interpretation of the results in Table 13 and Figure 3. Figure 3 illustrates the final results of the causality and influence diagram, as follows:
8.2 Interpretation of results
(1) Force majeure and external risks
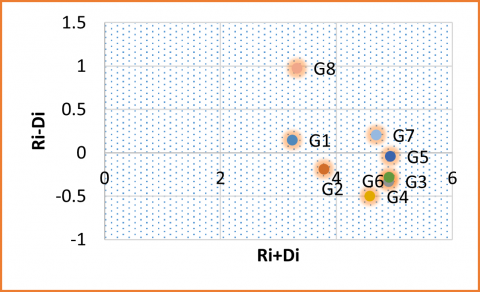
Force Majeure and External Risks ranked first, according to the results shown in Table 11 and Figure 2, where the value of (D+R) was (3.584), representing the relative importance of the criterion compared to other criteria. On the other hand, the results (D-R) indicate that the force majeure and external risk criteria are causal risks in the construction project. As for the secondary criteria, based on the results of Tables 11-13 and the results shown in Figure 3, the results are interpreted as follows:
- The horizontal vector (D + R) represents the degree of importance of each factor within the entire system. In other words, (D + R) indicates the impact of factor (i) on the entire system and the impact of other system factors on it. In terms of degree of importance, G5 (changes in government policies) ranks first, followed by G6, G3, G7, G4, G2, G8, and G1, respectively.
- The vertical vector (D-R) represents the degree of influence of the factor on the system. In general, a positive value of (D-R) represents a causal variable, while a negative value of (D-R) represents an influence. In this study, G1 Natural disasters (e.g., earthquakes, floods), G7 Political party interference (political quotas), and G8 Religious occasions are considered causal variables, while G2, G3, G4, G5, and G6 are considered influence variables.
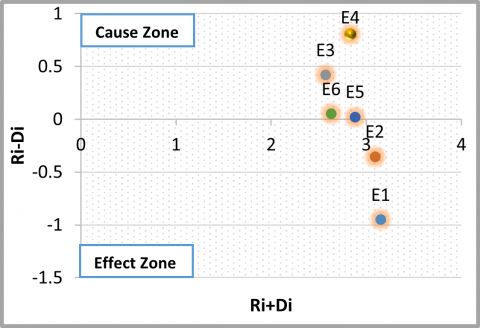
(2) Legal and contractual risks
Legal and contractual risks ranked second, according to the results shown in Table 11 and Figure 2, where the value of (D+R) was (3.481), representing the relative importance of the criterion compared to other criteria. The results of (D-R) indicate that the legal and contractual risk criteria are causal risks in the construction project. As for the secondary criteria, they were as shown below:
The horizontal vector (D + R) represents the degree of importance of each factor within the entire system. In terms of degree of importance, (E1) litigation ranked first, followed by (E2) contract disputes, (E5) the organization's lack of expertise in evaluating bids, (E4) the absence of anti-corruption systems in the project, (E6) deliberate ambiguity in bid documents, and (E3) regulatory non-compliance.
The vertical vector (D-R) represents the degree of influence of the factor on the system. In this study, (E3), (E4), (E5), and (E6) are considered causal variables, while (E1) and (E2) are considered effect variables. 3. Technical and Design Risks.
(3) Technical and design risks
Technical and design risks ranked third, according to the results shown in Table 11 and Figure 2. The D+R value was 3.416, representing the relative importance of the criterion compared to other criteria. Furthermore, Table 11 and Figure 2 show that the D-R results indicate that technical and design risk criteria are causal risks in the construction project. The secondary criteria are as shown below:
- The horizontal vector (D+R) score in terms of the degree of importance of technical and design risks is as follows: F6: Scope creep ranked first, F: Technical and design risks, F3: Insufficient or inconsistent design documentation, F2: Poor estimations, F5: Construction defects, and F4: Technology failure or obsolescence ranked next.
-The vertical vector (D-R) results in this study are: F: Technical and design risks, F3: Inadequate or inconsistent design documentation, F4: Technology failure or obsolescence, F6: Scope creep is considered a causal variable, F2: Poor estimations, and F5: Construction defects are considered an outcome.
(4) Scheduling risks
Scheduling risks ranked fourth, according to the results shown in Table 11 and Figure 2, where the value of (D+R) was (3.152). The results of (D-R) indicate that scheduling risk criteria are significant risks in construction projects. As for the secondary criteria, they were as shown below:
- The horizontal vector (D + R) represents, in terms of importance, B2: Poor planning... ranked first, B3: Unforeseen site conditions, B6: Labor shortage, B1: Delayed project schedules, B4: Delayed material delivery, and B5: Delayed permitting, ranked next.
- The vertical vector (D-R) represents, in terms of causality, B2: Poor planning, B5: Delayed permitting is considered a causal variable; B1: Delayed project schedules, B3: Unforeseen site conditions, B4: Delayed material delivery, and B6: Labor shortage is considered an effect.
(5) Financial risks
Financial risks ranked fifth among the various criteria, according to the results shown in Table 11 and Figure 2, where the value of (D+R) was (3.133). The results of (D-R) indicate that financial risk criteria are significant risks in the construction project. The secondary criteria were as shown below:
- The result of the horizontal vector (D+R). In terms of importance, A1: Cost Overruns ranked first, A3: Financing Delays, A6: Inaccurate Cost Estimates, A2: Budget Misallocation, A7: Currency Fluctuations, A4: Inflation, and A5: Financial Failure ranked next.
- The result of the vertical vector (D-R). In this study, A2: Budget Misallocation, A6: Inaccurate Cost Estimates, and A7: Currency Fluctuations are considered causal variables, while A1: Cost Overruns, A3: Financing Delays, A4: Inflation, and A5: Financial Failure are considered impacts.
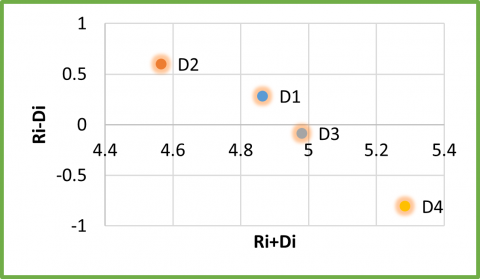
(6) Stakeholder and communication risks
Stakeholder and Communication Risks ranked sixth among the various criteria, according to the results shown in Table 11 and Figure 2, where the value of (D+R) was (2.932). The results of (D-R) indicate that the stakeholder and communication risk criteria are significant risks in the construction project. The secondary criteria are as shown below:
- The horizontal vector (D+R) result was interpreted in terms of importance, with D4: Weak Decision-Making Processes ranked first, D3: Weak Stakeholder Engagement, D1: Weak Communication Between Project Teams, and D2: Conflicting Stakeholder Interests ranked next.
- The vertical vector (D-R) was interpreted in this study, with D1: Poor communication between project teams, D2: Conflict of interest among stakeholders as the causal variable, D3: Poor stakeholder engagement, and D4: Poor decision-making processes as the effect.
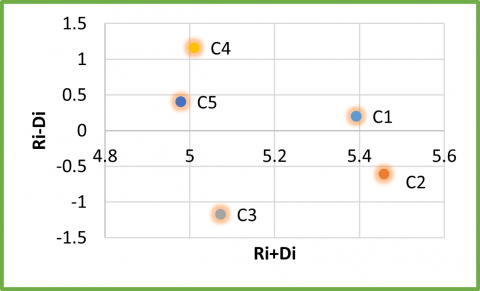
(7) Quality risks
Quality risks were ranked seventh among the various criteria, according to the results shown in Table 11 and Figure 2, where the value of (D+R) was (2.813). The results of (D-R) indicate that quality risk criteria are significant risks in the construction project. The secondary criteria were as shown below:
- The horizontal vector (D+R) was interpreted in terms of importance, with C2: Poor workmanship ranked first, C1: Non-compliance with specifications, C3: Use of substandard materials, C4: Inadequate quality control processes, and C5: Failure to meet regulatory standards, ranked next.
- The vertical vector (D-R) is interpreted in this study, with C1: non-compliance with specifications, C4: inadequate quality control processes, C5: failure to meet regulatory standards as the causal variable, C2: poor workmanship, and C3: use of substandard materials as the effect.
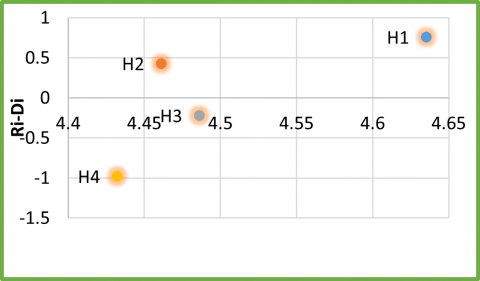
(8) Environmental and regulatory risks
Environmental and regulatory risks were ranked eighth among the various criteria, with a D+R value of 2.443. The D-R results indicate that environmental and regulatory risk criteria are significant risks in the construction project. The secondary criteria are as shown below:
- The horizontal vector (D+R) is interpreted in terms of importance, with H1 ranked first, and H3, H2, and H4 ranked next.
- The vertical vector (D-R) is interpreted in this study; Where H1 and H2 are causal variables, and H3 and H4 are influential variables.
The construction sector has tremendous potential to contribute to economic growth and development in any country. However, it is also a risky sector, where a single accident can have disastrous consequences. Therefore, effective risk assessment and management in the construction sector is a necessary area of research. This study aims to improve the Factors Factoring (FD) approach to critical occupational hazards, which is applied through 8 primary and 46 secondary criteria in the construction sector from a stakeholder perspective. Thus, this study presents a new approach to occupational hazard assessment to evaluate primary and secondary factors, helping sector managers develop appropriate risk prevention strategies.
The proposed method outperforms traditional methods by revealing relationships between factors and classifying criteria based on the type of relationships and the severity of their effects on each criterion. Furthermore, by using a fuzzy linguistic scale, imprecise and inaccurate information was addressed. Thanks to these advantages, DEMATEL is used to reveal better insights into the effects of cause-and-effect criteria analysis and to increase the applicability of the model. Thus, the proposed method has the ability to represent the causal relationship between criteria, making it suitable for dealing with group decision-making in an uncertain environment.
Based on the results, several precautions can be proposed to address potential occupational risks. First, it is suggested to focus on the criteria of the cause group due to their impact on the criteria of the impact group. Ranking the criteria of the cause group is much more difficult than the criteria of the impact group.
Therefore, the results show that the main causal criteria are shown in Table 13, respectively: force majeure and external risks (G) and legal and contractual risks (E). Technical and design risks (F) came in third place, while the remaining main criteria are within the impact group. Furthermore, managers should focus on critical secondary causal factors in the construction sector, namely:
Political party interference (political quotas) (G7), religious events (G8), natural disasters (G1), lack of anti-corruption systems (E4), lack of organizational expertise in bid evaluation (E5), intentional ambiguity in bid documents (E6), scope creep (F6), insufficient or inconsistent design documents (F3), design errors, omissions, and design changes (F1), poor planning and scheduling (B1), permitting delays (B5), inaccurate cost estimation (A6), currency fluctuations (A7), and poor communication between project teams (D1). Sensitivity analysis was also used to reveal robust and valid results that are close to the evaluators' true preferences.
Here are the main conclusions and practical recommendations:
9.1 Main conclusions
1. Effectiveness in addressing uncertainty:
The Fuzzy Dematel method offers an advanced solution for addressing ambiguity in construction risk assessment, such as financial fluctuations and uncertain environmental risks.
2. Revealing interconnected risk interrelationships:
The technique reveals complex causal relationships between risks (such as the impact of legal risks on time delays and costs), helping to identify the most impactful "root risks."
3. Accurate decision making:
Visual maps (such as causal influence networks) help project managers and evaluators prioritize interventions, such as focusing resources on "high-impact" risks.
9.2 Practical recommendations
1. Integrating the technique with project management tools:
Develop interactive tables and maps that display Fuzzy Dematel maps to facilitate real-time risk monitoring.
2. Strengthening contingency plans:
Incorporating the results of the Dematel analysis into risk management plans, such as "avoidance" strategies for high-impact risks (such as structural) and "mitigation" strategies for medium-impact risks (such as legal).
3. Improving fuzzy models:
Using modified fuzzy numbers to incorporate psychological and behavioral factors into risk assessment, such as the effect of work stress on human error.
[1] Nassar, Y.S., Erzaij, K.R. (2023). Investigation and evaluation of crisis factors affecting construction projects in Iraq. AIP Conference Proceedings, 2806(1): 040021. https://doi.org/10.1063/5.0163054
[2] Sprajcer, M., Thomas, M.J., Sargent, C., Crowther, M. E., Boivin, D.B., Wong, I.S., Dawson, D. (2022). How effective are fatigue risk management systems (FRMS)? A review. Accident Analysis & Prevention, 165: 106398. https://doi.org/10.1016/j.aap.2021.106398
[3] Alvand, A., Mirhosseini, S.M., Ehsanifar, M., Zeighami, E., Mohammadi, A. (2023). Identification and assessment of risk in construction projects using the integrated FMEA-SWARA-WASPAS model under fuzzy environment: A case study of a construction project in Iran. International Journal of Construction Management, 23(3): 392-404. https://doi.org/10.1080/15623599.2021.1877875
[4] Aggabou, L.K., Lakehal, B., Mouda, M. (2024). An artificial neural network approach for construction project risk management. International Journal of Safety & Security Engineering, 14(2): 553-561. https://doi.org/10.18280/ijsse.140222
[5] Latilo, A., Uzougbo, N.S., Ugwu, M.C., Oduro, P., Aziza, O.R. (2024). Developing legal frameworks for successful engineering, procurement, and construction projects. International Journal of Applied Research in Social Sciences, 6(8): 1868-1883. https://doi.org/10.51594/ijarss.v6i8.1430
[6] Albahri, A.S., Duhaim, A.M., Fadhel, M.A., Alnoor, A., Baqer, N.S., Alzubaidi, L., Deveci, M. (2023). A systematic review of trustworthy and explainable artificial intelligence in healthcare: Assessment of quality, bias risk, and data fusion. Information Fusion, 96: 156-191. https://doi.org/10.1016/j.inffus.2023.03.008
[7] Wong, L.W., Tan, G.W.H., Ooi, K.B., Lin, B., Dwivedi, Y.K. (2024). Artificial intelligence-driven risk management for enhancing supply chain agility: A deep-learning-based dual-stage PLS-SEM-ANN analysis. International Journal of Production Research, 62(15): 5535-5555. https://doi.org/10.1080/00207543.2022.2063089
[8] Bresnen, M., Marshall, N. (2000). Building partnerships: Case studies of clientcontractor collaboration in the UK construction industry. Construction Management and Economics, 18(7): 819-832. https://doi.org/10.1080/014461900433104
[9] Huang, H.C., Huang, C.N., Lo, H.W., Thai, T.M. (2023). Exploring the mutual influence relationships of international airport resilience factors from the perspective of aviation safety: Using fermatean fuzzy DEMATEL approach. Axioms, 12(11): 1009. https://doi.org/10.3390/axioms12111009
[10] Regona, M., Yigitcanlar, T., Xia, B., Li, R.Y.M. (2022). Opportunities and adoption challenges of AI in the construction industry: A PRISMA review. Journal of Open Innovation: Technology, Market, and Complexity, 8(1): 45. https://doi.org/10.3390/joitmc8010045
[11] Mohandes, S.R., Sadeghi, H., Fazeli, A., Mahdiyar, A., Hosseini, M.R., Arashpour, M., Zayed, T. (2022). Causal analysis of accidents on construction sites: A hybrid fuzzy Delphi and DEMATEL approach. Safety Science, 151: 105730. https://doi.org/10.1016/j.ssci.2022.105730
[12] Wang, Z., Luo, P., Zha, X., Xu, C., Kang, S., Zhou, M., Wang, Y. (2022). Overview assessment of risk evaluation and treatment technologies for heavy metal pollution of water and soil. Journal of Cleaner Production, 379: 134043. https://doi.org/10.1016/j.jclepro.2022.134043
[13] Hallak, J. (2024). Optimizing construction supplier selection in conflict-affected regions: A hybrid multi-criteria framework. Operations Management Research, 17(4): 1270-1294. https://doi.org/10.1007/s12063-024-00505-0
[14] Obi, L.I., Arif, M., Awuzie, B., Islam, R., Gupta, A.D., Walton, R. (2021). Critical success factors for cost management in public-housing projects. Construction Innovation, 21(4): 625-647. https://doi.org/10.1108/ci-10-2020-0166
[15] Radhi, A.R., Nassar, Y.S., Alhilli, H.K. (2025). A bidding assessment framework using CRITIC and MABAC methods. Engineering, Technology & Applied Science Research, 15(3): 23048-23053. https://doi.org/10.48084/etasr.10665
[16] Barbhuiya, S., Das, B.B. (2023). Life Cycle Assessment of construction materials: Methodologies, applications and future directions for sustainable decision-making. Case Studies in Construction Materials, 19: e02326. https://doi.org/10.1016/j.cscm.2023.e02326
[17] Sun, G., Tang, X., Wan, S., Feng, J. (2023). An extended Fuzzy-DEMATEL system for factor analyses on social capital selection in the renovation of old residential communities. CMES-Computer Modeling in Engineering & Sciences, 134(2): 1041-1067. https://doi.org/ 10.32604/cmes.2022.021981
[18] Yusuf, A., Pervin, N., Román-González, M. (2024). Generative AI and the future of higher education: A threat to academic integrity or reformation? Evidence from multicultural perspectives. International Journal of Educational Technology in Higher Education, 21(1): 21. https://doi.org/10.1186/s41239-024-00453-6
[19] Harrison, R., Jones, B., Gardner, P., Lawton, R. (2021). Quality assessment with diverse studies (QuADS): An appraisal tool for methodological and reporting quality in systematic reviews of mixed-or multi-method studies. BMC Health Services Research, 21: 144. https://doi.org/10.1186/s12913-021-06122-y
[20] Zhu, F., Hu, H., Xu, F. (2022). Risk assessment model for international construction projects considering risk interdependence using the DEMATEL method. Plos one, 17(5): e0265972. https://doi.org/ 10.1371/journal.pone.0265972
[21] Sun, R., Geng, X., Zhao, L., Wang, Y., Guo, R. (2023). Research on the risk-inducing factors of prefabricated building design change based on improved DEMATEL-ISM. Buildings, 13(12): 3036. htps://doi.org/10.3390/buildings13123036
[22] Muianga, E., Granja, A., Ruiz, J.A. (2014). Influence factors on cost and time overruns in mozambicans construction projects: Preliminary findings. In Proceedings: 5th International Conference on Engineering, Project and Production Management, Port Elizabeth, South Africa, pp. 10-21. htps://doi.org/10.32738/ceppm.201411.0002
[23] Yu, R., Ma, L. (2025). Risk evaluation of mega infrastructure construction supply chain in engineering-procurement-construction projects: An integrated fuzzy AHP and fuzzy DEMATEL approach. Engineering, Construction and Architectural Management, 32(5): 3217-3235. https://doi.org/10.1108/ecam-05-2023-0472
[24] Abeysekara, B. (2020). Application of fuzzy set theory to evaluate large scale transport infrastructure risk assessment and application of best practices for risk management. In 2020 IEEE International Conference on Industrial Engineering and Engineering Management (IEEM), Singapore, Singapore, pp. 385-389. https://doi.org/10.1109/ieem45057.2020.9309957
[25] Hatefi, S.M., Tamošaitienė, J. (2019). An integrated fuzzy DEMATEL-fuzzy ANP model for evaluating construction projects by considering interrelationships among risk factors. Journal of Civil Engineering and Management, 25(2): 114-131. https://doi.org/10.3846/jcem.2019.8280
[26] Seker, S., Zavadskas, E. K. (2017). Application of fuzzy DEMATEL method for analyzing occupational risks on construction sites. Sustainability, 9(11): 2083. https://doi.org/10.3390/su9112083
[27] Nguyen, H.D., Macchion, L. (2023). A comprehensive risk assessment model based on a fuzzy synthetic evaluation approach for green building projects: The case of Vietnam. Engineering, Construction and Architectural Management, 30(7): 2837-2861. https://doi.org/10.1108/ecam-09-2021-0824
[28] Al-Nahhas, Y.S., Hadidi, L.A., Islam, M.S., Skitmore, M., Abunada, Z. (2024). Modified Mamdani-fuzzy inference system for predicting the cost overrun of construction projects. Applied Soft Computing, 151: 111152. https://doi.org/10.1016/j.asoc.2023.111152
[29] Sadeghi, M., Mahmoudi, A., Deng, X. (2023). Blockchain technology in construction organizations: Risk assessment using trapezoidal fuzzy ordinal priority approach. Engineering, Construction and Architectural Management, 30(7): 2767-2793. https://doi.org/10.1108/ecam-01-2022-0014
[30] Singh, J. (2025). Risk assessment and mitigation in construction building projects. Journal of Constuction and Building Materials Engineering, 11(1): 14-23. https://doi.org/10.46610/jocbme.2025.v011i01.002
[31] Adinolfi, P. (2021). A journey around decision-making: Searching for the “big picture” across disciplines. European Management Journal, 39(1): 9-21. https://doi.org/10.1016/j.emj.2020.06.003
[32] Myeza, L., Nkhi, N., Maroun, W. (2021). Risk management factors contributing to transgressions in the procurement practices in South African SOEs. Journal of Accounting in Emerging Economies, 11(5): 735-751. https://doi.org/10.1108/jaee-03-2021-0073
[33] Halder, A., Bhardwaj, A., Barik, G. (2024). Evaluation of social risks in large-scale infrastructure projects in India–a comparative study using relational and traditional approaches. International Journal of Construction Management, 25(8): 940-954. https://doi.org/10.1080/15623599.2024.2389596
[34] Singh, A.K., Kumar, V.P., Dehdasht, G., Mohandes, S.R., Manu, P., Rahimian, F.P. (2023). Investigating the barriers to the adoption of blockchain technology in sustainable construction projects. Journal of Cleaner Production, 403: 136840. https://doi.org/10.1016/j.jclepro.2023.136840
[35] Li, Y., Xiang, P., Chan, P.W., Zhang, J. (2024). Examining owners’ and contractors’ motivations to participate in collaborative risk management of mega infrastructure projects. International Journal of Project Management, 42(5): 102614. https://doi.org/10.1016/j.ijproman.2024.102614
[36] Hagberg, N.C. (2006). Key attributes for successful leadership in construction: Project managers and superintendents. [Theses: Iowa State University]. https://doi.org/10.31274/rtd-180813-13215
[37] Afshari, A.R., Saeidi, H., Hatami, P. (2021). Identifying and ranking financial parameters of banks using fuzzy AHP method. Journal of Engineering Management and Competitiveness (JEMC), 11(1): 3-12. https://doi.org/10.5937/jemc2101003A
[38] Amorocho, J.A.P., Hartmann, T. (2022). A multi-criteria decision-making framework for residential building renovation using pairwise comparison and TOPSIS methods. Journal of Building Engineering, 53: 104596. https://doi.org/10.1016/j.jobe.2022.104596
[39] Costanza-Chock, S., Raji, I.D., Buolamwini, J. (2022). Who audits the auditors? Recommendations from a field scan of the algorithmic auditing ecosystem. In Proceedings of the 2022 ACM Conference on Fairness, Accountability, and Transparency, Seoul Republic of Korea, pp. 1571-1583. https://doi.org/10.1145/3531146.3533213
[40] Potekhina, E., Tretyakova, G., Lebedeva, O., Dudina, E., Shelygov, A., Lebedev, K. (2024). Risk management of the government debt portfolio: An analysis of the Russian federation. International Journal of Safety & Security Engineering, 14(5): 1377-1383. https://doi.org/10.18280/ijsse.140504
[41] PMI. (2000). A guide to the project management body of knowledge (PMBOK Guide). Project Management Institute.
[42] Khattak, A.A.J., Akhtar, R., Abas, M., Khalid, Q.S., Noor, S., Babar, A., Azim, S. (2019). Risk management in construction projects: Perspective of contractors and owners. WALIA Journal, 35(1): 77-89.
[43] Tayeh, B.A., Alaloul, W.S., Muhaisen, W.B. (2019). Challenges facing small-sized construction firms in the Gaza strip. The Open Civil Engineering Journal, 13(1): 51-57. https://doi.org/10.2174/1874149501913010051
[44] Shibani, A., Hasan, D., Saaifan, J., Sabboubeh, H., Eltaip, M., Saidani, M., Gherbal, N. (2024). Financial risk management in the construction projects. Journal of King Saud University-Engineering Sciences, 36(8): 552-561. https://doi.org/10.1016/j.jksues.2022.05.001
[45] Shah, S., Gopinath, S. (2023). Machine learning-based dynamic cost estimation model for construction projects. In International Conference on Civil Engineering Innovative Development in Engineering Advances, pp. 625-633. https://doi.org/10.1007/978-981-99-6233-4_56
[46] Salem, T.J., Tayeh, B.A. (2018). An Investigation of key risks and risk management strategies in construction projects-Gaza Strip. [Master thesis, Islamic University of Gaza]. https://doi.org/10.59992/IJSR.ISSN.2755-3418
[47] Rostami, A., Oduoza, C.F. (2017). Key risks in construction projects in Italy: contractors’ perspective. Engineering, Construction and Architectural Management, 24(3): 451-462. https://doi.org/10.1108/ECAM-09-2015-0142
[48] RICS. Global Construction Trends and Insights. Royal Institution of Chartered Surveyors, 2022. [Online]. Available: https://www.rics.org/.
[49] AGC. Construction Industry Outlook and Trends. Associated General Contractors of America, 2021. [Online]. Available: https://www.agc.org/.
[50] Tayeh, B.A., Salem, T.J., Abu Aisheh, Y.I., Alaloul, W.S. (2020). Risk factors affecting the performance of construction projects in gaza strip. The Open Civil Engineering Journal, 14: 94-104. https://doi.org/10.2174/1874149502014010094
[51] U.S. Army Corps of Engineers. Infrastructure Report: Challenges and Opportunities. U.S. Army Corps of Engineers, 2017. [Online]. Available: https://www.usace.army.mil/.
[52] BRE Group. Sustainability and Innovation in Construction. BRE Group, 2021. [Online]. Available: https://bregroup.com/.
[53] FMI. Construction Industry Trends and Outlook," FMI Corporation, 2022. [Online]. Available: https://www.fminet.com/.
[54] KPMG. Global Construction Survey: Navigating Uncertainty. KPMG International, 2021. [Online]. Available: https://home.kpmg/.
[55] PwC. Global Construction Industry Trends and Insights. PricewaterhouseCoopers, 2022. [Online]. Available: https://www.pwc.com/.
[56] Project Management Institute. Pulse of the Profession 2023: Overcoming Barriers to Effective Communication in Projects, PMI, 2023. [Online]. Available: https://www.pmi.org.
[57] Deloitte. Governance, Risk, and Compliance: Managing Conflicts of Interest in Stakeholder Engagement, Deloitte Insights, 2023. [Online]. Available: https://www2.deloitte.com.
[58] McKinsey & Company. Unlocking Success in Digital Transformations: The Role of Stakeholder Engagement, McKinsey & Company, 2023. [Online]. Available: https://www.mckinsey.com.
[59] Wellingtone. The State of Project Management Report 2023, Wellingtone, 2023. [Online]. Available: https://www.wellingtone.co.uk.
[60] European Commission. Sustainable Construction: Policies and Practices. European Commission, 2021. [Online]. Available: https://ec.europa.eu/.
[61] CIOB. The Role of Digital Technology in Construction. Chartered Institute of Building, 2018. [Online]. Available: https://www.ciob.org/.
[62] Wysocki, R.K. (2019). Effective Project Management: Traditional, Agile, Extreme. John Wiley & Sons.
[63] Pongtuluran, R.E., Machfudiyanto, R.A., Suraji, A. (2024). Hazard and risk identification in earthworks for road tunnel construction: A case study of the first road tunnel in Kalimantan Island, Indonesia. International Journal of Safety & Security Engineering, 14(6): 1949-1961. https://doi.org/10.18280/ijsse.140629
[64] OSHA. Construction Safety and Health Standards. Occupational Safety and Health Administration, 2021. [Online]. Available: https://www.osha.gov/.
[65] ILO. Global Trends in Occupational Safety and Health. International Labour Organization, 2022. [Online]. Available: https://www.ilo.org/.
[66] Sandhu, M.A., Ameri, T.A., Shahzad, A., Naseem, A. (2024). The role of project management office in the implementation of strategic plans in project-based organisations, PLOS ONE, 19(7): e0306702. https://doi.org/10.1371/journal.pone.0306702
[67] Woodward, R. (2022). The OECD and Global Governance. The Organisation for Economic Co-operation and Development (OECD), pp. 81-98. https://doi.org/10.4324/9781351025867-5
[68] Nassar, Y.S., Hazem, R.T., Hadi, A.H. (2025). Investigating and analyzing corruption risk factors and their impact on construction projects. AIP Conference Proceedings, 3303(1): 030001. https://doi.org/10.1063/5.0261958
[69] Bell, C.L. (2017). The ISO 14001 Environmental Management Systems Standard: One American’s View. In ISO 14001 and Beyond, pp. 61-92. https://doi.org/10.4324/9781351283366-4
[70] Sadiq, N. (2019). Establishing an Occupational Health & Safety Management System based on ISO 45001. IT Governance Publishing. https://doi.org/10.2307/j.ctvkjb2nc.12
[71] USGBC. (2020). Green Business Certification Inc. Expand Resources to Support Green Building Industry. Focus on Powder Coatings, 2020(11): 5. https://doi.org/10.1016/j.fopow.2020.10.020
[72] García Torea, N. (2022). Sustainability Accounting Standards Board (SASB). Encyclopedia of Sustainable Management. Springer, Cham, pp. 1-3. https://doi.org/10.1007/978-3-030-02006-4_841-1
[73] Ellen MacArthur Foundation. Circular Economy Overview. 2021. [Online]. Available: https://www.ellenmacarthurfoundation.org/circular-economy/concept.
[74] Liu, H.C., Quan, M.Y., Li, Z., Wang, Z.L. (2019). A new integrated MCDM model for sustainable supplier selection under interval-valued intuitionistic uncertain linguistic environment. Information Sciences, 486: 254-270. https://doi.org/10.1016/j.ins.2019.02.056
[75] Ma, L., Wang, L., Skibniewski, M.J., Gajda, W. (2019). An eco-innovative framework development for sustainable consumption and production in the construction industry. Technological and Economic Development of Economy, 25(5): 774-801. https://doi.org/10.3846/tede.2019.9385