Leila Aouragh![]() | Nouara Ouazraoui*
| Nouara Ouazraoui*![]() | Leila Boubaker
| Leila Boubaker![]() | Noureddine Bourmada
| Noureddine Bourmada![]() | Abdelhak Sekhri
| Abdelhak Sekhri![]()
OPEN ACCESS
Human performance plays an important role in process of improving occupational health and safety (OHS) performance. However, few studies have addressed integration of human performance into occupational risk assessment (ORA). In this paper, a hybrid approach to occupational risk assessment is presented that combines several techniques. SADT method is used to model a complex industrial production system by describing each of its steps and highlighting interactions and information flows within this system. Thus, information from system modelling by SADT method is used to carry out an ORA. Furthermore, key factors of human operator performance, namely motivation, knowledge and skills, are considered in this assessment. Developed methodology was applied to a cement manufacturing process. Results demonstrate importance of the proposed approach for occupational risks prevention and working conditions improvement.
OHS, human performance, structured analysis and design technique, ORA
In recent years, occupational health and safety (OHS) has become a public health priority and a major concern in the context of human resources management, particularly in high-risk industries. This is reflected simultaneously in a tightened regulatory framework and growing market pressure for companies to be aware of the need to control their risks. Let's remember that risks are events that prevent a company from achieving its strategic objectives [1, 2]. From now on, risk management must be a commercial logical [3]. Consequently, occupational risk assessment is a crucial step in any prevention approach [4, 5]. Implementing a prevention approach will help to improve the company's step-by-step human and economic performance. To this end, occupational risk assessment (ORA) is the starting point for guaranteeing the sustainability of any business, and above all for avoiding any physical, material or environmental damage type [6]. It is an essential element in the development of a company's risk prevention and management policy [7, 8].
Several approaches have been developed for the assessment of occupational risks, using different methods. However, few works have addressed the integration of human operator performance in this assessment although most occupational accidents are directly or indirectly caused by human operators. In this paper, we propose a hybrid model of occupational risk assessment by integrating human operator performance factors as a key component of the occupational health and safety management programme. The aim of this work is twofold:
The remainder of this document is organized as follows: The next section presents literature review on the different approaches of occupational risk assessment that have already been developed. While section 3 presents the proposed approach to improving conventional ORA. Section 4 is reserved for illustrating the proposed approach through its application to a cement manufacturing process. Application results are discussed in section 5, and the final section offers a conclusion.
Like other developing countries, Algeria considers cement production sector to be essential to its economy. It is an integral part of infrastructure development, which provides a significant stimulus to increasing employment opportunities, developing (or intensifying) economy by generating new global market opportunities [9-11]. However, occupational accidents and illnesses are a major issue in workplace. They harm workers, damage equipment and consequently diminish productivity, public reputation and companies' competitiveness in marketplace [12, 13]. In addition, they are potentially exposed to harmful agents making them vulnerable to health problems. In addition to various health risks, cement workers are particularly exposed to dust [14, 15], which causes impaired lung function in various production processes ranging from quarrying, crushing, grinding of raw materials, mixing, kiln burning, cement grinding and packaging in the cement industry [16]. Consequently, guaranteeing healthy and safe working conditions for workers is a fundamental key to corporate social responsibility and is one of the most important issues facing cement industry.
To this end, reports from International Labour Office (ILO) reveal that every 15 seconds, a worker dies as a result of a work-related accident or illness, and that every 15 seconds, 153 workers suffer a work-related accident [17]. This represents a serious health problem worldwide [18]. Indeed, occupational health and safety (OHS) are interlinked and influence the general well-being of workers. Occupational health and safety is one of work areas that must ensure a physically and psychologically suitable working environment that can lead to successful business outcomes [19]. Furthermore, understanding different factors that affect work-related health impairments and fatalities in the industry can help to develop prevention strategies, improve safety performance and reduce accidents (Occupational accidents and injuries in construction industry in Jeddah city) [20].
To address this OHS issue, several studies have been conducted on this topic to minimize accidents and OHS risks, authors [21-24] conducted an in-depth study on major process accidents and recommended the need for accident forecasting, consequence assessment and the development of OHS risk management contingency plans and risk process assessments in chemical industries. Other researchers felt that the imposition of strict rules and procedures was the only key to prevent human error, and climate and culture promotion was essential to accident and risk prevention [25-27].
Xu et al. [28] used accident causation theory WBA (Why-Because-Analysis), to statistically analyze the causal factors of 64 typical fire and explosion accidents in university laboratories. Their study showed that dangerous human actions at individual level were the most critical factors affecting laboratory safety management. In addition, Yang et al. [29] formulated loss prevention recommendations for chemical industry, from which it emerged that most accidents were directly or indirectly caused by human action, and that human factors played a decisive role in their occurrence, evolution and resolution. Given unsafe behaviors of construction workers, Hu et al. [30] conducted a study in this sector, examining the relationships between factors such as personality traits, psychological needs and safety motivation. They attempted to provide evidence and support for use of these factors, to improve practical safety interventions in construction. Furthermore, according to Basahel [31], motivation, being a cognitive phenomenon, is fuelled by psychological needs. In this respect, we can announce that the driving forces behind safety motivation may be safety competence and knowledge.
Thus, ORA a process that consists of assessment, ranking and classification of hazards, as well as associated risks occurring in any workplace from an occupational health and safety (OHS) perspective [32]. Numerous ORA methods have been proposed in literature, ranging from a single independent expert to participatory methodologies carried out by a group decision, and from simple to complex methods [33-35]. Consequently, a well-managed ORA process aims to maximize and maintain physical, mental and social well-being of employees, assign them to a job suited to their characteristics and protect employees from risky working conditions [36, 37].
A synthesis of numerous accident investigation reports has revealed that in a myriad of cases, an event cause is due to inappropriate operator or administrator behavior [38-42].
As mentioned in the previous section, and in the same context, a hybrid approach is proposed in this work to improve the traditional occupational risk assessment approach. It offers a flexible approach that can be adapted to the requirements of the cases to be studied. It is a means of communication and collaboration between different teams involved in occupational risk assessment, thus offering a more effective methodology.
Despite its use in systems engineering, SADT can also be adapted to other fields, such as OH&S risk management through ORA. It should also be noted that, although SADT and ORA are distinct concepts, they can be complementary in risk management. By combining the two concepts, them complementarily in risk and occupational hazard management may be highlighted. Indeed, SADT can be a very useful tool for visualizing and analyzing systems, and in so doing, it can help to improve traditional ORA. This SADT and ORA combination offers a more comprehensive and effective approach to Occupational Risk Assessment, with a focus on Human Operator Factors integration, hence Occupational Risk and Human Performance Assessment new name or ORA-PHO.
3.1 SADT
SADT was developed by Ross [43] following work (1969-1973) on problem solving dating back to 1950s at Softech. SADT, or Structured Analysis and Design Technique, is a graphical systems modeling method for representing and analyzing complex systems. It is a graphical language widely used to describe complex systems in communicative design, military planning and computer-aided manufacturing [44].
SADT aim is to enable experts to view problems from different points of view and levels of abstraction. SADT diagrams used enable a system to be broken down into subsystems and relationships between them to be represented. SADT can be applied to a variety of fields, including systems engineering and process management.
It should also be noted that there isn't a great deal of research into SADT use in OHS management, and in particular its integration into an ORA approach. However, some studies indicate that SADT is necessary formalism for a number of uses [45]. For example, Santarek and Buseif [46] propose SADT use to create high-level system design specifications for flexible manufacturing systems. Cogram and Epelman [47] explain a procedure for describing a service operation (individual tax return) using SADT diagrams at each stage. Kim et al. [48] discuss IDEF models’ integration to bring richer semantics to business modeling. Whitman et al. [49] describe a procedure for converting static models into simulation models using certain model rules and annotations. Other work has been deployed to perform functional and informational modeling of production [50], other SADT work has been used to solve technical production problems in vibratory-centrifugal reinforcement to obtain the required part quality parameters [51].
As part of this work, is to propose integration of SADT into EvRP approach. Indeed, structural and functional modelling of a system is an essential step in any risk analysis. The objective of this step is to identify, describe and prioritize all activities that must be accomplished in a complex industrial process. It provides a simple graphical representation, in diagrams form called actigrams formed of boxes and arrows where boxes represent activities and arrows data processed (information or objects) by activities. In the case, for example, tanning process, inputs are raw hides, chemicals, water, energy, mechanisms or resources that enable the functions of the process to be performed are leather preparation machines, tanning barrels, pumps, agitators and drying equipment. The constraints, which generally represent physical conditions for carrying out functions, are temperatures (tanning baths, heat treatment, drying), pH, chemicals concentration products etc. The outputs are tanned leather, residues or wastes (solid, liquid and gas). All information collected by this formalism and related to different functions of the process can constitute danger sources and generate risks and occupational diseases. These effects include chemical risks due to massive use of dangerous substances (skin irritation and dermatitis, chronic respiratory problems, allergies…), physical risks related to machines, especially rotating (amputations, injuries, falls,), musculoskeletal disorders due to uncomfortable or repetitive postures and possibly biological risks (bacterial infections) when handling animal material. All this information will be used to conduct an ORA.
3.2 ORA
ORA is a regulatory process designed to identify, assess and prevent OHS-related risks. The aim is to implement appropriate preventive measures to ensure OHS management. It is a mandatory process designed to identify hazards that employees are likely to encounter in workplace, and associated risk factors. These risks are classified according to their severity, probability of occurrence and potential number of employees affected. Once a risk assessment has been carried out, results must be transcribed into a single document for consistent sake, convenience and legal traceability [52].
3.3 Human operator performance as a precursor to OHS performance
OHS management is described as science and art of anticipating, recognizing, assessing and controlling occupational hazards in workplace [53]. Some research shows that determining OHS performance history plays a major role in effectively reducing number of workplace accidents [54, 55]. It should be remembered that, in addition to factors such as the work environment and management practices, which have been taken into account as constituting elements of OHS performance antecedents, the same authors Neal and Griffin [56] assert that Human factors have also been noted as OHS performance antecedents. As a result, Human performance plays a significant role in the process of improving OHS performance. Reiman and Pietikäinen [57] assert that "safety indicators can play a key role in providing information and knowledge on organizational performance and thus on OHS performance, motivating employees to work on safety while mobilizing their skills and knowledge and thus increasing organizational safety potential". In conclusion, the performance of the Human Operator depends on three factors: motivation, knowledge and skills. For all these reasons, we decided to take a closer look at the importance of human operator performance in occupational risk assessment. In addition, human performance depends on a number of essential factors, which we will detail in next section.
3.4 Occupational risk and human performance assessment ORA-PHO
In this article, an Improved ORA is proposed integrating human operator performance for occupational risks assessment linked to production systems. In addition to occupational risk parameters, this new approach considers factors that affect human operator performance.
The first stage of the proposed approach consists in carrying out a technical (structural) and functional analysis of production system to be studied, by modeling it using SADT method. Results of this first step are system's different activities identification, their interactions and the information flows within and between different levels of the system in question. The second stage concerns ORA implementation. Input data for this step, such as activity, hazard sources, risks and effects, are provided using SADT formalism.
Risk is then assessed in terms of injury severity (S), occurrence probability (P), rate exposure (f) and protection level (PL). These parameters characterization according to four-level ordinal scales is illustrated in Table 1.
Table 1. Occupational risk assessment parameters
|
Parameter |
Level |
Designation |
Description |
|
Frequency (f) |
1 |
Rarely |
Access to dangerous area may occur once a year or less than once. |
|
2 |
Uncommon |
Access to dangerous area may occur 1 or 2 times per month. |
|
|
3 |
Frequent |
Access to dangerous area may occur several times a week. |
|
|
4 |
Very Frequent |
Access to danger zone is every day. |
|
|
Exposure rate (E) |
1 |
Weak |
Between 5 and 20 minutes. |
|
2 |
Average |
Between 1 and 2 hours. |
|
|
3 |
High |
Between 4 and 6 hours. |
|
|
4 |
Very High |
More than 6 hours. |
|
|
Severity (S) |
1 |
Minor |
Work accident without work stoppage. |
|
2 |
Average |
Work accident or illness with work stoppage or hospitalization. |
|
|
3 |
Severe |
Work accident or occupational illness with fitted work post or permanent professional incapacity (PPI). |
|
|
4 |
Very serious |
Fatal work accident or chronic occupational disease. |
|
|
Protection level (PL) |
1 |
Sufficient |
Very effective measures are in place. |
|
2 |
Insufficient |
Insufficient measures. |
|
|
3 |
Moderately |
Measures that respond to risk situations but can be improved. |
|
|
4 |
Non-existent prevention |
No measures are in place or measures in place are insufficient. |
|
|
Risk level (R) |
1 |
Negligible |
Risk is very low |
|
2 |
Acceptable |
We can work with. |
|
|
3 |
Average |
Significant risk, which requires improvement. |
|
|
4 |
Unacceptable |
Immediate work stoppages with action plan. |
By multiplying these parameters, real risk may be assessed, taking into account preventive measures already in place:
$R=(f \times E \times S) / P L$ (1)
Risk is represented by an ordinal scale ranging from class 1 (negligible risk) to class 4 (very high risk), as shown in Table 2.
Table 2. Risk scale
|
Class |
Risk |
Meaning |
|
Negligible |
R < 1 |
Negligible |
|
Tolerable |
1< R ≤ 8 |
Tolerable/We can work with |
|
High |
8< R ≤ 16 |
High, requiring protection and improvements |
|
Very High |
R> 16 |
Very high, immediate work stoppage, immediate reduction |
As employees are the first to be affected by occupational hazards to which they are exposed, it is essential to integrate their performance into ORA, and this is the third stage in the proposed approach. In the context of this approach, human operator performance can be expressed as:
$\mathrm{P}_{\mathrm{HO}}=M \times C \times K m$ (2)
where,
PHO: Human operator performance
M: Motivation
Km: Knowledge
C: Competence
These different parameters are evaluated using three-level ordinal scales, as shown in Tables 3 and 4. Indeed, a Safety Management System (SMS), to meet OHS objectives, comprises policies set and practices aimed at positively involving workers' behaviors in facing's risks, with the aim of reducing their dangerous acts. Exposure, on the other hand, refers to duration and resources number that can lead to hazards for people [58]. Risk exposure has also been shown to influence organizational OHS participation [11].
ORA is the commonly used method for assessing activities risk exposure performed by workers.
As the importance of workers' personal knowledge, skills and motivations in OHS management can be explained by their physical proximity to sources of danger. These factors can be integrated into occupational in risk assessment phase; hence, the new name Occupational Risk and human operator performance Assessment, or ORA-PHO. This combination is justified by the fact that implicit assumptions in activity-based risk assessment suggest that these resource-based risk assessments, such as knowledge held by Human Operator, can be used to compare activities for future operations. Dejoy et al. [39] state that such factors as operator behavior plays a key role in OHS issues. OHS-related knowledge thus corresponds to actions linked to health importance and safety that are shared by a people group.
Three-level ordinal scales as shown in Tables 3 and 4 evaluate these different parameters.
Table 3. Human operator performance evaluation parameters
|
Parameters |
Level |
Designation |
Description |
|
Motivation |
1 |
Strong |
The Human operator has a strong motivation to accomplish his tasks. |
|
2 |
Average |
Motivation is average. |
|
|
3 |
Non-existent |
Human operator has complete knowledge following training. |
|
|
Knowledge |
1 |
Complete |
The Human operator has no any knowledge. |
|
2 |
Incomplete |
Knowledge of Human operator is incomplete. |
|
|
3 |
Weak |
The Human operator has no any knowledge. |
|
|
Competence |
1 |
Satisfactory |
He does a job more or less without errors. |
|
2 |
To improve |
A permanent monitoring of his work is recommended. |
|
|
3 |
Unsatisfactory |
He makes mistakes in his work; constant monitoring is recommended. |
Table 4. Human operator performance scale
|
Performance Score (PHO) |
Performance Level |
|
1< PHO ≤ 4 |
Exceeds Expectations (High) |
|
4< P HO ≤ 8 |
Meets expectations (Average) |
|
P HO> 8 |
Below Expectations (Weak) |
The steps in the general procedure of the proposed approach are shown in Figure 1.
Figure 1. Flow chart of the proposed approach
4.1 Description and modeling of the manufacturing process of Cement Plant of SCIMAT
To illustrate applicability of the proposed approach, we applied it to a cement manufacturing process at Société des ciments d'Aïn Touta (SCIMAT), part of the Groupe industrial des ciments d'Algérie (GICA). This sector was chosen as a case study for two main reasons. Firstly, cement sector is one
of contributing factors to economic country development, and secondly, accidents number recorded is considered high, despite certifications obtained.
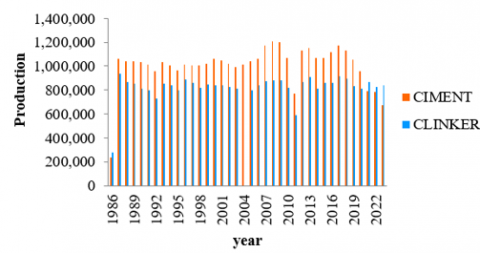
The cement plant studied, located in Batna in eastern Algeria, obtained certifications triptych, namely ISO 9001 (V1994) in 2000, then ISO 14001 in 2005, OSHAS 18001 (V2007) in 2014 and finally transition version 45000 2018. In addition to this triptych, plant obtained ISO 5001 (energy performance) certification in 2020, and embarked on the anti-corruption system (ISO 37001) in 2023, to be completed in 2024. Ain Touta cement plant is considered one of country's economic leaders. Cement produced covers national market, and is even exported to other countries, with remarkable growth in production between 1986 and 2024, as shown in Figure 2.
Figure 2. SCIMAT cement-clinker production
Cement manufacturing involves many techniques and technologies that require large human and material resources deployment. Cement manufacturing process can be divided into four huge stages which have the following roles:
•Raw material preparation,
•Flour cooking,
•Obtaining cement,
•Cement packaging and shipping.
Limestone extracted from quarry by felling is transported by dumpers until crusher. Crushed limestone is transported directly to storage hall to be then transported to hopper of raw crusher workshop using conveyor belts.
Crushed clay is stored in storage hall from where it is directly conveyed to raw mill feed hopper by conveyor belts.
Crushed sand individually is conveyed to raw mill workshop hopper by a conveyor belt.
The limestone (83%), clay (15%) and sand (1%) mixture is finely ground in a VRM vertical mill. Latter is equipped with a special lining to avoid materials alteration by any oxidizing matter. The drying of mixture inside mill is ensured by gases coming from oven. The product obtained after grinding, called raw flour, is sent directly to silo for homogenization and storage using a pneumatic transport pump. After homogenization, flour is sent to cooking workshop.
At the outlet of homogenization silo, flour will be conveyed to preheating tower, the raw flour meets hot gases coming out of oven. These same gases are evacuated into a conditioning tower then sucked by a fan through EP600 electrostatic filter which recovers dust by ionization.
Raw meal leaves the system (Preheating Tower) at a temperature of around of 300℃ to 380℃, during its movement in oven countercurrent the hot gases, the matter undergoes necessary chemical reactions.
Clinker is poured into cooler where it is cooled abruptly, then it is introduced into horizontal ball mill, with a quantity of gypsum (5%). This ground mixture gives cement which will be stored in silos. Finally, in the bulk loading workshop, consisting of a bagging machine, a palletizing system and a weighbridge for weighing trucks (bags and bulk).
To model cement manufacturing process, SADT formalism is used, as shown in Figure 3.
Figure 3. Cement production
4.2 Exploiting SADT and ORA-PHO combination at Scimat-Batna
The aim of first stage of our approach is to model company activities studied using SADT formalism, and to demonstrate contribution of latter to improve traditional ORA. The ORA can be fed with the necessary data and information from the SADT formalism, such as the sources of hazards that can lead to occupational risks and illnesses, and their effects on OHS. Table 5 shows the data relating to the different cement manufacturing activities provided by SADT for the improvement of ORA, demonstrating their complementarity.
Table 5. Data provided by SADT
|
Code |
Activity |
Hazardous Material / Equipment (Source of Danger) |
Risk |
|
A1 |
Raw's preparation - Limestone and clay extraction - Crush limestone and clay - Pre-homogenization - Flour grind - Homogenize and store |
- Raw materials (limestone, clay) - Crusher - Grinder - Homogenization silos - Dust - Hot gas |
- Chemical risk due to mixing of raw materials - Falls (of objects, height, ...) - Traffic risk - Ergonomic risk - Mechanical risk - Risks linked to physical environments - Noise, heat, cold, visibility…etc. - Atmospheric pollution |
|
A2 |
Flour's cooking - Preheating raw flour - Flour's Cooking - Clinker cooling |
- Flour - Natural gas - Warm material - Dust - Combustion gas - Preheating tower - ventilator of drawn - Cyclones - Oven - Cooler - Storage silos - Solid and liquid waste - Expired oils |
- Loss of containment - Loss of flame in the oven - Burner refractor cracks - Uncontrolled combustion - Clinker leak - Stopping fans can cause - Loss of flame in the oven - Fire and explosion - Occupational diseases (respiratory, skin and eye) - Atmospheric, soil, water pollution, etc. |
|
A3 |
Obtaining cement |
- Clinker - Gypsum - Horizontal - Crusher - Fans - Silos |
- Inhalation of dust |
|
A4 |
Storage and delivery |
- Shipping hall - Trucks - Moving carpet - Bagging machines and palletizers - Cement - Dust - Waste |
- Falls (full height and height) - Traffic risk - Ergonomic risk - Mechanical risk - Risks linked to physical atmospheres - Noise, heat, cold, visibility… etc. - Inhalation of dust |
The SATD and EvRP's combination methods as is presented in Figure 1, lies in complementarity of functional analysis methods and risk prevention methods. The SADT actigrams, which are communication tools modeling cement manufacturing process activities, show that these activities represented by SADT formalism boxes are supported by input data, transformed into output data. All of these input and output elements can constitute sources of danger and have harmful effects on workers’ health and safety and cause occupational diseases. In the case, for example, of “raw preparation” activity, which consists of extracting limestone and clay by adding iron ores and carrying out their pre-homogenization and initial grinding. The operating parameters are indicated such as the temperature setting, energy required for activity, transformation time and various checks to be carried out are specified. The activity supports, such as crushers, conveyors, grinders, hoppers, human operators are also indicated by SADT formalism. All these elements can constitute sources of danger for workers and cause work accidents. The outputs of this activity are in addition to homogenized raw flour, dust from hot gases (such as CO2 emissions) which can cause occupational diseases such as respiratory, skin and eye diseases.
Thus, the EvRP can be supplied with necessary data and information from SADT formalism, concerning different activities of a complex industrial process, the sources of danger and the risks and/or occupational diseases that may be generated by these activities as well as their effects on OHS. Table 5 shows data relating to different cement manufacturing activities provided by SADT for improvement of the EvRP, which proves their complementarity.
The second step in our approach is to estimate Human Operator's OHS risk-performance index. Risk and performance are assessed by applying Eqs. (1) and (2) respectively. Various parameters are estimated in consultation with company's managers and technicians.
The final stage of the proposed approach is reserved for drawing up the action plan and monitoring the implementation of solutions.
Workers at SCIMAT cement plant are exposed to numerous occupational hazards, which have been listed in the table (improved ORA results). Assessment of these risks in terms of probability, exposure, severity and availability of protective means, show that among risks identified, chemical, ergonomic and traffic risks are the highest risks to which workers are exposed during various cement production activities.
In fact, the raw meal preparation, cement production and packaging/shipping phases are the most critical where human intervention is indispensable, working conditions and means of prevention are inadequate or non-existent.
The results also reveal that workers are exposed to moderate risks, such as the physical environment (noise, thermal discomfort, lighting and dust inhalation) and the risks of falls from ground level and heights caused by poor working conditions.
Furthermore, the results obtained show that the performance of human operators within the cement plant varies from low to high. In fact, in the raw meal preparation phase, the performance of human operators is low, as the majority of workers are unmotivated; lack the necessary knowledge and skills, and the majority are not permanent workers.
However, in the cement production, packaging and shipping phases, the performance of human operators is average, requiring them to improve their skills and knowledge through training and improved working conditions, in order to motivate them further.
On the other hand, human operator performance is high in the flour-baking phase, where human operator tasks (intervention) are limited to inspection and supervision of the indicated phase.
In order to draw more comprehensive conclusions and explore other dimensions of results that are not directly apparent in Table 6, an in-depth analysis will be realised.
Table 6. Data required for correlation analysis
|
Activity |
Risk |
F |
E |
G |
N |
R |
M |
Km |
C |
POH |
|
A1 |
R1 |
4 |
4 |
3 |
1 |
48 |
3 |
2 |
2 |
12 |
|
R2 |
1 |
3 |
2 |
2 |
3 |
3 |
2 |
2 |
12 |
|
|
R3 |
4 |
4 |
2 |
2 |
16 |
3 |
2 |
3 |
18 |
|
|
R4 |
4 |
2 |
2 |
1 |
16 |
3 |
2 |
2 |
12 |
|
|
R5 |
4 |
3 |
2 |
2 |
12 |
3 |
2 |
3 |
18 |
|
|
R6 |
3 |
4 |
3 |
1 |
36 |
3 |
2 |
2 |
12 |
|
|
R7 |
4 |
4 |
2 |
1 |
32 |
2 |
2 |
3 |
12 |
|
|
A2 |
R8 |
3 |
2 |
2 |
2 |
6 |
2 |
1 |
2 |
4 |
|
R9 |
3 |
3 |
3 |
3 |
9 |
1 |
2 |
1 |
2 |
|
|
R10 |
1 |
3 |
4 |
2 |
6 |
2 |
2 |
1 |
4 |
|
|
R11 |
3 |
3 |
2 |
3 |
6 |
2 |
1 |
1 |
2 |
|
|
A3 |
R12 |
4 |
4 |
3 |
1 |
48 |
2 |
2 |
2 |
8 |
|
A4 |
R13 |
4 |
4 |
2 |
1 |
32 |
3 |
2 |
1 |
6 |
|
R14 |
4 |
3 |
1 |
2 |
6 |
2 |
2 |
1 |
4 |
|
|
R15 |
4 |
3 |
2 |
2 |
12 |
3 |
2 |
1 |
6 |
|
|
R16 |
3 |
3 |
4 |
2 |
18 |
2 |
3 |
1 |
6 |
|
|
R17 |
3 |
3 |
3 |
3 |
9 |
2 |
2 |
2 |
8 |
Table 6 highlights several parameters influencing risk overall score R and POH for each identified activity. This allowed us to construct an enriched table, including several variables in order to explore in depth relationships between these variables. This data exploration aims to highlight specific relationships or trends, in particular by identifying whether certain variables significantly influence R and POH, which would help to validate and confirm results presented in Table 6.
For this purpose, a correlation analysis between variables and to see how different variables interact is carried out. This helps to identify which variables strongly influence $R$ and $P_{O H}$ and provide assistance for working conditions improvement in terms of OSH and recommend actions to reduce risks in well-targeted ways.
It serves also indirectly to validate whether the expected logical relationships are confirmed in our data.
Correlation analysis can therefore:
-Identify key relationships between variables $\left(f, E, G, N, R, K_m, C, M, P_{O H}\right)$.
-Use of correlation matrix to highlight significant relationships.
To calculate correlation coefficients between variables $\left(f, E, G, N, R, K_m, C, M, P_{O H}\right)$, data the results provided can be used.
Table 6 is constructed that groups together data needed for correlation analysis. Each row represents an activity as well as the risks associated with it, while columns detail the different parameters allowing risk estimation R and performance POH.
This organized structure aims to provide a clear and systematic view for data analysis.
Pearson correlation coefficient is calculated using the following formula:
$r(x, y)=\frac{\operatorname{Cov}(x, y)}{\sigma_x \sigma_y}$ (3)
where,
$\operatorname{cov}(x, y)$: is the covariance.
$\sigma_x$: is the standard deviation of $x$.
$\sigma_y$: is the standard deviation of $y$.
Result gives the correlation matrix of the form given in Table 7.
Table 7. Correlation matrix
|
F |
E |
G |
N |
R |
M |
Km |
C |
POH |
|
|
F |
1,00 |
0,27 |
-0,42 |
-0,36 |
0,47 |
0,20 |
0,04 |
0,27 |
0,27 |
|
E |
0,27 |
1,00 |
0,13 |
-0,43 |
0,73 |
0,21 |
0,27 |
0,24 |
0,33 |
|
G |
-0,42 |
0,13 |
1,00 |
0,04 |
0,23 |
-0,29 |
0,45 |
-0,22 |
-0,17 |
|
N |
-0,36 |
-0,43 |
0,04 |
1,00 |
-0,76 |
-0,52 |
-0,24 |
-0,31 |
-0,41 |
|
R |
0,47 |
0,73 |
0,23 |
-0,76 |
1,00 |
0,25 |
0,24 |
0,25 |
0,29 |
|
M |
0,20 |
0,21 |
-0,29 |
-0,52 |
0,25 |
1,00 |
0,10 |
0,36 |
0,68 |
|
Km |
0,04 |
0,27 |
0,45 |
-0,24 |
0,24 |
0,10 |
1,00 |
-0,05 |
0,25 |
|
C |
0,27 |
0,24 |
-0,22 |
-0,31 |
0,25 |
0,36 |
-0,05 |
1,00 |
0,86 |
|
POH |
0,27 |
0,33 |
-0,17 |
-0,41 |
0,29 |
0,68 |
0,25 |
0,86 |
1,00 |
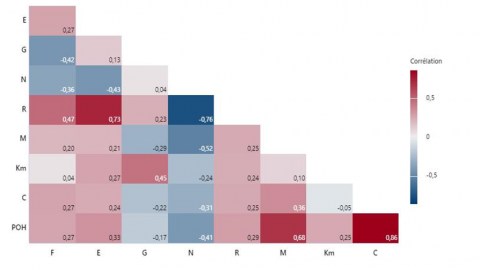
The matrix shows relationships between different variables, expressed by Pearson correlation coefficient. Values close to +1 indicate a strong positive correlation, while those close to -1 show a strong negative correlation. Values close to 0 suggest an absence of a significant relationship. A graphical visualisation (Figure 4) is also provided to aid interpretation of key correlations, highlighting significant relationships that could influence the analysis results.
Figure 4. Correlogram illustrating the correlations between variables
A positive linear relationship exists between variables frequency of occurrence (F) and risk (R), as well as between exposure rate (E) and risk (R). The Pearson correlation coefficients for these pairs are 0.47 and 0.73, respectively. These values indicate a moderate to strong positive relationship between the variables, suggesting that frequent events and increased exposure are generally associated with a higher risk level.
A negative linear relationship is observed between level of protection (N) and the risk (R) with a Pearson correlation coefficient of -0.76. This value indicates a strong and negative relationship, meaning that as the level of protection increases, the risk decreases, which highlights the importance of protective measures to mitigate risks.
Regarding performance parameters a positive linear relationship is also present between competence (C) and human performance POH, as well as between motivation and human performance POH. The correlation coefficients for these pairs are 0.86 and 0.68, respectively. These values indicate a strong relationship between these variables, highlighting that high skills and increased motivation are key factors in improving human operator performance.
Results of this analysis provide valuable guidance for prioritizing actions based on identified correlations. Prioritization is based on correlation coefficient: stronger correlation, the more factor concerned becomes a priority for action.
Thus, two main fronts emerge. On one hand, it is essential to reduce risks through improved management of frequency, exposure and protection levels. On other hand, improving human performance requires investments in skills, motivation and knowledge of operators. By acting in a targeted manner on these two axes, we can optimize both safety and performance of human operators.
Furthermore, the proposed approach can have different impacts on working conditions improvement:
-The involvement of workers in OHS programs development allows them to benefit from their practical expertise, which facilitates identification, control and management of risks and thus creates a positive dynamic of prevention within company.
-The adoption of negotiated and tested solutions allows a reduction in work accidents and work stoppages, workers empowerment and an increase in productivity.
In this work we presented a hybrid approach to improve classical approach of occupational risk assessment. The proposed hybrid approach consists in combining several methods to identify, assess occupational risks and allocate resources and security measures in an optimal manner. The advantage of hybrid approach is to benefit from advantages of combined methods while mitigating their disadvantages.
In this work, we firstly combined SADT method to model a complex industrial process by identifying all necessary steps to carry out this process, which gives a more representative model and a better understanding of the process studied. All information collected during this analysis phase is provided to EvRP in order to assess occupational risks to which workers are exposed. Then, key factors of human operator's performance are taken into consideration in this assessment, which helps to motivate workers, provide a sense of security and be more efficient.
Results of applying this model to a cement manufacturing process show its great applicability and its interest in offering, occupational risk managers to, sociotechnical approach.
The proposed hybrid approach to occupational risk assessment appears to be a promising alternative. It is a flexible approach, easy to adapt in order to quickly respond to business requirements. It also provides a means of communication and collaboration between different teams, leading to better occupational risks management and best objectives alignment.
However, the proposed approach also has its limitations; results obtained can be considered in a certain sense as partial because only occupational risks impact on OSH was studied. The proposed approach must consider other impacts such as economic and environmental impacts of these risks. Furthermore, since the estimation of human performance parameters are based on expert opinions. Epistemic uncertainties problem arises. To remedy this, artificial intelligence techniques integration is necessary.
|
ORA |
Occupational Risk Assessment |
|
OHS |
Occupational health and safety |
|
ILO |
International Labour Office |
|
SADT |
Structured Analysis and Design Technique |
|
PHO |
Human operator performance |
|
R |
Risk |
|
SCIMAT |
Société des Ciments d'Aïn Touta |
|
GICA |
Groupe industriel des ciments d'Algérie |
[1] Abdelatif, A., Rachid, C., Smain, A., Ion, V. (2015). Promoting a sustainable organizational culture in a company: The National Railway Transport Company. Journal of Rail Transport Planning & Management, 5(1): 23-30. https://doi.org/10.1016/j.jrtpm.2015.01.001
[2] Revilla, A.J., Perez-Luno, A., Nieto, M.J. (2016). Does family involvement in management reduce the risk of business failure? The moderating role of entrepreneurial orientation. Family Business Review, 29(4): 365-379. https://doi.org/10.1177/0894486516671075
[3] Kharzi, R., Chaib, R., Verzea, I., Akni, A. (2020). A Safe and Sustainable Development in a hygiene and healthy company using decision matrix risk assessment technique: A case study. Journal of Mining and Environment, 11(2): 363-373. https://doi.org/10.22044/jme.2020.9156.1807
[4] Bakhuys Roozeboom, M.C., Wiezer, N.M., Boot, C.R., Bongers, P.M., Schelvis, R.M. (2021). Use of intervention mapping for occupational risk prevention and health promotion: A systematic review of literature. International Journal of Environmental Research and Public Health, 18(4): 1775. https://doi.org/10.3390/ijerph18041775
[5] Tremblay, A., Badri, A. (2018). Assessment of occupational health and safety performance evaluation tools: State of the art and challenges for small and medium-sized enterprises. Safety Science, 101: 260-267. https://doi.org/10.1016/j.ssci.2017.09.016
[6] Figueroa-Maldonado, J., Herrera-Franco, G., Moreno-Alcívar, L., Bravo-Montero, L. (2024). Comparative analysis of methodologies for occupational safety risk assessment in an artisanal woodworking industry. International Journal of Safety & Security Engineering, 14(6): 1825-1835. https://doi.org/10.18280/ijsse.140617
[7] Bouzerara, R., Chaib, R., Verzea, I. (2023). For better governance of harmfulness in companies: A case study. Procedia Structural Integrity, 48: 4-11. https://doi.org/10.1016/j.prostr.2023.07.103
[8] Gamboa-Sánchez, M.C., Cotrina-Teatino, M.A., Vega-Gonzalez, J.A., Noriega-Vidal, E.M., Arango-Retamozo, S.M., Marquina-Araujo, J.J. (2024). Effective critical risk management in welding operations for mining: A case study on incident reduction. International Journal of Safety & Security Engineering, 14(4): 1039-1047. https://doi.org/10.18280/ijsse.140403
[9] Madlool, N.A., Saidur, R., Hossain, M.S., Rahim, N.A. (2011). A critical review on energy use and savings in the cement industries. Renewable and Sustainable Energy Reviews, 15(4): 2042-2060. https://doi.org/10.1016/j.rser.2011.01.005
[10] Pelser, T., Kriegler, J., Prinsloo, H. (2014). Key management practices within the South African department of labour and SETAS. Mediterranean Journal of Social Sciences, 5(1): 303-311. https://doi.org/10.5901/mjss.2014.v5n1p303
[11] Alsultanny, Y., AlZuhair, S. (2019). Evaluating influence of technology readiness factors on the Saudi cement companies market and financial based performance. Journal of Science and Technology Policy Management, 10(2): 360-370. https://doi.org/10.1108/JSTPM-09-2017-0047
[12] Cadieux, J., Roy, M., Desmarais, L. (2006). A preliminary validation of a new measure of occupational health and safety. Journal of Safety Research, 37(4): 413-419. https://doi.org/10.1016/j.jsr.2006.04.008
[13] Fernández-Muñiz, B., Montes-Peón, J.M., Vázquez-Ordás, C.J. (2007). Safety culture: Analysis of the causal relationships between its key dimensions. Journal of Safety Research, 38(6): 627-641. https://doi.org/10.1016/j.jsr.2007.09.001
[14] Budhwar, P.S., Saini, D.S., Bhatnagar, J. (2005). Women in management in the new economic environment: The case of India. Asia Pacific Business Review, 11(2): 179-193. https://doi.org/10.1080/1360238042000291199
[15] Mbelambela, E.P., Eitoku, M., Muchanga, S.M.J., Villanueva, A.F., et al. (2018). Prevalence of chronic obstructive pulmonary disease (COPD) among Congolese cement workers exposed to cement dust, in Kongo Central Province. Environmental Science and Pollution Research, 25: 35074-35083. https://doi.org/10.1007/s11356-018-3401-4
[16] Mutetwa, B., Moyo, D., Brouwer, D. (2022). Job exposure matrix for chrysotile asbestos fibre in the asbestos cement manufacturing (ACM) industry in Zimbabwe. International Journal of Environmental Research and Public Health, 19(5): 2680. https://doi.org/10.3390/ijerph19052680
[17] Gore, B.F., Smith, J.D. (2006). Risk assessment and human performance modelling: The need for an integrated systems approach. International Journal of Human Factors Modelling and Simulation, 1(1): 119-139. https://doi.org/10.1504/IJHFMS.2006.011685
[18] Perotti, S., Russo, M.C. (2018). Work-related fatal injuries in Brescia County (Northern Italy), 1982 to 2015: A forensic analysis. Journal of forensic and legal medicine, 58: 122-125. https://doi.org/10.1016/j.jflm.2018.06.002
[19] Karanikas, N., Weber, D., Bruschi, K., Brown, S. (2022). Identification of systems thinking aspects in ISO 45001: 2018 on occupational health & safety management. Safety Science, 148: 105671. https://doi.org/10.1016/j.ssci.2022.105671
[20] Abukhashabah, E., Summan, A., Balkhyour, M. (2020). Occupational accidents and injuries in construction industry in Jeddah city. Saudi Journal of Biological Sciences, 27(8): 1993-1998. https://doi.org/10.1016/j.sjbs.2020.06.033
[21] Khan, F.I., Abbasi, S.A. (1999). The world's worst industrial accident of the 1990s what happened and what might have been: A quantitative study. Process Safety Progress, 18(3): 135-145. https://doi.org/10.1002/prs.680180304
[22] Khan, F.I., Abbasi, S.A. (1999). Major accidents in process industries and an analysis of causes and consequences. Journal of Loss Prevention in the process Industries, 12(5): 361-378. https://doi.org/10.1016/S0950-4230(98)00062-X
[23] Khan, F.I., Abbasi, S.A. (2001). Risk analysis of a typical chemical industry using ORA procedure. Journal of Loss Prevention in the Process Industries, 14(1): 43-59. https://doi.org/10.1016/S0950-4230(00)00006-1
[24] Berglund, L., Johansson, J., Johansson, M., Nygren, M., Stenberg, M. (2023). Safety culture development in the construction industry: The case of a safety park in Sweden. Heliyon, 9(9): e18679. https://doi.org/10.1016/j.heliyon.2023.e18679
[25] Abudayyeh, O., Fredericks, T.K., Butt, S.E., Shaar, A. (2006). An investigation of management’s commitment to construction safety. International Journal of Project Management, 24(2): 167-174. https://doi.org/10.1016/j.ijproman.2005.07.005
[26] Vinodkumar, M.N., Bhasi, M.J.S.S. (2009). Safety climate factors and its relationship with accidents and personal attributes in the chemical industry. Safety Science, 47(5): 659-667. https://doi.org/10.1016/j.ssci.2008.09.004
[27] Hale, A., Borys, D. (2013). Working to rule, or working safely? Part 1: A state of the art review. Safety Science, 55: 207-221. https://doi.org/10.1016/j.ssci.2012.05.011
[28] Xu, C., Guo, L., Wang, K., Yang, T., et al. (2023). Current challenges of university laboratory: Characteristics of human factors and safety management system deficiencies based on accident statistics. Journal of Safety Research, 86: 318-335. https://doi.org/10.1016/j.jsr.2023.07.010
[29] Yang, J.F., Wang, P.C., Liu, X.Y., Bian, M.C., et al. (2023). Analysis on causes of chemical industry accident from 2015 to 2020 in Chinese mainland: A complex network theory approach. Journal of Loss Prevention in the Process Industries, 83: 105061. https://doi.org/10.1016/j.jlp.2023.105061
[30] Hu, Z., Chan, W.T., Hu, H. (2023). Characterizing the relationship between personality traits and safety motivation among construction workers. Heliyon, 9(10): e20370. https://doi.org/10.1016/j.heliyon.2023.e20370
[31] Basahel, A.M. (2021). Safety leadership, safety attitudes, safety knowledge and motivation toward safety-related behaviors in electrical substation construction projects. International Journal of Environmental Research and Public Health, 18(8): 4196. https://doi.org/10.3390/ijerph18084196
[32] Ak, M.F., Yucesan, M., Gul, M. (2022). Occupational health, safety and environmental risk assessment in textile production industry through a Bayesian BWM-VIKOR approach. Stochastic Environmental Research and Risk Assessment, 36(2): 629-642. https://doi.org/10.1007/s00477-021-02069-y
[33] Curcuruto, M., Conchie, S.M., Mariani, M.G., Violante, F.S. (2015). The role of prosocial and proactive safety behaviors in predicting safety performance. Safety Science, 80: 317-323. https://doi.org/10.1016/j.ssci.2015.07.032
[34] Min, Y., Yexiang, F., Weilin, T., Jiajie, Z. (2020). Study on safety behavior planning theory and control strategies for coal chemical workers. Safety Science, 128: 104726. https://doi.org/10.1016/j.ssci.2020.104726
[35] Tong, R., Li, H., Zhang, B., Yang, X., Ma, X. (2021). Modeling of unsafe behavior risk assessment: A case study of Chinese furniture manufacturers. Safety Science, 136: 105157. https://doi.org/10.1016/j.ssci.2020.105157
[36] Wang, C., Wang, J., Wang, X., Yu, H., Bai, L., Sun, Q. (2019). Exploring the impacts of factors contributing to unsafe behavior of coal miners. Safety Science, 115: 339-348. https://doi.org/10.1016/j.ssci.2019.02.003
[37] Yang, J., Ye, G., Xiang, Q., Kim, M., Liu, Q., Yue, H. (2021). Insights into the mechanism of construction workers’ unsafe behaviors from an individual perspective. Safety Science, 133: 105004. https://doi.org/10.1016/j.ssci.2020.105004
[38] Yu, K., Cao, Q., Xie, C., Qu, N., Zhou, L. (2019). Analysis of intervention strategies for coal miners' unsafe behaviors based on analytic network process and system dynamics. Safety Science, 118: 145-157. https://doi.org/10.1016/j.ssci.2019.05.002
[39] DeJoy, D.M., Gershon, R.R., Schaffer, B.S. (2004). Safety climate: Assessing management and organizational influences on safety. Professional Safety, 49(7): 50-57.
[40] Katzell, R.A., Thompson, D.E. (1990). An integrative model of work attitudes, motivation, and performance. Human Performance, 3(2): 63-85. https://doi.org/10.1207/s15327043hup0302_1
[41] Fernández-Muñiz, B., Montes-Peón, J.M., Vázquez-Ordás, C.J. (2017). The role of safety leadership and working conditions in safety performance in process industries. Journal of Loss Prevention in the Process Industries, 50: 403-415. https://doi.org/10.1016/j.jlp.2017.11.001
[42] Rodríguez, C.G.L., Cárdenas, C.A.R. (2023). Diagnóstico de salud ocupacional en la empresa de curtiembres Cueros JCG.Ciencia, Innovación, Tecnología, Ambiente y Sociedad. https://doi.org/10.15332/24224529.7255
[43] Ross, D.T. (1977). Structured analysis (SA): A language for communicating ideas. IEEE Transactions on Software Engineering, SE-3(1): 16-34. https://doi.org/10.1109/TSE.1977.229900
[44] Dickover, M.E., McGowan, C.L., Ross, D.T. (1977). Software design using: SADT. In Proceedings of the 1977 Annual Conference, Seattle, Washington, USA, pp. 125-133. https://doi.org/10.1145/800179.810192
[45] Dašić, V.Š.P., Labović, R.J.D. (2009). Functional and information modeling of production using IDEF methods. Journal of Mechanical Engineering, 55(2): 131-140.
[46] Santarek, K., Buseif, I.M. (1998). Modelling and design of flexible manufacturing systems using SADT and Petri nets tools. Journal of Materials Processing Technology, 76(1-3): 212-218. https://doi.org/10.1016/S0924-0136(97)00350-6
[47] Congram, C., Epelman, M. (1995). How to describe your service: An invitation to the structured analysis and design technique. International Journal of Service Industry Management, 6(2): 6-23. https://doi.org/10.1108/09564239510084914
[48] Kim, C.H., Weston, R.H., Hodgson, A., Lee, K.H. (2003). The complementary use of IDEF and UML modelling approaches. Computers in Industry, 50(1): 35-56. https://doi.org/10.1016/S0166-3615(02)00145-8
[49] Whitman, L., Huff, B., Presley, A. (1997). Structured models and dynamic systems analysis: The integration of the IDEF0/IDEF3 modeling methods and discrete event simulation. In Winter Simulation Conference Proceedings, Atlanta, GA, USA, pp. 518-524. https://doi.org/10.1145/268437.268559
[50] Ahmed, F., Robinson, S., Tako, A.A. (2014). Using the structred analysis and design technique (SADT) in simulation conceptual modeling. In Proceedings of the Winter Simulation Conference 2014, Savannah, GA, USA, pp. 1038-1049. https://doi.org/10.1109/WSC.2014.7019963
[51] Kusyi, Y., Lychak, O., Topilnytskyy, V., Bošanský, M. (2019). Development of the finishing and strengthening technological operations using SADT-technologies. Ukrainian Journal of Mechanical Engineering and Materials Science, 5(3-4): 57-69 https://doi.org/10.23939/ujmems2019.03-04.057
[52] Godderis, L., Lenderink, A. (2016). SIGNAAL: Outil en ligne pour la déclaration et l’évaluation de nouveaux risques professionnels pour la santé aux Pays-Bas et en Belgique. Archives des Maladies Professionnelles et de l'Environnement, 77(3): 436. https://doi.org/10.1016/j.admp.2016.03.189
[53] Nahrgang, J.D., Morgeson, F.P., Hofmann, D.A. (2011). Safety at work: a meta-analytic investigation of the link between job demands, job resources, burnout, engagement, and safety outcomes. Journal of Applied Psychology, 96(1): 71-94. https://doi.org/10.1037/a0021484
[54] Neal, A., Griffin, M.A. (2002). Safety climate and safety behaviour. Australian Journal of Management, 27(1_suppl): 67-75. https://doi.org/10.1177/031289620202701S08
[55] Mousavi, S.S., Khani Jazani, R., Cudney, E.A., Trucco, P. (2020). Quantifying the relationship between lean maturity and occupational health and safety: Antecedents and leading indicators. International Journal of Lean Six Sigma, 11(1): 150-170. https://doi.org/10.1108/IJLSS-04-2018-0043
[56] Neal, A., Griffin, M.A. (2006). A study of the lagged relationships among safety climate, safety motivation, safety behavior, and accidents at the individual and group levels. Journal of Applied Psychology, 91(4): 946-953. https://doi.org/10.1037/0021-9010.91.4.946
[57] Reiman, T., Pietikäinen, E. (2012). Leading indicators of system safety–monitoring and driving the organizational safety potential. Safety Science, 50(10): 1993-2000. https://doi.org/10.1016/j.ssci.2011.07.015
[58] Abdullah, I.N., Malek, J.A., Abd Manaf, A. (2019). Formulating strategic management in social capital within gated and guarded community to achieve social well-being. Academy of Strategic Management Journal, 18(3): 1-7.