Wahyu Setyaningsih*![]() | Purnomo Adi Saputro
| Purnomo Adi Saputro![]() | Ariyani Indrayati
| Ariyani Indrayati![]() | Edi Kurniawan
| Edi Kurniawan![]() | Mohammad Syifauddin
| Mohammad Syifauddin![]() | Visen Wijaya
| Visen Wijaya![]() | Hanifah Mahat
| Hanifah Mahat![]()
© 2024 The authors. This article is published by IIETA and is licensed under the CC BY 4.0 license (http://creativecommons.org/licenses/by/4.0/).
OPEN ACCESS
As a city located in the northern coast of Central Java, Semarang continuously faces serious challenges related to annual tidal flooding. This research specifically examines the multi-temporal distribution of tidal floods in the 2020-2024 time span. Using the Change Detection method on Sentinel-1 SAR satellite imagery, the distribution of tidal flooding during this period was determined. The data obtained was then further processed with overlay techniques to produce more detailed information. This technique allows for mapping areas with different levels of tidal flood vulnerability, and the overlay results were used as one of the parameters in the Composite Mapping Analysis (CMA) method, which integrates various related parameters. The results point out that the coastal areas of Semarang City, including the sub-districts of Tugu, West Semarang, North Semarang, East Semarang, Gayamsari, and Genuk, are dominated by high vulnerability levels. These areas have a high vulnerability percentage of 40%, covering an area of 4,988.65 hectares. Medium vulnerability includes 33% of the area with 4,080.01 hectares, while low vulnerability covers 23% with 2,802.22 hectares. Areas with very high vulnerability only incorporates 3.9% with an area of 481.40 hectares, and the lowest is very low vulnerability at 0.1% with an area of 10.39 hectares. The sub-districts most affected by high vulnerability are Genuk, Tugu, West Semarang, North Semarang, Gayamsari, and East Semarang in succession.
tidal flood, disaster, coastal, geographic information system (GIS), google earth engine
Coastal areas, rich in natural resources and offering tremendous economic potential, can become centers of life and growth if managed properly [1, 2]. These areas serve as habitats for various marine species, sources of food for surrounding communities, and hubs for economic and social activity [3]. The coastal city of Semarang in Central Java presents numerous development opportunities. Its natural beauty, including beaches and mangrove forests, makes it an ideal location for tourism. In addition, the region’s marine biodiversity offers significant potential for the fishing industry. However, it is crucial to ensure that development is conducted in a sustainable and environmentally friendly manner so that the benefits can be enjoyed by both current and future generations [4].
Despite the great potential of coastal areas and the goal of sustainable development, Semarang’s coastal region faces various challenges, one of which is the recurring issue of tidal flooding [5]. Tidal flooding is a natural phenomenon that occurs when seawater rises and encroaches onto land [6]. This phenomenon frequently affects coastal areas, with significant impacts on both human lives and the environment [7]. In Semarang, tidal flooding has become a serious and persistent issue [8]. The increasing frequency of tidal flooding each year indicates the urgent need to find effective and sustainable solutions [9].
Tidal flooding in Semarang, caused by rising seawater flooding the land, is influenced by several interrelated factors. The primary contributors to tidal floods include tidal surges driven by seasonal changes, coastal abrasion, and land subsidence [10]. Land subsidence in Semarang occurs due to the excessive extraction of groundwater, which compacts the soil and leads to subsidence [11]. Additionally, global warming, which raises surface temperatures, plays a role in tidal flooding. The melting of polar ice caps and the subsequent increase in seawater volume results in higher sea levels, further exacerbating flooding. Coastal reclamation carried out in Semarang during the 1990s also affected the coastline. This reclamation led to coastal abrasion (or beach erosion) and the narrowing of land areas. The most severe tidal flooding occurred in 2022, with an inundation area of 478 hectares [12, 13]. Land subsidence in Semarang is most severe in the sub-districts of Genuk, Pedurungan, and Semarang Utara, with subsidence rates of 10.35 cm/year, 8.31 cm/year, and 8.23 cm/year, respectively [14]. This subsidence worsens tidal flooding, as the sinking land allows seawater to flood more easily [15]. According to the historical data archieved in Kompas, tidal flooding in Semarang first occurred on May 4, 1997, and since then, it has almost routinely inundated the coastal areas of Semarang every year up to the present. The quality of embankment construction and maintenance also plays a critical role in mitigating the impact of tidal floods. Well-constructed and properly maintained embankments can hold back seawater and reduce flood damage. However, poorly maintained embankments are more susceptible to damage and less effective at preventing flooding, leading to more severe tidal floods. Additionally, the effectiveness of the early warning system influences the outcome of tidal flooding events [16]. A well-functioning early warning system can alert communities to impending floods, allowing them to prepare and evacuate. In contrast, a malfunctioning or ineffective system leaves communities unprepared, increasing the likelihood of sudden, unanticipated tidal floods in vulnerable areas [17].
The growing severity of the tidal flood problem highlights the need for a sustainable approach to manage and prevent this disaster in the long term [18]. Recent technological advancements, particularly in GIS, have created new opportunities to address environmental issues, including tidal flooding. GIS is capable of visualizing and analyzing large-scale geospatial data [19], making it an effective tool for understanding and tackling tidal flooding. One of the most widely used GIS platforms in environmental research is Google Earth Engine. This platform enables users to visualize and analyze vast amounts of geospatial data [20]. Researchers can utilize Google Earth Engine to identify patterns and distributions of tidal flooding using Change Detection, as well as to assess its impacts on the environment and surrounding communities [21]. The availability of GIS technology has made mapping tidal floods over specific periods increasingly vital [22].
2.1 Research design and focus
This research is a quantitative study utilizing a spatiotemporal approach. It aims to analyze the distribution of flooding and identify areas prone to tidal flooding in Semarang City. The novelty of this research lies in the application of the Change Detection method on Sentinel-1 SAR images to obtain spatial and temporal data from 2020 to 2024. Data processing is conducted using the Google Earth Engine online platform to determine the flood area for the study period accurately.
Previous studies have employed conventional methods, such as using a Digital Elevation Model (DEM) combined with tidal data for the specified time frame [3]. While more modern analyses, such as NDWI, have utilized regular images like Landsat 8 or Sentinel-2A to detect flood inundation, some have also used Sentinel-1 SAR images for inundation detection. However, the application of multi-temporal analysis remains relatively rare [23].
2.2 Research location
The research site is located in the coastal area of Semarang City, Central Java, Indonesia. This area was selected due to its frequent experiences of tidal flooding, which significantly impacts the lives and livelihoods of local communities, as well as infrastructure and the environment. The selection was also based on the intensity of tidal flooding, which occurs almost every year on a recurring basis.
This study focuses on the distribution of tidal flooding in Semarang City over the past five years. It involved collecting historical data on tidal flooding and analyzing changes over time. The study covers areas within Semarang City's administrative boundaries to facilitate future policy analysis, although it is important to note that tidal flooding does not recognize these administrative boundaries.
2.3 Data collection sources, techniques, and tools
The data sources for this study include historical data on tidal flooding, spatial data, and satellite imagery. Historical data can be obtained from various sources, including government reports, prior studies, and observational records—which act as initial references for limiting the period of tidal flooding as the research started. After that, the time range was matched with the recorded data from Sentinel-1 SAR, which was subsequently processed annually for 2020, 2021, 2022, 2023, and 2024 (refer to Table 1). Sentinel-1 SAR satellite images are accessible through various European Union satellite image provider platforms, particularly Copernicus EU [24].
Table 1. Sources and data utilized in assessing tidal flood vulnerability
|
No. |
Data |
Data Type |
Data Source |
Year |
|
1. |
Tidal Flood Inundation |
Sentinel-1 SAR |
ESA Copernicus |
2020-2024 |
|
2. |
Coastline Distance |
Indonesia’s Landforms |
BIG |
2024 |
|
3. |
Distance from River |
Indonesia’s Landforms |
BIG |
2024 |
|
4. |
Land subsidence |
Sentinel-1 SAR |
ESA Copernicus |
2020 and 2024 |
|
5. |
Land Cover |
Sentinel-2 A |
ESA Copernicus |
2024 |
|
6. |
Land Elevation |
National DEM |
BIG |
2024 |
|
7. |
Rainfall |
Rain Intensity |
CHIRPS |
2020-2024 |
Data collection techniques involved the use of GIS technology and the analysis of Sentinel-1 SAR satellite imagery from 2020 to 2024. GIS technology was employed to visualize spatial data and understand the distribution of tidal flooding [25]. Satellite image analysis facilitated the examination of changes in tidal flooding distribution over time. Sentinel-1 SAR was chosen because it uses radar data as the basis for its satellite imagery. Radar data can capture waves reflected from the Earth's surface, resulting in clearer and more accurate images. This technology is far superior to imagery that relies solely on color tones or temperature, which can be disrupted by objects such as clouds. Therefore, even with visual obstructions, radar data can still produce detailed and informative images.
The tools used for data collection included a GIS processing tool, specifically Google Earth Engine. GIS software was utilized to process and visualize spatial data, while the remote sensing platform was used to access and analyze satellite imagery.
The temporal distribution data of tidal flooding would be used as one of the parameters for CMA once it was obtained. This data would be processed alongside other CMA parameters.
The parameters of tidal flood distribution over time, which have been processed into tidal flood inundation accumulation, were scored using the CMA method and an Overlay process to determine vulnerability levels using the ArcGIS application.
2.4 Data validity and data analysis
The validity of the data was ensured through a comprehensive validation process. Validation methods included in-depth interviews with local communities and field observations. These interviews provided insights into actual conditions on the ground, while field observations verified data and analysis results. The information was then compiled and aligned with the map created for the most recent year of tidal flooding. The resulting maps were subsequently generalized for accuracy based on previous years.
Data analysis was conducted using the Change Detection method, which involves comparing conditions before and after flooding using the Ratio Image (RI). The algorithm used is as follows [26]. The steps or flow in this research are shown in Figure 1.
Figure 1. Research flowchart
$R I=\frac{\sigma \mathrm{vv}( { Flood })}{\mathrm{i} \sigma \mathrm{vv}( { Preflood })}$
Description:
RI: Ratio Image
σ vv (Flood): Spectral reflectance during flood
$i \sigma$ vv (Preflood): Spectral reflectance before flood
The next stage is to apply a threshold, which involves identifying flooded areas by determining the values of flooded and non-flooded objects. Once the flood areas are identified, masking is performed to isolate only the flooded regions [27].
The purpose of this analysis is to understand how the work distribution of tidal floods has changed over time, so that with the accumulated inundation obtained we can carry out detailed estimates that enable the identification of factors that may influence these changes in the future so that they can be said to be sustainable in the future for better planning [28].
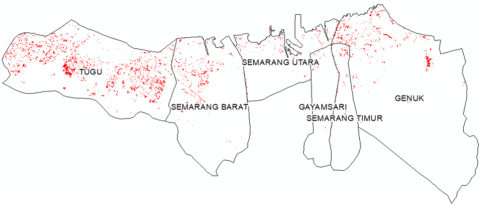
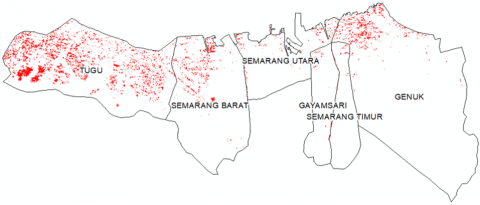
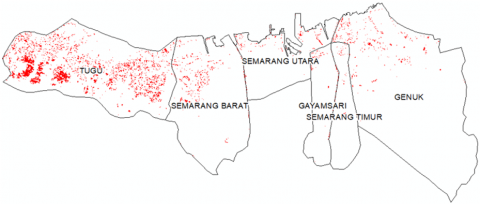
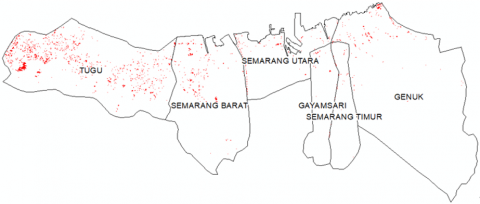
3.1 Tidal flood inundation detection using the change detection method
The detection of tidal flood inundation was conducted using the Google Earth Engine platform to process Sentinel-1 SAR satellite images. The method employed for this image processing is Change Detection, which involves analyzing radar images taken before and after flooding. The image processing was carried out temporally from 2020 to 2024 to determine the distribution of tidal flooding over five years, with the highest impact identified from each year’s detection. However, data for 2024 is available only up to the end of July.
The research area encompasses coastal sub-districts that have historically been affected by tidal floods, specifically Tugu, Semarang Barat, Semarang Utara, Gayamsari, Semarang Timur, and Genuk sub-districts. Figure 2 shows the results of the flood inundation detection processing.
Tidal flood 2020
2021
2022
2023
2024
Figure 2. Tidal flood detection processing result
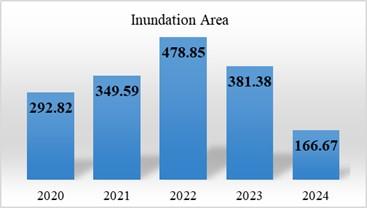
The results of tidal flood detection using Sentinel-1 SAR radar imagery, when visually represented for each year of observation, yield the results shown above. Based on the processing outcomes, data on inundation areas were also obtained; this data reflects the dynamic changes in tidal flood areas as captured by the radar. The inundation area data, presented in numerical form, is displayed in Table 2.
Table 2. Tidal flood inundation area
|
No. |
Year |
Inundation Area (Ha) |
|
1 |
2020 |
292,82 |
|
2 |
2021 |
349,59 |
|
3 |
2022 |
478,85 |
|
4 |
2023 |
381,38 |
|
5 |
2024 |
166,67 |
The data on tidal flood areas in the coastal region of Semarang City from 2020 to 2024 show that over these five years, the extent of tidal floods has fluctuated but consistently experiences tidal flooding. When displayed visually, it would appear in Figure 3.
Figure 3. Graph of annual rainfall for the years 2020-2024
Based on the data above, the highest detected tidal flood inundation occurred in 2022, with an area of 478.85 hectares, while the lowest was recorded in 2024, with an area of 166.67 hectares.
3.2 Tidal flood detection survey results
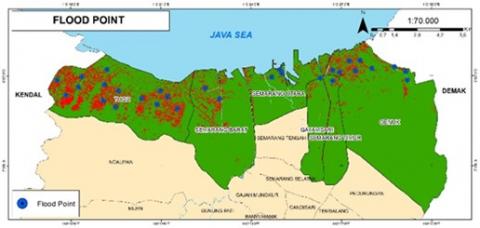
Field surveys were conducted to validate the tidal flood detection results by visiting flood-prone areas identified from the five years of tidal flood inundation data that had been overlaid. Areas and points that are prone to tidal flooding based on data processing can be seen in Figure 4.
Figure 4. Flood areas and points
Based on the data processing results regarding the detection of tidal flooding in Semarang City, several important findings have emerged. Six sub-districts were identified as being affected by tidal flooding and inundation: Genuk, Tugu, Semarang Barat, Semarang Utara, Semarang Timur, and Gayamsari. This research involved 30 flood points evenly distributed throughout the flood-affected areas and was supplemented by field validation through direct observation and interviews.
The results indicate that the impact of tidal flooding is most pronounced in Tugu, Semarang Utara, Semarang Barat, and, to a lesser extent, Genuk sub-districts. The significant impact underscores the need for more effective measures to mitigate risks to the community. Meanwhile, the success of the sea wall in the Semarang Barat sub-district serves as a positive example of infrastructure intervention in addressing the issue of tidal flooding. However, it is important to note that several northern sub-districts namely, most of Genuk, Semarang Timur, and Gayamsari do not currently experience tidal flooding. These areas continue to face challenges from water runoff during the rainy season. This situation highlights the need for a multifaceted approach to flood risk management that includes infrastructure improvements and sustainable water resource management.
3.3 Tidal flood vulnerability parameters
The flood inundation data created is used as one of the parameters to assess the vulnerability to tidal flooding in Semarang City. These parameters include flood inundation, distance from the coastline, distance from rivers, land subsidence, land cover, land elevation, and rainfall [29]. The method employed to understand the flood risk in Semarang City is Composite Mapping Analysis (CMA). This method involves spatial analysis by integrating various data, such as topography, rainfall, land use, and the condition of the drainage system, along with other factors that influence flood potential. With CMA, data from multiple sources are combined to produce more detailed flood vulnerability maps. These maps help identify flood-prone areas and their associated risk levels, which can be utilized for flood mitigation planning and decision-making related to area management [30]. The data and data sources used to determine the tidal flood vulnerability of Semarang City are as follows.
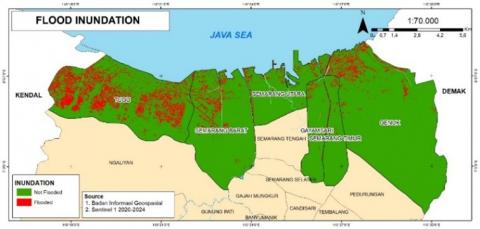
3.3.1 Flood inundation
The parameters used to measure tidal flood inundation are based on data created and processed using the Change Detection method from Sentinel-1SAR satellite imagery (refer to Figure 5). This method involves comparing the conditions of the area before and after flooding. Sentinel-1 SAR satellite imagery provides detailed information on land surface changes, allowing for the identification of areas inundated by tidal flooding. According to reference [27], this data processing is followed by overlaying the flood detection results over five years.
Figure 5. Flood inundation
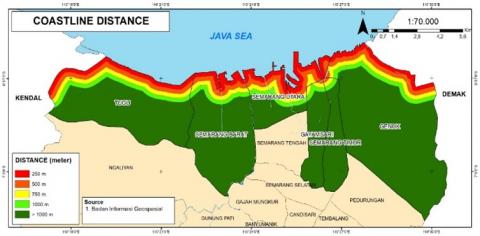
3.3.2 Coastline distance
The coastline distance parameter was determined using the multiple-ring buffer method in the ArcMap application. This coastline distance includes intervals of 250 m, 500 m, 750 m, 1000 m, and greater than 1000 m. The closer an area is to the coastline, the more vulnerable it is to flooding [31] (refer to Figure 6).
Figure 6. Coastline distance
3.3.3 Distance from river
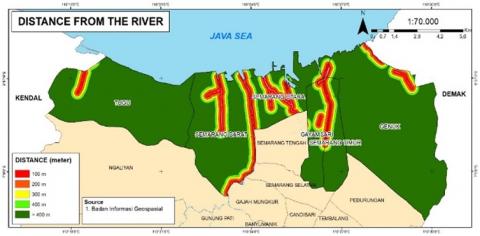
The distance from the river parameter was determined using the multiple-ring buffer method on the river network connected to the sea, processed with the ArcMap application. The distance categories include 100 m, 200 m, 300 m, 400 m, and greater than 400 m. The closer an area is to the river network, the more vulnerable it is to flooding [32] (refer to Figure 7).
Figure 7. Distance from the river
3.3.4 Land subsidence
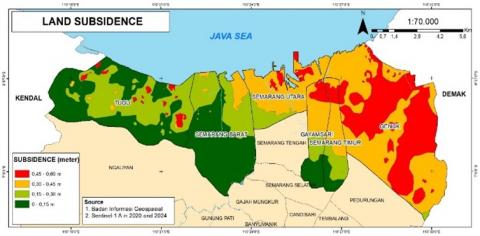
The land subsidence parameters were processed using Sentinel-1 SAR images from 2020 and 2024, employing the InSAR method with the SNAP application. The radar data from Sentinel-1 SAR is utilized to determine land subsidence in the research area from 2020 to 2024 [33] (refer to Figure 8).
Figure 8. Land subsidence
3.3.5 Land cover
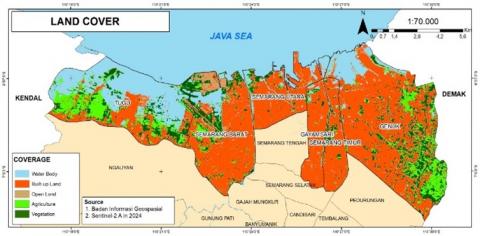
The land cover parameter is derived from the supervised classification of the Sentinel-2 A image. This classification is conducted to determine the land cover in the research area, resulting in categories such as water bodies, built-up land, open land, rice fields, and vegetation. The built-up land area in Semarang City is visually the most dominant, followed by bodies of water, vegetation, agricultural land or rice fields, and open land (refer to Figure 9).
Figure 9. Land cover
3.3.6 Land elevation
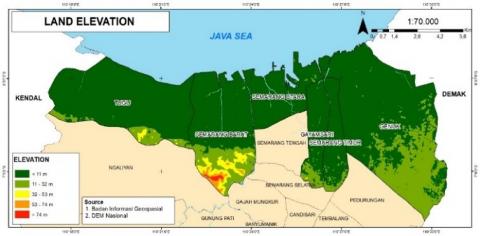
Land elevation is determined using National DEM data, which is initially in raster format and then converted into vector data to identify the area corresponding to each elevation level. Based on the research area, the data obtained includes elevation categories greater than 11 m, 11–32 m, 32–53 m, 53–74 m, and greater than 74 m. The lower the land elevation, the higher the vulnerability to tidal flooding [34] (refer to Figure 10).
Figure 10. Land elevation
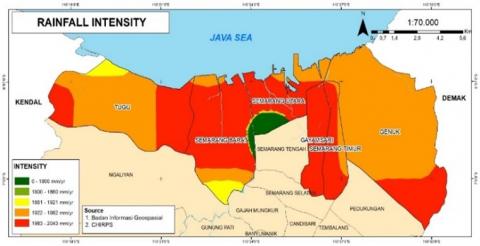
3.3.7 Rainfall
The rainfall parameter used in this analysis of tidal flood vulnerability employs CHIRPS data, which is then interpolated using the Kriging method [35]. The highest intensity is found in the sub-districts of West Semarang, North Semarang, Gayamsari, and East Semarang. Other sub-districts generally experience medium to light intensity (refer to Figure 11).
Figure 11. Rainfall
The collected data is then analyzed using the CMA method, producing the following scores (refer to Table 3).
Processing with the CMA method is used to determine the score and weight of each parameter necessary for assessing tidal flood vulnerability. Once the results are obtained, the maps of each parameter are overlaid [30]. The weight calculations using the CMA method yield percentages that indicate the factors contributing most to vulnerability, specifically flood inundation, distance from the coastline, distance from the river, and land cover (refer to Table 4).
Table 3. CMA parameter calculation
| Flood Inundation | |||||||
| Class | Area (ha) | Area (%) | Flood Point (O) | Observation Area (ha) | Expected Flood (E) | O/E | Score |
| Flooded | 1272.82 | 10.25% | 28 | 1.272.82 | 3.075 | 9.105 | 0.992 |
| Not Flooded | 11143.44 | 89.75% | 2 | 11.143.44 | 26.925 | 0.074 | 0.008 |
| Total | 12416 | 100% | 30 | 12.416.26 | 30 | 9.179 | 1 |
| Coastline Distance | |||||||
| Class | Area (ha) | Area (%) | Flood Point (O) | Observation Area (ha) | Expected Flood (E) | O/E | Score |
| 250 m | 967.09 | 7.79% | 5 | 152.3 | 2.337 | 2.14 | 0.206 |
| 500 m | 797.32 | 6.42% | 4 | 135.08 | 1.927 | 2.076 | 0.2 |
| 750 m | 750.11 | 6.04% | 5 | 118 | 1.812 | 2.759 | 0.266 |
| 1000 m | 711.28 | 5.73% | 5 | 138.84 | 1.719 | 2.909 | 0.28 |
| >1000 m | 9190.44 | 74.02% | 11 | 728.58 | 22.206 | 0.495 | 0.048 |
| Total | 12416 | 100% | 30 | 1272.8 | 30 | 10.379 | 1 |
| Distance From River | |||||||
| Class | Area (ha) | Area (%) | Flood Point (O) | Observation Area (ha) | Expected Flood (E) | O/E | Score |
| 100 m | 599.43 | 4.83% | 6 | 87.82 | 1.448 | 4.143 | 0.362 |
| 200 m | 550.14 | 4.43% | 3 | 57 | 1.329 | 2.257 | 0.197 |
| 300 m | 557.65 | 4.49% | 3 | 52.52 | 1.347 | 2.226 | 0.194 |
| 400 m | 558.9 | 4.50% | 3 | 60.3 | 1.35 | 2.222 | 0.194 |
| >400 m | 10150.12 | 81.75% | 15 | 1015.16 | 24.525 | 0.612 | 0.053 |
| Total | 12416 | 100% | 30 | 1272.8 | 30 | 11.459 | 1 |
| Ground Level | |||||||
| Class | Area (ha) | Area (%) | Flood Point (O) | Observation Area (ha) | Expected Flood (E) | O/E | Score |
| 0.45-0.60 m | 2526.29 | 20.35% | 13 | 97.28 | 6.104 | 2.13 | 0.472 |
| 0.30-0.45 m | 2551.86 | 20.55% | 9 | 455.98 | 6.166 | 1.46 | 0.323 |
| 0.15-0.30 m | 3926.76 | 31.63% | 3 | 278.59 | 9.488 | 0.316 | 0.07 |
| 0-0.15 m | 3411.35 | 27.47% | 5 | 440.95 | 8.242 | 0.607 | 0.134 |
| Total | 12416 | 100% | 30 | 1272.8 | 30 | 4.512 | 1 |
| Land Cover | |||||||
| Class | Area (ha) | Area (%) | Flood Point (O) | Observation Area (ha) | Expected Flood (E) | O/E | Score |
| Water Body | 6622.47 | 53.34% | 6 | 752.377 | 16.001 | 0.375 | 0.038 |
| Built-up Land | 1251.81 | 10.08% | 3 | 152.43 | 3.025 | 0.992 | 0.101 |
| Open Land | 2210.13 | 17.80% | 3 | 215.54 | 5.34 | 0.562 | 0.057 |
| Sawah | 1435.68 | 11.56% | 3 | 752.37 | 3.469 | 0.865 | 0.088 |
| Vegetation | 889.57 | 7.16% | 15 | 67.7 | 2.149 | 6.979 | 0.714 |
| Total | 12416 | 100% | 30 | 1940.417 | 30 | 9.772 | 1 |
| Land Elevation | |||||||
| Class | Area (ha) | Area (%) | Flood Point (O) | Observation Area (ha) | Expected Flood (E) | O/E | Score |
| <11 m | 9880.5 | 79.58% | 30 | 1261.78 | 23.874 | 1.257 | 1 |
| 11-32 m | 2204.03 | 17.75% | 0 | 0 | 5.325 | 0 | 0 |
| 32-53 m | 232.98 | 1.88% | 0 | 0 | 0.563 | 0 | 0 |
| 53-74 m | 75.13 | 0.61% | 0 | 0 | 0.182 | 0 | 0 |
| >74 m | 20.04 | 0.16% | 0 | 0 | 0.048 | 0 | 0 |
| Total | 12416 | 100% | 30 | 1261.78 | 30 | 1.257 | 1 |
| Rainfall | |||||||
| Class | Area (ha) | Area (%) | Flood Point (O) | Observation Area (ha) | Expected Flood (E) | O/E | Score |
| 0 - 1800 mm/year | 242.12 | 1.95% | 0 | 0 | 0.585 | 0 | 0 |
| 1800 - 1860 mm/year | 18.54 | 0.15% | 0 | 0 | 0.045 | 0 | 0 |
| 1860 - 1921 mm/year | 343.72 | 2.77% | 1 | 21.72 | 0.831 | 1.204 | 0.383 |
| 1921 - 1982 mm/year | 6218.24 | 50.08% | 18 | 709.74 | 15.025 | 1.198 | 0.381 |
| 1982 - 2043 mm/year | 5589.51 | 45.02% | 10 | 535.99 | 13.506 | 0.74 | 0.236 |
| Total | 12416 | 100% | 29 | 1267.45 | 30 | 3.143 | 1 |
Table 4. Parameter weighting results using CMA
|
Parameters |
O/E |
Weight |
Weight (%) |
|
Flood Inundation |
9.178 |
0.18467544 |
18.47% |
|
Distance from Coastline |
10.379 |
0.208841402 |
20.88% |
|
Distance from River |
11.459 |
0.230572659 |
23.06% |
|
Land subsidence |
4.512 |
0.090788362 |
9.08% |
|
Land Cover |
9.772 |
0.196627631 |
19.66% |
|
Land Elevation |
1.256 |
0.025272647 |
2.53% |
|
Rainfall |
3.142 |
0.06322186 |
6.32% |
|
Total |
49.698 |
1 |
100% |
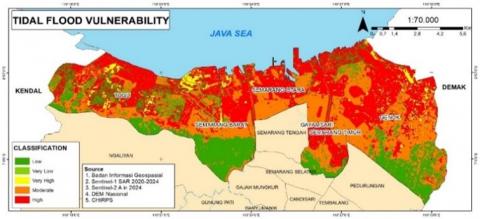
3.4 Creation of tidal flood vulnerability map
The results of the processing and calculations using the CMA method yielded an interval value of 0.734 for classification intervals. The classifications include very high, high, medium, low, and very low vulnerability. The visualization of tidal flood vulnerability is shown in Figure 12 and Table 5.
Figure 12. Tidal flood vulnerability
Table 5. Area and percentage of tidal flood vulnerability
|
Sub-District |
Area of Vulnerability (Ha) |
Area (Ha) |
||||
|
Very High |
High |
Medium |
Low |
Very Low |
||
|
Tugu |
161.32 |
1255.55 |
730.54 |
856.18 |
4.83 |
3018.97 |
|
Semarang Barat |
88.31 |
781.32 |
672.25 |
799.04 |
3.57 |
2354.74 |
|
Semarang Utara |
18.10 |
631.43 |
466.25 |
58.07 |
1.10 |
1190.90 |
|
Semarang Timur |
5.13 |
292.83 |
312.78 |
87.28 |
- |
700.01 |
|
Gayamsari |
7.59 |
269.50 |
327.99 |
134.01 |
0.34 |
741.61 |
|
Genuk |
200.95 |
1758.02 |
1570.20 |
867.64 |
0.55 |
4410.30 |
|
Total Area |
481.40 |
4988.65 |
4080.01 |
2802.22 |
10.39 |
12416.0 |
|
Percentage |
3.9 |
40 |
33 |
23 |
0.1 |
100% |
The assessment of tidal flood vulnerability indicates a very high level of risk, primarily in Semarang Barat. Additionally, coastal areas directly adjacent to the sea are categorized as having high vulnerability. This differs slightly from research [29] with the same parameters. In this study, the distance from rivers and the coastline has the highest weight because Semarang City has a large river network that serves as a medium for tidal water from the sea to the land, which relates to the distance from the coastline, making its reach farther. However, water inundation remains one of the dominant parameters and is consistent [29, 30].
The distribution of tidal flooding in Semarang City over five years indicates that the greatest impact occurs in sub-districts with the highest vulnerability. These sub-districts, in order of affected area, are Genuk, Tugu, West Semarang, North Semarang, Gayamsari, and East Semarang. The research findings show that the vulnerability level to tidal flooding in the coastal areas of Semarang is mostly in the medium to very high categories. This is primarily due to significant factors such as flood inundation, proximity to the coastline, and distance from rivers.
The vulnerability assessment was conducted using the CMA method to evaluate tidal flood susceptibility. This method produces a percentage reflecting the factors contributing most significantly to vulnerability: flood inundation, distance from the coastline, distance from rivers, and land cover. These significant impacts underscore the need for more effective management strategies to mitigate community risks. This situation highlights the necessity for diverse approaches in flood risk management, combining infrastructure improvements with sustainable water resource management to reduce groundwater usage.
The extensive coastal area of Semarang City affected by tidal flooding complicates its management, necessitating further research to implement actions tailored to each area's conditions and characteristics. Future research could also focus on managing areas with high and very high vulnerability levels as a priority.
The recommendations based on this research are to regulate land use per the existing spatial planning, which can then be integrated with constructing large-scale wave barriers, as the areas affected by tidal flooding in Semarang City are extensive. For sustainability, groundwater conservation is necessary to prevent continued land subsidence, potentially by utilizing seawater for massive needs by developing seawater desalination.
I would like to thank the DRTPM Kemendikbud Ristek Indonesia for funding this research in the 2024 budget year. In addition, I also thank the coastal communities of Semarang, who have been willing to provide valuable experience for this research process.
[1] Cavalletti, B., Corsi, M., Lagomarsino, E. (2021). Marine sites and the drivers of wellbeing: Ecosystem vs. anthropic services. Sustainability, 13(22): 12568. https://doi.org/10.3390/su132212568
[2] Wahler, H., Fanini, L., Riechers, M. (2023). Valuing beaches for beauty and recreation only? Uncovering perception bias through a hashtag analysis. Marine Policy, 155: 105707. https://doi.org/10.1016/j.marpol.2023.105707
[3] Handoyo, G., Suryoputro, A.A., Subardjo, P. (2016). Rob Flood Inundation in Semarang Utara District. Journal of Tropical Marine, 19(1): 55-59. https://doi.org/10.14710/jkt.v19i1.601
[4] Setyaningsih, W., Benardi, A.I., Aji, A., Kahfi, A. (2019). Spatial model development of rob expansion study on changes in community conditions in Semarang city. Indonesian Journal of Conservation, 8(2): 89-94. https://doi.org/10.15294/ijc.v8i2.22688
[5] Buchori, I., Pramitasari, A., Sugiri, A., Maryono, M., Basuki, Y., Sejati, A.W. (2018). Adaptation to coastal flooding and inundation: Mitigations and migration pattern in Semarang City, Indonesia. Ocean & Coastal Management, 163: 445-455. https://doi.org/10.1016/j.ocecoaman.2018.07.017
[6] Setyaningsih, W. (2021). Adaptation of coastal communities in facing coastline changes in coastal Sayung subdistrict. Geo-Image Journal, 10(2): 164-174. https://scholar.google.co.id/citations?view_op=view_citation&hl=en&user=YrzWb3cAAAAJ&citation_for_view=YrzWb3cAAAAJ:eq2jaN3J8jMC.
[7] Widana, I.D.K.K. (2022). Analysis of causal factors and mitigation strategies of rob flood disaster in Banda Aceh City. Journal of Citizenship, 6(4): 7337-7342. https://scholar.google.co.id/citations?view_op=view_citation&hl=id&user=BeQa3L8AAAAJ&cstart=20&pagesize=80&citation_for_view=BeQa3L8AAAAJ:tOudhMTPpwUC.
[8] Findayani, A. (2015). Community preparedness in flood management in Semarang city. Geography Journal: Information Media for Development and Geography Profession. Geography Journal: Information Media for Geography Development and Profession, 12(1): 102-114. https://scholar.google.com/citations?view_op=view_citation&hl=en&user=gdLzmIkAAAAJ&citation_for_view=gdLzmIkAAAAJ:u5HHmVD_uO8C.
[9] Kusuma, H.F., Setyaningsih, W., Suharini, E. (2020). Flood disaster mitigation education using the lecture method assisted by videoscribe media for the people of Ngroto Village, Gubug District, Grobogan Regency. Edu Geography, 8(1): 49-55. https://scholar.google.co.id/citations?view_op=view_citation&hl=en&user=YrzWb3cAAAAJ&cstart=20&pagesize=80&citation_for_view=YrzWb3cAAAAJ:XiVPGOgt02cC.
[10] Yastika, P.E., Shimizu, N., Abidin, H.Z. (2019). Monitoring of long-term land subsidence from 2003 to 2017 in coastal area of Semarang, Indonesia by SBAS DInSAR analyses using Envisat-ASAR, ALOS-PALSAR, and Sentinel-1A SAR data. Advances in Space Research, 63(5): 1719-1736. https://doi.org/10.1016/j.asr.2018.11.008
[11] Santoso, S., Iswahyuni, N.E. (2005). Analysis of coastal reclamation policy in the Semarang Marina coastal area. Dialogue, 2(3): 1-10. https://scholar.google.com/citations?view_op=view_citation&hl=en&user=NmNAADYAAAAJ&cstart=20&pagesize=80&citation_for_view=NmNAADYAAAAJ:j3f4tGmQtD8C.
[12] Abidin, H.Z., Andreas, H., Gumilar, I., Wibowo, I.R.R. (2015). On correlation between urban development, land subsidence and flooding phenomena in Jakarta. Proceedings of IAHS, 370: 15-20. https://doi.org/10.5194/piahs-370-15-2015
[13] Islam, L.J.F., Prasetyo, Y., Sudarsono, B. (2017). Analysis of land subsidence in Semarang city using Sentinel-1 imagery based on the Dinsar method in SNAP software. Undip Geodesy Journal, 6(2): 29-36. https://scholar.google.co.id/citations?view_op=view_citation&hl=en&user=Q1GQz28AAAAJ&citation_for_view=Q1GQz28AAAAJ:geHnlv5EZngC.
[14] Nurjani, E., Rahayu, A., Rachmawati, F. (2013). Study of hurricane disaster in Indonesia 1990-2011: Disaster mitigation efforts. Geo Media: Geographical Information and Scientific Magazine, 11(2): 191-206. https://scholar.google.co.id/citations?view_op=view_citation&hl=en&user=iSH-fHIAAAAJ&citation_for_view=iSH-fHIAAAAJ:_FxGoFyzp5QC.
[15] Antoniadis, N., Alatza, S., Loupasakis, C., Kontoes, C. (2023). Land subsidence phenomena vs. coastal flood hazard—the cases of Messolonghi and Aitolikon (Greece). Remote Sensing, 15(8): 2112. https://doi.org/10.3390/rs15082112
[16] Setyaningsih, W., Indrayati, A. (2015). Readiness of SMP Negeri 41 Semarang to commit and systematically internalize environmental values and Disaster Preparedness Attitudes (Swaliba). Geography Journal: Information Media for Geography Development and Profession, 12(2): 182-195. https://scholar.google.co.id/citations?view_op=view_citation&hl=id&user=SMy4p8AAAAAJ&cstart=20&pagesize=80&citation_for_view=SMy4p8AAAAAJ:2osOgNQ5qMEC.
[17] Syafei, N.I., Muryani, C., Rintayati, P. (2017). Analysis of distribution, impact and community adaptation to tidal flooding in East Semarang District and Gayamsari District, Semarang City. GeoEco, 3(2): 145-156. https://scholar.google.co.id/citations?view_op=view_citation&hl=en&user=Bngfki4AAAAJ&citation_for_view=Bngfki4AAAAJ:maZDTaKrznsC.
[18] Tomaszewski, B. (2020). Geographic Information Systems (GIS) for Disaster Management. London. Routledge. https://doi.org/10.4324/9781351034869
[19] Fang, J., Kong, F., Fang, J., Zhao, L. (2018). Observed changes in hydrological extremes and flood disaster in Yangtze River Basin: Spatial–temporal variability and climate change impacts. Natural Hazards, 93: 89-107. https://doi.org/10.1007/s11069-018-3290-3
[20] Singh, K.V., Setia, R., Sahoo, S., Prasad, A., Pateriya, B. (2015). Evaluation of NDWI and MNDWI for assessment of waterlogging by integrating digital elevation model and groundwater level. Geocarto International, 30(6): 650-661. https://doi.org/10.1080/10106049.2014.965757
[21] Mocenni, C., Facchini, A., Vicino, A. (2010). Identifying the dynamics of complex spatio-temporal systems by spatial recurrence properties. Proceedings of the National Academy of Sciences, 107(18): 8097-8102. https://doi.org/10.1073/pnas.0910414107
[22] Maria Octarina, T., Dewa Nyoman Nurweda Putra, I., Kadek Ayu Wirdiani, N. (2019). Remote sensing of Landsat 8 satellite data processing for inundation detection. Scientific Journal of Merpati, 7(1): 77-85. https://scholar.google.co.id/citations?view_op=view_citation&hl=en&user=2HVp4vMAAAAJ&citation_for_view=2HVp4vMAAAAJ:7PzlFSSx8tAC.
[23] Yusup, M., Tarigan, P.I.S., Noviansah, K., Ridwana, R., Aliyan, S.A. (2023). Identification of flood inundation using sentinel-1 and its correlation with flood vulnerability in south Barito regency. Geo-Image Journal, 12(1): 62-70. https://journal.unnes.ac.id/sju/geoimage/article/view/63933
[24] Wijaya, A.R. (2023). Spatio-temporal ETAS model on mapping analysis of seismic intensity in Sumatera region. Jambura Journal of Mathematics, 5(1): 179-188. https://doi.org/10.34312/jjom.v5i1.17359
[25] Sugianti, K., Sukristiyanti, S., Tohari, A. (2016). Spatial and temporal model of landslide susceptibility for Sukabumi regency. Riset Geologi dan Pertambangan, 26(2): 117-129. https://doi.org/10.14203/risetgeotam2016.v26.270
[26] Vanama, V.S.K., Rao, Y.S., Bhatt, C.M. (2021). Change detection based flood mapping using multi-temporal Earth Observation satellite images: 2018 flood event of Kerala, India. European Journal of Remote Sensing, 54(1): 42-58. https://doi.org/10.1080/22797254.2020.1867901
[27] UNOOSA. (2020). Step by step recommended practice: Flood mapping and damage assessment using sentinel-1 sar data in google earth engine. https://www.unspider.org/advisory-support/recommended-practices/recommended-practice-google-earth-engine-flood-mapping/step-by-step.
[28] Neumann, B., Ott, K., Kenchington, R. (2017). Strong sustainability in coastal areas: A conceptual interpretation of SDG 14. Sustainability Science, 12: 1019-1035. https://doi.org/10.1007/s11625-017-0472-y
[29] Salsabillah, F., Setiawan, C., A'rachman, F.R., Oktarina, R.L. (2024). Spatial analysis of flood vulnerability level in North Jakarta. Journal of Geoscience and Remote Sensing, 5(1): 55-68. https://scholar.google.co.id/citations?view_op=view_citation&hl=en&user=duviI9QAAAAJ&cstart=20&pagesize=80&citation_for_view=duviI9QAAAAJ:qUcmZB5y_30C.
[30] Muttaqin, K., Maulita, M., Fitria, L., Ihsan, A., Mulya, R. (2023). Mapping flood-prone areas based geographic information system using composite mapping analysis. International Journal of Geoinformatics, 19(12): 93-105. https://doi.org/10.52939/ijg.v19i12.2983
[31] Lan, Y.J., Hsu, T.W. (2021). Planning and management of coastal buffer zones in Taiwan. Water, 13(20): 2925. https://doi.org/10.3390/w13202925
[32] Lius, A., Sholva, Y., Irwansyah, M.A. (2021). Flood prone area application and evacuation site recommendation using DEM data and based on the closest distance. Journal of Information Systems and Technology, 9(1): 48-55. https://scholar.google.co.id/citations?view_op=view_citation&hl=id&user=oLzmbpUAAAAJ&citation_for_view=oLzmbpUAAAAJ:kNdYIx-mwKoC.
[33] Roohi, M., Faeli, M., Irani, M., Shamsaei, E. (2021). Calculation of land subsidence and changes in soil moisture and salinity using remote sensing techniques. Environmental Earth Sciences, 80(12): 423. https://doi.org/10.1007/s12665-021-09723-2
[34] Narendra, B.H., Siringoringo, H.H., Siregar, C.A. (2017). GIS based flood hazard and vulnerability mapping: A Case study of tidal and river floods in downstream of Ciasem Watershed, Subang-West Java. Indonesian Journal of Forestry Research, 4(1): 37-48. https://doi.org/10.20886/ijfr.2017.4.1.37-48
[35] Bargaoui, Z.K., Chebbi, A. (2009). Comparison of two kriging interpolation methods applied to spatiotemporal rainfall. Journal of Hydrology, 365(1-2): 56-73. https://doi.org/10.1016/j.jhydrol.2008.11.025