Rouwaida Hussein Ali![]() | Abbas M. Abd
| Abbas M. Abd![]() | Raquim N. Zehawi*
| Raquim N. Zehawi*![]()
© 2024 The authors. This article is published by IIETA and is licensed under the CC BY 4.0 license (http://creativecommons.org/licenses/by/4.0/).
OPEN ACCESS
In a construction project, especially in risky environments, subcontractors are considered as important as the main contractor since most work is carried out by them. A crucial step in building projects is choosing the finest subcontractor. When choosing subcontractors, a variety of considerations must be taken into account. A poor choice of subcontractors might cause a lot of issues when the job is being done. These include subpar work and project length delays. Many things influence this process. From earlier studies, variables that affect the choice of a subcontractor have been compiled. The main aim of the paper is to predict the failure of the subcontractor by using a mix of several advanced technology as BIM, machine leaning and building a system. The methodology of the paper is first to use BIM to see the mistakes and unqualified quantity estimation by the subcontractors which lead to increase the cost of the projects and hence failures of the projects. The second step is to identify primary reasons for subcontractors’ failure and identify and evaluate the major reasons why contractors fail on industrial projects in Iraq. The third step is to predict the performance of the subcontractor using three algorithms (logistic regression, decision tree and Naive Bayes) with data collected from 234 projects and see how the wrong selection of the subcontractors leads to incomplete projects in the future. The variables that used in the paper include the most effective one, as change order effect directly on the projects performance as well as cost, time, deviation, type of projects and the rate of project completion, the low the percentage of completion the worse the performance. The final step is to develop a system to manage the subcontract in different projects stage. The results show that there is a different in the quantity estimated between the actual and the estimated range between (5% to 15%) in several item of the building, which consider high. the best algorithms for the is Naive Bayes as give accuracy about 97%.
subcontractor, decision tree, Naive Bayes, construction project
A building entity that enters into a contract with a major contractor in order to do certain obligations in a project within the scope of the whole contract, is usually termed as subcontractor. It may provide labourers, deliver equipment and materials, provide tools, and design services for the project [1, 2]. Subcontractors are divided by Mbachu [3] into three groups: 1) Those who perform certain trades like painting or bricklaying are trade contractors; 2) Specialist subcontractors, who perform specialized services like cladding, piping, tailing etc.; and 3) Those who only perform services of labour like foremen and common worker are the labour-only subcontractors. Subcontracting was not used as frequently as it is now in previous decades [4].
Construction of buildings is well known for being a hub of traders with a range of skills. The size and complexity of the projects undertaken, as well as the “one-time off project” nature of its working environment, make the building business unique. Due to the sector’s dynamic character, which needs the acquisition of fresh technologies and cutting-edge procedures in order to enable the supply of goods, the use of subcontractors has become vital [5]. The organization or person in the construction industry who enters into a written agreement with the principal contractor to carry out specific project-related tasks in accordance with the general contract. Beside who may also provide personnel, supplies, machinery, tools, and designs. Laryea [6] revealed that subcontractors sign contracts to carry out a contract’s components or sections.
In order to prevent a domino effect of business failures, the construction sector must overcome significant challenges in predicting firm failure and providing warning signs. The majority of pertinent research have created models that, using financial ratios, forecast the likelihood that a firm would fail within a year. Several research has tried to include non-financial information However, they could not provide any evidence to suggest that this addition may enhance a model’s ability to predict outcomes [7, 8].
Comparatively speaking, the proportion of subcontracted projects has grown recently. Subcontracting can really contribute between 50 and 90 percent, and it may even account for up to 90 percent of the entire project value, during a building process [9, 4]. Therefore, the subcontracting issues are a topic of discussion among the influential people in the construction business. Subcontracting-related problems, on the other hand, are among the construction industry’s key risks that are frequently brought up in international discussions. The date of completing delays [10], the safety of on-site personnel is one of the dangers encountered that is frequently studied [11, 12], and the inability of parties to communicate throughout the phase of construction [13, 14].
It was advised that enterprises employ other variables, such as pricing, quality, delivery time, risk, prior experiences with subcontractors, and reputation, to address the issue of subcontractor selection [15, 16].
The success or failure of the project will depend on the subcontractors’ performance, who handle 85% of the building work [5]. Project completion delays are caused by subcontractors’ poor planning, their incapacity to execute quality assurance and control programs, and job safety laws [17]. According to White and Marasini [18], delays in project completion are brought on by poor communication between the contractor and subcontractors during the building process as well as by work not moving forward according to the original timetable. Regardless of the complexity, scale, or environment in which it is built, a project is deemed successful provided it is finished on schedule, under budget, and with acceptable quality [19].
Effective collaboration enhances project performance by raising profit margins and lowering claims in addition to ensuring timely, affordable, and high-quality completion [20]. Tayeh [21] talked about what causes problems and how long it takes to finish projects in the Gaza Strip. He discovered that certain jobs were transferred to a different subcontractor without notifying the initial subcontractor. Another element influencing a project’s success or failure is the main contractor’s authoritarian attitude toward subcontractors [22]. Effective collaboration and mutual trust are two of the finest markers of the advancement of building projects, according to previous studies [23].
According to Daoud et al. [24], the top five factors contributing to delays in construction projects were, in order of significance, low labor productivity, ineffective coordination and communication between stakeholders, various bribery schemes, project financing delays, work order changes, and unskilled labor. Out of the five types of risks, Adinyira et al. [25] said that financial, resource, technical, and management risks had a beneficial impact on the quality performance of building projects. On a construction project, improper risk management of subcontractors’ risks will have a significant negative impact on the project’s performance quality. According to Elhusseiny [26], low worker productivity, owner payment delays, and delayed or nonexistent delivery of equipment and building supplies all contribute to project delays and interpersonal issues amongst project participants.
In the Pacific Northwest region of the United States, McCord and Gunderson’s study [27] interviews with twenty-four subcontractors revealed that the most serious betrayal of trust, which was enough to end a relationship for 75% of the subcontractors surveyed, was post-award bid shopping by principal contractors. Trust was identified as the fundamental building block of good subcontractor-principal contractor relationships.
The main difficulties that have not been addressed among the enormous amount of research on subcontracting were the subcontractors’ predictions before the specific project is awarded and the standards used to observe the subcontractors throughout the building phase. Consequently, in order to address that, these crucial difficulties will be resolved in this study. The determining of the relationships between the key success variables for subcontractors in the construction sector, as growing engagement of subcontractors underlined the importance of resolving these challenges. In broad terms, an overall contractor can anticipate the advantages and disadvantages of choosing a subcontractor. Once the subcontractor’s performance or weaknesses have been predicted, resource allocation may then be pre-planned. For instance, if a subcontractor’s performance is subpar, additional time, money, and labour resources are required to stabilize the performance. Additionally, principal contractors possess the choice and authority to choose the wanted subcontractors they believe will be able to meet their needs. For instance, subcontractors projected to perform well on “communication skills” throughout the building stage are favoured above others in a project with a high likelihood of redesigning. In conclusion, it is more relevant to forecast performance and manage subcontractors rather than examine subcontractor practice in many aspects separately. The old method of collecting cost information, which is prone to errors, continues to be a challenge for contractor-led projects. This approach has often resulted in the defeat of project objectives, destruction of feasibility investigations that guided project investment, and general undermining of project success [28]. However, with model element features like size, area, object family type, and productivity estimates, digital construction information flow inside the 5D BIM process enables contractors, employers, and project teams to provide precise cost and critical estimation information [29]. Adopting BIM to improve project performance on a single project is challenging. It is considerably more difficult to broadly use methodologies for projecting the influence of BIM on future projects. In order to offer recommendations, some previous studies have employed surveys to ascertain and evaluate project participants’ perceptions of the advantages and return on investment that may be realized by utilizing BIM [30].
The paper focuses on subcontractor performance by using the means of the new technology as BIM, machine learning. Thus, the methodology divided into several stages, the first stage is the using of BIM to estimate subcontractor performance, and the second stage is the use of machine learning inn the prediction of its failure. And the last stage is to build a system to manage the performance.
The main steps in the methodology, data understanding, data preparation, data modeling, and outcome evaluation as shown in Figure 1. This paper adds pattern identification and design rules to these steps:
2.1 System understanding
Gaining a knowledge of the paper’s idea and the requirements needed to accomplish its aims is the aim of system comprehension. The performance metrics used in this article to realize the project are often subcontractor failures and their management. One way to describe them is as goals. The geometrical and functional choices made during the design process will determine costs, timetables, change orders, and other elements that will be discussed. These choices will be recognized and used as prediction standards for system comprehension. Tools and technologies for the prediction set are also identified in this stage. While BIM will be used to compare the quantity between the estimated and real.
2.2 Data understanding
After system understanding comes data understanding. This stage entails gathering and examining the information required to meet the forecast goals. In order to do this, the data according to the prediction criteria that were sought for using data analysis tools throughout the data comprehension must be grouped and classified. To get cost deviations and Excel or Google sheet spreadsheets from past projects, the gathering may be carried out using BIM. The next stage after gathering data is to examine it to make sure it is accurate. Eliminating data that doesn’t meet the analysis’s criteria—either too big or too small—is one way to do this.
2.3 Data preparation
The process of getting data ready for modeling is called data preparation. This is done in a few steps: data construction is finding additional attributes that will be helpful for data modeling; data cleaning is eliminating, correcting, or deleting incorrect values; and data integration is merging data from different sources, like BIM.
2.4 Data modelling
Building and assessing multiple models using various modeling approaches is the process of modeling. To demonstrate the impact of choosing the incorrect subcontractor on the project’s performance, modeling is first completed using BIM to extract variations in amount. Next, we decide the algorithms to test; we evaluate the rival models in light of the outcomes and the desired performance standards.
A programming package for the ML and an interpreted programming language are needed to accomplish the method described in this article. Python is the tool that is suggested as an interpretative programming language in this article. The provided data will be utilized in logistic regression, decision trees, and navies byes modeling. At the conclusion of the modeling process, the predictions made using these methods are shown.
2.5 Data evaluation
This step compares the results of the three techniques used for modeling.
Figure 1. Proposed method
The results of the using of each part of the methodology as follow:
3.1 BIM for subcontractor performance
Three case studies were taken for different type of school, 12, 18 and 24 classes, these schools were awarded to subcontractor in order to be implemented and during the progress of work several problems arise, and change orders cost deviation and other. Each case study was modelled both structure and architectural to estimate the different.
Only a few metrics were employed to characterize project performance (PP), including construction management, on-time completion, quality, and cost [31], which are usually referred to as “the iron triangle” by which the construction project’s performance could be evaluated as well as its success degree [18].
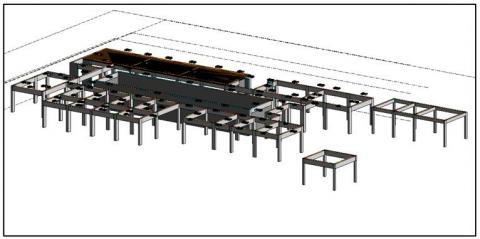
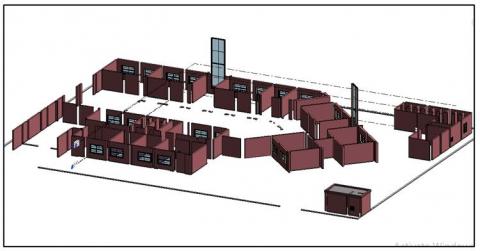
Due to the fact that both “schedule” and “cost” could be examined objectively, both elements were designated as the most typical performance indices [32, 33]. Even if the concept of “quality” was difficult to quantify, the pleasure of the project’s owner still depends on this specific building quality. Due to the fact that project managers are accountable for balancing the project’s quality, cost and schedule. Several projects were taken in order to prove the hypothesis which indicate that the subcontractor must use BIM as too for cost estimation. In Figure 2, the building was modelled by using BIM. As Figure 2(a) shows the architectural form of the building and Figure 2(b) the structural form of the building.
(a)
(b)
Figure 2. Structural and architectural model for 12 class
The same was repeated for different projects in Figure 3. Determining the criteria used for observing subcontractors throughout the building phase and evaluating subcontractors’ performance prior to project awarding are hence the research aims of this study.
(a)
(b)
Figure 3. Structural and architectural model for 24 class
As the subcontractor, a several deviations occurs between the tenders and actual work and thus return to the disability of the subcontractor to work as planned. Figure 4 shows the calculation in three different methods, tender which mean the cost as provided originally by the main contractor, estimated which mean the cost calculated by the subcontractor and actual represent the cost calculated by BIM.
(a)
(b)
Figure 4. Structural and architectural model for 18 class
Figures 5 and 6 represent the deviation between the three calculation in curves. After these case studies were taken, it should be noted several issues with subcontractor management and hence need to be predicted to take a preventive action.
Figure 5. Different in quantities for school with 12 class
Figure 6. Different in quantities for school with 18 class
3.2 AI for subcontractor management
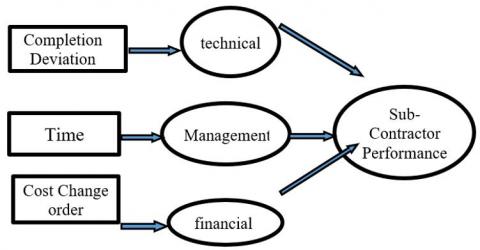
The data used for the prediction collected from 234 projects of different types (residential, road, electrical, water projects). Each projects contain the following information (type of project, additional time, additional cost, percentage of completion, change orders, deviation, performance of subcontractors), the factors that used in the prediction as shown in Figure 7.
The algorithms that used for prediction (logistic regression, decision tree and Naive Bayes).
Random forests, sometimes referred to as random selection forests, are a method of ensemble learning of regression, classification, as well as other missions that employs a large number of selection bushes to train before producing the elegance, which is the mean/common prediction (regression) of the individual bushes. The problem of selection bushes overfitting their educational set is solved by random selection forests. In most situations, random forests perform better than preference bushes, although they are less specialized than gradient enhanced bushes. On the other hand, data attributes may also have an impact on how well they work.2020 and 2021, respectively, by Piryonesi. The BCR prediction tool was created in Python and offers prediction models for 4 different sets of rules [34, 35].
During the training phase, every feature variable in the data was employed. The predicted events are listed, and the confusion matrix’s findings are made public. As can be observed, the great majority of estimated transactions are contained in the “True-True” category. Regression using logit. A sigmoid function that depicts it is illustrated by Figure 8.
Figure 7. Prediction variables
Figure 8. Different in quantities for school with 24 class
Figure 9. Logistic regression [36]
To anticipate the output values, weights or coefficients are blended linearly with the input values. It designates a binary variable with simply the 0 and 1 possible values. Its goal is to create a mathematical formula that will give us a score between 0 and 1 as shown in Figure 9 [36].
A decision support tool called a decision tree employs a tree like graphical representation which is often used for explaining the decisions with their consequences, containing utility, resource costs, and outcomes from random events. It’s a tool by which an algorithm can be displayed.
In a decision tree, each class label is represented by leaf node and test results are represented as branches, while every internal node resembles a “test” property (for instance, whether a coin will fall on its head or tail) (decision determined by calculating all characteristics). The routes between root and leaf indicate the rules of classification [36].
A probabilistic classification model is created from previously evaluated attributes using a Nave Bayesian classifier, which is based on Bayes’ theorem. The filtration process of mail for antispam in which the filter is trained to extract the spam from legitimate mail automatically, represents its most common use. in the binary fashion [37, 38]. By doing this, it is possible to discern between spam and valid emails by matching each characteristic to terms found in both; the latter are then prohibited by a trained filter. As shown in Table 1, it consists of seven variables that mentioned earlier. Type of project was sample by number as (1= electrical, 2=water, 3= road, 4=residential) projects while cost symbol by (1 or zero) which mean the former that cost added where the later there is no cost added. The class on the other hand, represents the performance as 0 indicate low performance and 1 indicate a good performance.
Table 1. Subcontractor performance factors
|
No. |
City and Author(s) |
Factors Affecting Subcontractors’ Performance |
|
|
1 |
South Africa |
[39] |
1) Inadequate management techniques |
|
2) Negative sentiments in subcontracting firms |
|||
|
3) Insufficient working capital |
|||
|
4) Intense rivalry |
|||
|
5) A lack of skills |
|||
|
2 |
Pakistan |
[40] |
1) Subcontractors’ level of service quality |
|
2) Insufficient collaboration |
|||
|
3) Excessive material waste |
|||
|
4) Challenging to organize task |
|||
|
3 |
Nigeria |
[41] |
When to use a variant order |
|
2) Average lateness in receiving monthly payments |
|||
|
3) Delays in fixing errors |
|||
|
4) Arrival time of materials |
|||
|
5) Accidental time spent |
|||
|
6) Cash flow for the contractor on the project |
|||
|
7) Cost of materials and equipment |
|||
|
8) Variation order costs |
|||
|
9) Waste of materials |
|||
|
10) Cost of safety |
|||
|
4 |
Malaysia |
[42] |
1) Poor abilities of subcontractors |
|
2) Safety concerns |
|||
|
3) Partnering difficulties |
|||
|
4) Payment issues |
|||
|
5 |
Jordan |
[43] |
1) The subcontractor’s expertise |
|
2) Technical expertise, background, and licensing |
|||
|
3) Concerns about health and safety |
|||
|
4) Complexity of the project |
|||
|
5) The work schedule and the private bidding of the subcontractor |
|||
|
6) Superintendent proficiency |
|||
|
7) Project manager rapport and correspondence |
|||
|
8) Environmental aspects and financial resources |
|||
Table 2. Sample data
|
Type of Projects |
TIME |
COST |
COM |
CHANGE |
DEV |
CLASS |
|
1 |
231 |
1 |
82 |
12 |
18 |
0 |
|
1 |
284 |
0 |
0.1 |
1 |
0.65 |
0 |
|
1 |
91 |
1 |
1 |
3 |
0 |
1 |
|
1 |
323 |
0 |
0.75 |
0 |
0.1 |
0 |
|
1 |
162 |
0 |
0.15 |
12 |
0.85 |
0 |
|
1 |
376 |
1 |
0.59 |
0 |
0.26 |
0 |
|
1 |
0 |
0 |
0 |
0 |
0 |
1 |
|
1 |
178 |
1 |
1 |
3 |
0 |
1 |
|
1 |
0 |
0 |
0 |
2 |
1 |
0 |
|
1 |
405 |
0 |
0.65 |
1 |
0.15 |
0 |
|
1 |
213 |
0 |
1 |
3 |
-1 |
1 |
|
1 |
0 |
0 |
0 |
2 |
1 |
0 |
|
2 |
215 |
0 |
1 |
3 |
0 |
1 |
|
1 |
0 |
0 |
0 |
6 |
0 |
1 |
|
2 |
36 |
0 |
1 |
3 |
0 |
1 |
|
1 |
0 |
0 |
0 |
6 |
0 |
1 |
|
1 |
0 |
0 |
0 |
6 |
0 |
1 |
|
2 |
0 |
0 |
0 |
6 |
0 |
1 |
|
1 |
0 |
0 |
0 |
6 |
0 |
1 |
Table 3. Correlation matrix
|
Type of Project |
TIME |
COST |
COM |
CHANGE |
DEV |
CLASS |
|
|
Type of Project |
1 |
-0.20705 |
-0.1568 |
-0.11784 |
0.095716 |
-0.16801 |
0.165549 |
|
TIME |
-0.207052 |
1 |
0.190534 |
0.070385 |
-0.06072 |
0.118682 |
-0.094516 |
|
COST |
-0.156798 |
0.190534 |
1 |
0.185556 |
-0.20598 |
0.067377 |
-0.083999 |
|
COM |
-0.11784 |
0.070385 |
0.185556 |
1 |
0.173722 |
0.052467 |
-0.101419 |
|
CHANGE |
0.095716 |
-0.06072 |
-0.20598 |
0.173722 |
1 |
-0.11379 |
0.1756 |
|
DEV |
-0.168009 |
0.118682 |
0.067377 |
0.052467 |
-0.11379 |
1 |
-0.175943 |
|
CLASS |
0.165549 |
-0.09452 |
-0.084 |
-0.10142 |
0.1756 |
-0.17594 |
1 |
Figure 10. Relationship between three variables
Figure 11. Relationship between the last three variables
The data was gathered from 234 different projects and with the main featured, in the first step a relation between each variable and the performance was drawn.
The next step was to find the correlation between the variables. Table 2 shows a sample of the data that used in the paper. Each factor correlation with other were calculated as Table 3.
Figure 10 shows the relationship between the first three variables with all others and Figure 11 show the last three variables with all others.
After that, a correlation matrix was plot to see the connection between each variable and the class as in Table 2. Then, three algorithms were applied to see the accuracy of each one and to see how to get better performance. The results of the three algorithms are shown in Table 4.
Table 4. Algorithms accuracy
|
Analysis |
Method |
Accuracy |
|
Decision tree |
Decision tree |
0.96 |
|
Logistic regression |
Logistic |
0.77 |
|
Naive Bayes |
|
0.97 |
Entropy is simply our dataset’s uncertainty or a measure of disorder. Let’s say a group of pals chooses the Sunday movie they will see together. Everyone is now required to state which of the two movie options—”Lucy” or “Titanic”—they chose. Following everyone’s response, “Lucy” receives four votes, while “Titanic” receives five. Now, what movie are we watching? Given that the two films had about the same number of votes, isn’t it difficult to select only one? The fact that both films received the same number of votes and that we are unable to determine which to watch is precisely what we refer to as disorder. The decision tree classifies two class either yes or no, in our case it classifies the performance either good (1) or bad (0).
The sigmoid function is referred to as an activation function for logistic regression and is defined as:
$F(x)=\frac{1}{1+e^x}$ (1)
where, e=base of natural logarithms; value=numerical value one wishes to transform.
$Y=\frac{e^{(b 0+b 1 x)}}{1+e^{b 0+b 1 x}}$ (2)
where, x=input value; y=predicted output; b0=bias or intercept term; b1=coefficient for input (x).
In our case, there are many input variables such as time, cost, complete, change order, and deviation. Accordingly, Eq. (2) becomes:
$Y=\frac{e^{(b 0+b 1232+b 263.1+b 318+b 415+b 582)}}{1+e^{b 0+b 1232+b 263.1+b 318+b 415+b 582}}$
$Y=0.001$
$P\left(Y=y_i \mid \mathrm{X}=x_k\right)=\frac{P\left(\mathrm{X}=x_k \mid Y=y_i\right) P\left(Y=y_i\right)}{\sum_i P\left(\mathrm{X}=x_k \mid Y=y_i\right) P\left(Y=y_i\right)}$
$P\left(Y \cos \alpha+\cos \beta=2 \cos \frac{1}{2}(\alpha+\beta) \cos \frac{1}{2}(\alpha-\beta)=y_i x\right)=\frac{1}{1+e^x}$
When the total in the denominator is over all permissible values of the random variable Y, and ym indicates the mth possible value for Y and xk the kth possible vector value for X. Using the training data to estimate P(X|Y) and P(Y) is one method of learning P(Y|X). Then, we can use these estimates along with the previously mentioned Bayes method to find P(Y|X = xk) for each new occurrence of xk.
Table 4 illustrates that the average values of classification accuracy of Naïve Bayes, decision tree, and logistic regression as Naïve Bayes has achieved 0.1% higher average classification accuracy results in comparison to decision tree and about 2% than logistic regression.
For classification issues, logistic regression is employed. The Logistic regression problem’s outcome can only fall between 0 and 1. When probabilities between two classes are needed, such as true or false, 0 or 1, logistic regression can be applied. The foundation of logistic regression is the idea of Maximum Likelihood estimation, which makes use of the sigmoid function and yields a curve known as the S-curve or sigmoid curve. The primary requirement is that the data be linear [44]. The following are some advantages of logistic regression. First, a substantial association between the dependent and independent variables may be demonstrated via logistic regression. Secondly, the influence of variables assessed at various scales, such as the impact of price adjustments and the quantity of promotional activities, may also be compared using logistic regression analysis. This advantage aids in the process of removing and assessing the ideal collection of variables to be employed in the construction of prediction models by market researchers or data analysts. Third, in addition to being a classification model, the logistic regression model also yields probability-related data. to have a superior outcome Prior to employing logistic regression, each independent variable needs to have a valid value. Second, multinomial and categorical results may be accurately predicted using logistic regression. Third, because our input data is not between (0.1), there is no multicollinearity between the variables in the dataset [45-47], which lowers the accuracy.
Decision trees are the supervised classification method most frequently used. Learning and categorization are components of decision tree induction. Decision trees may be used in any area because these procedures are quick and easy to follow [48]. The following are some benefits of employing decision trees:
• Extremely low complexity: This method is simple to apply and doesn’t require a high level of statistical knowledge.
• Beneficial for data exploration: The decision tree approach is one of the quickest for producing or identifying new features, therefore it may also be used for data exploration.
• Requires less steps for data cleansing - In contrast, it remains unaffected by missing values and data.
• No limitations on data types: It has the ability to handle both category and numeric variables.
• Non-parametric approach: The decision tree method does not assume anything regarding the geographical distribution because it is non-parametric.
The drawbacks of decision tree algorithm:
• One of the main practical issues influencing the decision tree model is overfitting. However, overfitting issues can be reduced by trimming and imposing model parameter limits.
• Unsuitable for continuous variables - When classifying variables into different groups, the decision tree loses some important information [49].
Naive Bayes give the highest accuracy as this this algorithm has several advantages as follow:
• Handles both continuous and categorical characteristics;
• Is easy to understand and computationally efficient;
• Functions well with high-dimensional data;
• Works well with limited training datasets [50].
The comparison between the algorithms is as shown in Table 5:
Table 5. Comparison between Naive Bayes, decision tree and logistic regression [51, 52]
|
Naive Bayes |
Decision Tree |
Logistic Regression |
|
Non-deterministic |
Deterministic |
Deterministic |
|
Huge data |
Large data |
Smaller data |
|
It can deal with noisy data. |
It can deal with noisy data. |
It cannot deal with noisy data. |
|
For obtaining good results it requires a very large number of records |
High accuracy |
Good accuracy |
3.3 A system for the management of subcontractor
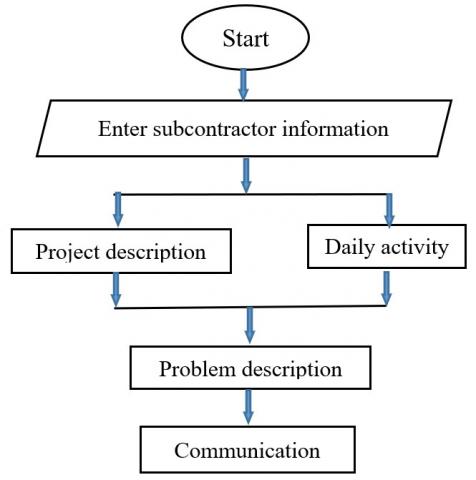
One of the main problems in the management of subcontractor is the weakens in the coordination between the main contractor and the subcontractor, therefore a system was built in order that the subcontractor make a daily, weekly or monthly report to avoid the arising of the problems. The main methodology shown in Figure 12.
The basic steps of the proposes system as follow:
1. Determine the subcontra or information
2. Identify the attributes for each subcontractor
3. Determine the projects activities
4. Determine each problem with its related description in order to quantify the amount of the problem
5. Determine the effect of each problem that occur in the projects
6. Compare the highest issue identified for each factor to each
7. Importance value for the most important issue for that factor
8. Then select the significant problems and send it as report to identify the preferred alternative, which provides the greatest amount of importance for the least amount of cost
Figure 12. System flowchart
Figure 13. System interface
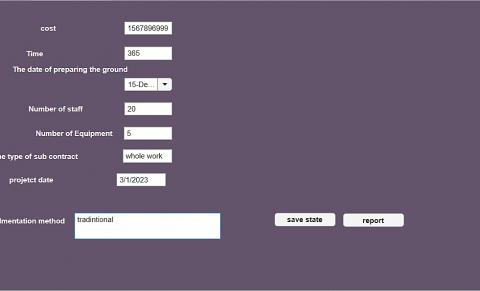
Figure 14. Project description
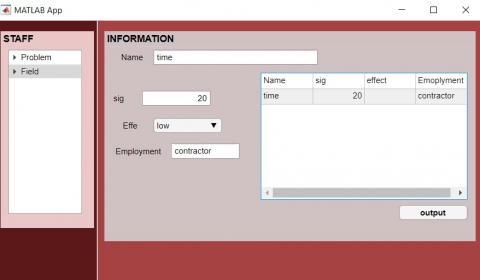
Each node describes a function of the system as explained as in Figure 13 that explain the interface of the program that required a general description of the user, Figure 14 show the project description in term of cost, time, stuff, equipment and other information. The next step is to move to the lowest level which is the problem description as shown in Figure 15 in term of each problem effect and significant.
After project description, each problem encounter in the project will be described and then plotted.
The code that is used to program the app. Is as follows:
staff={‘Problems’, ‘Field’};
if ~isempty(find(strcmp(selectedNodes.Text,staff),1))
enableForm(app);
else
app.NameEditField.Value = ‘‘;
app.sigEditField.Value = 0;
app.EmploymentEditField.Value = ‘‘;
Figure 15. Problem description
After problem description, it will be displayed in chart to make it more understandable in term of plot as shown in Figure 15.
The final step is to send a report to the owner that state all problems that occur during the projects which explained in Figure 16.
The application of this system can be used in general construction projects in order to supervise the subcontractor and make a contact between the main parties of the projects to make a solution in time to prevent the failures of the project.
Figure 16. Problem chart
As seen in the resulted, the use of BIM in subcontractor management is very necessary. Nearly all construction industries are developing Building Information Modelling, or BIM. This presents a number of opportunities and problems for cost management, often known as BIM 5D, as local procedures must be modified to meet information modelling requirements.
It also outlines the steps that must be taken in order to fully utilize the BIM approach for cost estimating. The information model’s present use is examined in a case study with respect to the typical object’s cost calculation. More collaboration between subcontractors and contractors, as well as the interface points across scopes, is made easier by BIM. Ultimately, this allows subcontractors and contractors to describe the costs associated with their particular project duties, which they may then add to the model to update cost estimate estimates.
As it can see there are three comparisons have been made as shown in Figures 3-5 (tender, estimate and actual) for different residential projects. There are a great different between the actual and BIM calculation about 5% in beam calculation and 10% in DPC, 3% in brick work, 19% in concrete work and 2% in reinforcement. all these changes will have impact on the projects performance and these mistakes return to the reason that these projects were given to unqualified subcontractor which made a wrong estimation and also unsatisfied worker.
The second part for managing subcontractors is the use of artificial intelligence techniques for the prediction of its effect on the project’s performance, AI can help you with subcontractor selection, contract administration, scheduling and resource coordination, and quality and safety control. AI may also be used to improve decision-making and performance by providing you with intelligence and insights from the data you obtain from subcontracting. Since nearly 90% of the construction project is completed by subcontractors, it is critical to evaluate their performance from the beginning to the end. Many elements are influencing the execution of the subcontracted job and creating a prediction model with a classification-based algorithm to identify the skilled subcontractors. Data gathered from the construction projects of buildings was examined and put to use. Various classification techniques, including Naïve Bayes and Logistic, were employed to analyze the gathered data. Of the seven classifiers/algorithms, Naive Bayes show the higher accuracy about 0.97%.
Figure 17. Report
The last part of subcontract management is development of a system that use to manage a several problems that face the subcontractor. As shown in Figures 12 and 13, which represent the general description of the project that handled by the subcontractor.
Figure 15 show the description of the problems that the subcontractor daily faced and then send it to the main contractor in order to take an action for every problem that occur during the projects and handle it as shown in Figures 16 and 17.
Several sources were consulted in the process of creating a list of “best practices” for managing subcontractors. The suggested framework’s detailed subsystem structure is as follows:
·Subcontracting strategy system: To develop a vision and strategy for subcontractor assessment and management, the system first defines the subcontractor management aim, evaluation criteria, and a systemized index based on the four categories of the BSC. Ultimately, the subcontracting methodology is employed as the standard for evaluating subcontractors and is displayed as a subcontractor index.
·The subcontractor evaluation system calculates weighted values for each subcontractor index, evaluates subcontractor performance scores, and then multiplies the sums of the weighting and subcontractor evaluation scores to provide a total subcontractor score. This evaluation may be used separately when registering new subcontractors, during regular periodic reviews, or during frequent assessments of a particular project.
·Subcontractor management system: This subsystem uses the gathered weighting and subcontractor evaluation ratings to construct the key subcontractor index (KSI) and weak subcontractor index (WSI). The management subcontractor index MSI may be used to guide the development of a positive feedback loop that improves performance by combining the two indexes. Since this inspiring communication makes it possible to link each participant’s shared strategic objectives, it may be utilized as a standard to develop long-term cooperation. This study aims to enhance several aspects of subcontractor management, including communication, financial performance, and job performance. The key variables will be elucidated from the perspectives of all stakeholders.
- Communications
Enhancing communication is covered in the first section. The system that was built will make communication between subcontractors and other parties highly effective, according to the main contractor, and this is the most essential component that can enhance the interaction in the relationship between the main contractor and sub-contractors. The most crucial element for the subcontractor was a clear and comprehensive contract document.
Regular communication was the most significant component in the owner’s opinion. A comprehensive and transparent contract agreement was the most critical component for the consultant, and it was the most crucial factor for all parties.
- Financial
The second section, on financial improvement, highlights that using BIM would improve cost and quantity calculations by 98%, making it the most significant aspect that may enhance the interaction in the connection between primary contractors and subcontractors. The timely payment of progress to the subcontractors was the most crucial aspect for the subcontractors. For the owners, the accuracy of the project cost estimate was the most crucial element. For the consultants, timely progress payment to the subcontractor was the most severe issue, and for all respondents, it was the most severe factor.
- Work performance
The subcontractor’s enough skilled labor was the primary contractor’s most crucial aspect in the third section, which focuses on improving job performance. Accurate evaluation of the subcontractor’s performance based on the job factors may be obtained by utilizing the prediction algorithm. The subcontractor’s ability to provide sufficient competent labor was its most crucial quality. The subcontractor’s ability to provide adequate skilled labor was the owners’ most crucial concern. The subcontractor’s ability to provide adequate competent labor was deemed by the experts to be the most significant aspect, and by all respondents, it was the most problematic factor.
Subcontractors in the construction projects consider a negligible in spite that most of the problems in the projects come from the subcontractors. It is crucial for subcontractors themselves, as well as other stakeholders including project owners, surety underwriters, investors, and governmental bodies, to anticipate performance failure of construction subcontractors. In an effort to find a new model that can forecast construction contractors’ business failures more accurately.
Change order, cost, time, deviation, type of projects and the rate of project completion have a direct effect on the projects performance, as seen the in the correlation matrix, the higher the change order the lower the performance and also for deviation, on the other hand the low the cost and time the higher the performance which the projects are at line with their projected plans.
The paper’s goal was to discuss the creation, assessment, and failure of a subcontractor management system in construction projects. The majority of the work was devoted to gathering information about subcontractor management through a review of the literature and in-person and online interviews with professionals and subject matter experts. The authors have created a system that allows owners and contractors to assess subcontractor management policies and processes in order to enhance performance, given the vital role that subcontractor management plays in construction safety these days.
The algorithms that used to increase the power of the accuracy of the projects’ performance under the subcontractor’s mistakes with attributed (time, cost. change order, deviation). Naive Bayes consider the most effective way for the prediction compare to the two other algorithms.
Lastly, for all respondents, the following elements are primarily associated with improved relationships between the primary contractor and the subcontractor: communications, finances, and work performance, specifically the subcontractor’s level of ability. In order to do this, more research projects are encouraged to provide the related characteristics needed for a suitable application that aids in avoiding issues that arise when the primary contractor and the subcontractor interface.
[1] Arditi, D., Chotibhongs, R. (2005). Issues in subcontracting practice. Journal of Construction Engineering and Management, 131(8): 866-876. https://doi.org/10.1061/(ASCE)0733-9364(2005)131:8(866)
[2] Eom, C.S., Yun, S.H., Paek, J.H. (2008). Subcontractor evaluation and management framework for strategic partnering. Journal of Construction Engineering and Management, 134(11): 842-851. https://doi.org/10.1061/(ASCE)0733-9364(2008)134:11(842)
[3] Mbachu, J. (2008). Conceptual framework for the assessment of subcontractors’ eligibility and performance in the construction industry. Construction Management and Economics, 26(5): 471-484. https://doi.org/10.28991/CEJ-SP2023-09-08
[4] Polat, G., Kaplan, B., Bingol, B.N. (2015). Subcontractor selection using genetic algorithm. Procedia Engineering, 123: 432-440. https://doi.org/10.21203/rs.3.rs-1099201/v1
[5] Lew, Y.L., Hassim, S., Muniandy, R., Hua, L.T. (2018). Structural equation modelling for subcontracting practice: Malaysia chapter. Engineering, Construction and Architectural Management, 25(7): 835-860. https://doi.org/10.1108/ECAM-04-2017-0073
[6] Laryea, S. (2009). Subcontract and supply enquiries in the tender process of contractors. Construction Management and Economics, 27(12): 1219-1230. https://doi.org/10.1080/01446190903394533
[7] Abbas, N.N., Burhan, A.M. (2022). Investigating the causes of poor cost control in Iraqi construction projects. Engineering, Technology & Applied Science Research, 12(1): 8075-8079. https://doi.org/10.48084/etasr.4661
[8] Jang, Y., Jeong, I., Cho, Y.K. (2020). Business failure prediction of construction contractors using a LSTM RNN with accounting, construction market, and macroeconomic variables. Journal of Management in Engineering, 36(2): 04019039. https://doi.org/10.1061/(ASCE)ME.1943-5479.0000733
[9] Frein, J. (2012). Handbook of construction management and organization. Springer Science & Business Media, 6: 102-104. https://doi.org/10.1007/978-1-4684-1449-3
[10] Chiang, Y.H. (2009). Subcontracting and its ramifications: A survey of the building industry in Hong Kong. International Journal of Project Management, 27(1): 80-88. https://doi.org/10.1016/j.ijproman.2008.01.005
[11] Liao, C.W., Chiang, T.L. (2015). The examination of workers’ compensation for occupational fatalities in the construction industry. Safety Science, 72: 363-370. https://doi.org/10.1016/j.ssci.2014.10.009
[12] Awwad, R., El Souki, O., Jabbour, M. (2016). Construction safety practices and challenges in a Middle Eastern developing country. Safety Science, 83: 1-11. https://doi.org/10.1016/j.ssci.2015.10.016
[13] Manu, P., Ankrah, N., Proverbs, D., Suresh, S., Callaghan, E. (2009). Subcontracting versus health and safety: An inverse relationship. In Proceedings of CIB W, p. 2009.
[14] Piasny, J., Pasławski, J. (2015). Selection of subcontractors as the quality improvement tool in housing construction. Procedia Engineering, 122: 274-281. https://doi.org/10.1016/j.proeng.2015.10.036
[15] Hartmann, A., Ling, F.Y.Y., Tan, J.S. (2009). Relative importance of subcontractor selection criteria: Evidence from Singapore. Journal of Construction Engineering and Management, 135(9): 826-832. https://doi.org/10.1061/(ASCE)0733-9364(2009)135:9(826)
[16] Lavelle, D., Hendry, J., Steel, G. (2007). The selection of subcontractors: Is price the major factor? In the Proceedings of 23rd Annual ARCOM Conference, Belfast, UK, pp. 65-73. https://nrl.northumbria.ac.uk/id/eprint/2292.
[17] Marzouk, M.M., El Kherbawy, A.A., Khalifa, M. (2013). Factors influencing sub-contractors selection in construction projects. Hbrc Journal, 9(2): 150-158. https://doi.org/10.1016/j.hbrcj.2013.05.001
[18] White, H., Marasini, R. (2014). Management of interface between main contractor and subcontractors for successful project outcomes. Journal of Engineering, Project, and Production Management, 4(1): 36-50. http://doi.org/10.32738/JEPPM.201401.0005
[19] Chan, A.P., Scott, D., Lam, E.W. (2002). Framework of success criteria for design/build projects. Journal of Management in Engineering, 18(3): 120-128. https://doi.org/10.1061/(ASCE)0742-597X(2002)18:3(120)
[20] Mirawati, N.A., Othman, S.N., Mohamed Ismail, R. (2015). Supplier-contractor partnering impact on construction performance: A study on Malaysian construction industry. Journal of Economics, Business and Management, 3(1): 29-33. https://doi.org/10.7763/JOEBM.2015.V3.150
[21] Tayeh, B.A. (2009). The relationship between contractors and their subcontractors in the Gaza Strip. Ph.D. dissertation. Faculty of Engineering, Department of Civil Engineering Construction Management, Islamic University of Gaza, Palestine.
[22] Manu, E., Ankrah, N., Chinyio, E., Proverbs, D. (2015). Trust influencing factors in main contractor and subcontractor relationships during projects. International Journal of Project Management, 33(7): 1495-1508. https://doi.org/10.1016/j.ijproman.2015.06.006
[23] Rostami, A., Sommerville, J., Wong, I.L., Lee, C. (2015). Risk management implementation in small and medium enterprises in the UK construction industry. Engineering, Construction and Architectural Management, 22(1): 91-107. https://doi.org/10.1108/ECAM-04-2014-0057
[24] Daoud, A.O., El Hefnawy, M., Wefki, H. (2023). Investigation of critical factors affecting cost overruns and delays in Egyptian megaconstruction projects. Alexandria Engineering Journal, 83: 326-334. https://doi.org/10.1016/j.aej.2023.10.052
[25] Adinyira, E., Agyekum, K., Danku, J.C., Addison, P., Kukah, A.S. (2020). Influence of subcontractor risk management on quality performance of building construction projects in Ghana. Journal of Construction in Developing Countries, 25(2): 175-197. https://doi.org/10.21315/jcdc2020.25.2.7
[26] Elhusseiny, H.O., Nosair, I., Ezeldin, A.S. (2021). Developing a user plug-in to assess delay causes’ impact on construction projects in Egypt. Ain Shams Engineering Journal, 12(4): 3553-3568. https://doi.org/10.1016/j.asej.2021.04.013
[27] McCORD, P.J., Gunderson, D.E. (2014). Factors that most affect relationships with general contractors on commercial construction projects: Pacific Northwest subcontractor perspectives. International Journal of Construction Education and Research, 10(2): 126-139. https://doi.org/10.1080/15578771.2013.856824
[28] Godager, B., Onstein, E., Huang, L. (2021). The concept of enterprise BIM: Current research practice and future trends. IEEE Access, 9: 42265-42290. https://doi.org/10.1109/ACCESS.2021.3065116
[29] Olbina, S., Elliott, J.W. (2019). Contributing project characteristics and realized benefits of successful BIM implementation: A comparison of complex and simple buildings. Buildings, 9(8): 175. https://doi.org/10.3390/buildings9080175
[30] Topcu, Y.I. (2004). A decision model proposal for construction contractor selection in Turkey. Building and Environment, 39(4): 469-481. https://doi.org/10.1016/j.buildenv.2003.09.009
[31] Kocakaya, M.N., Namlı, E., Işıkdağ, Ü. (2019). Building information management (BIM), a new approach to project management. Journal of Sustainable Construction Materials and Technologies, 4(1): 323-332. http://doi.org/10.29187/jscmt.2019.36
[32] Atkinson, R. (1999). Project management: Cost, time and quality, two best guesses and a phenomenon, its time to accept other success criteria. International Journal of Project Management, 17(6): 337-342. https://doi.org/10.1016/S0263-7863(98)00069-6
[33] Cho, K., Hong, T., Hyun, C. (2009). Effect of project characteristics on project performance in construction projects based on structural equation model. Expert Systems with Applications, 36(7): 10461-10470. https://doi.org/10.1016/j.eswa.2009.01.032
[34] Piryonesi, S.M., El-Diraby, T.E. (2020). Role of data analytics in infrastructure asset management: Overcoming data size and quality problems. Journal of Transportation Engineering, Part B: Pavements, 146(2). https://doi.org/10.1061/JPEODX.0000175
[35] Piryonesi, S.M., El-Diraby, T.E. (2021). Using machine learning to examine impact of type of performance indicator on flexible pavement deterioration modeling. Journal of Infrastructure Systems, 27(2). https://doi.org/10.1061/(ASCE)IS.1943-555X.0000602
[36] Sailusha, R., Gnaneswar, V., Ramesh, R., Rao, G.R. (2020). Credit card fraud detection using machine learning. In 2020 4th International Conference on Intelligent Computing and Control Systems (ICICCS), Madurai, India, pp. 1264-1270. https://doi.org/10.1109/ICICCS48265.2020.9121114
[37] Sahami, M., Dumais, S., Heckerman, D., Horvitz, E. (1998). A Bayesian approach to filtering junk e-mail. In Learning for Text Categorization: Papers from the 1998 Workshop, pp. 98-105.
[38] Androutsopoulos, I., Koutsias, J., Chandrinos, K.V., Paliouras, G., Spyropoulos, C.D. (2000). An evaluation of Naïve Bayesian anti-spam filtering. https://doi.org/10.48550/arXiv.cs/0006013
[39] Ogwueleka, A.C., Maritz, M.J. (2013). A review of incentive issues in the South African construction industry: The prospects and challenges. ICCREM 2013: Construction and Operation in the Context of Sustainability, pp. 83-98. https://doi.org/10.1061/9780784413135.008
[40] Choudhry, R.M., Hinze, J.W., Arshad, M., Gabriel, H.F. (2012). Subcontracting practices in the construction industry of Pakistan. Journal of Construction Engineering and Management, 138(12): 1353-1359. https://doi.org/10.1061/(ASCE)CO.1943-7862.0000562
[41] Olatunji, S.O., Aghimien, D.O., Oke, A.E., Akinpelu, T.M. (2016). Assessment of the use of subcontracting options for construction project delivery. Civil and Environmental Research, 8(5).
[42] Esaiyas, S., Kahssay, G. (2020). Challenges facing local contractors working with Chinese contractors in Addis Ababa building projects. American Journal of Civil Engineering, 8(4): 87-96. https://doi.org/10.11648/j.ajce.20200804.12
[43] Assbeihat, J.M. (2016). Factors affecting the performance of electromechanical subcontractors in construction projects (Jordan case). European International Journal of Science and Technology, 5(2): 32-40. https://doi.org/10.5455/NJEAS.151851
[44] Gareth, J., Daniela, W., Trevor, H., Robert, T. (2013). An Introduction to Statistical Learning: With Applications in R. Springer, Berlin, Heidelberg.
[45] Liang, J., Bi, G., Zhan, C. (2020). Multinomial and ordinal logistic regression analyses with multi-categorical variables using R. Annals of Translational Medicine, 8(16). https://doi.org/10.21037%2Fatm-2020-57
[46] Prifti, V., Dhoska, K. (2022). Information systems in project management and their role in decision making. International Journal on Technical and Physical Problems of Engineering, 14(4): 189-194.
[47] Abed, Y.G., Hasan, T.M., Zehawi, R.N. (2022). Cost prediction for roads construction using machine learning models. International Journal of Electrical and Computer Engineering Systems, 13(10): 927-936. https://doi.org/10.32985/ijeces.13.10.8
[48] Lakshmi, T.M., Martin, A., Begum, R.M., Venkatesan, V.P. (2013). An analysis on performance of decision tree algorithms using student’s qualitative data. International Journal of Modern Education and Computer Science, 5(5): 18-27. http://doi.org/10.5815/ijmecs.2013.05.03
[49] Bansal, M., Goyal, A., Choudhary, A. (2021). Industrial Internet of Things (IIoT): A vivid perspective. In Inventive Systems and Control: Proceedings of ICISC 2021, Singapore, pp. 939-949. http://doi.org/10.1007/978-981-16-1395-1_68
[50] Shtino, V.B., Muça, M. (2023). Comparative study of K-NN, Naive Bayes and SVM for face expression classification techniques. Balkan Journal of Interdisciplinary Research, 9(3): 23-32. https://doi.org/10.2478/bjir-2023-0015
[51] Sheth, V., Tripathi, U., Sharma, A. (2022). A comparative analysis of machine learning algorithms for classification purpose. Procedia Computer Science, 215: 422-431. https://doi.org/10.1016/j.procs.2022.12.044
[52] Sperandei, S. (2014). Understanding logistic regression analysis. Biochemia Medica, 24(1): 12-18. https://doi.org/10.11613/BM.2014.003