Qianhan Zhang* | Shiyue Zheng
© 2024 The authors. This article is published by IIETA and is licensed under the CC BY 4.0 license (http://creativecommons.org/licenses/by/4.0/).
OPEN ACCESS
To investigate the causes of accidents during the construction phase of wind power projects and to prevent their occurrence, this study draws on accident investigation reports and the "2-4"Model to summarize unsafe behaviors and actions. It selects causative variables from four aspects: human, equipment, environment, and management. Integrating fault tree analysis, a Bayesian network (BN) model for analyzing the causes of accidents during wind power engineering construction is constructed using the BN software, GeNie. The model undergoes structural and parameter learning, calculating the conditional probability distribution and posterior probabilities of each node. Through variable sensitivity and analysis of the most significant causative chains of accidents, the key factor paths leading to accidents are identified, contributing to reducing the accident rate during the construction phase of wind power projects. The results indicate that inadequate personal protection and violations of regulations are prevalent among human factors. In terms of management factors, insufficient safety management and supervision are the main contributors to accidents, with a probability value exceeding 70%. Geological conditions, road conditions, limited workspace, exceptional environmental changes, proximity to energized machines, and safety protection equipment failures are significant factors in accidents during the construction phase.
accidents during wind power engineering construction, Bayesian network (BN), posterior probabilities
In recent years, countries around the world have largely reached a consensus on reducing carbon dioxide emissions. With the continuous improvement of integrated utilization technologies for renewable energy, wind energy, alongside solar energy, has become a major source of renewable energy. To further enhance the utilization rate of wind resources and energy capture efficiency, the wind power industry is trending towards the construction of larger units and the development of wind power projects in areas with high altitude, low wind speed, and distant offshore locations [1]. The high demand for reliability in the wind power industry is reflected in the safety analysis of wind turbine units, and research on engineering safety is critical not only during the operation and maintenance phase but also during the preliminary design and construction phases to ensure the safety of the engineering systems. To ensure the safety of wind power construction, reduce the accident rate during the construction period, and protect the lives and property of personnel involved in wind power engineering construction, this paper focuses on the causal factors of accidents during the construction period. It incorporates human unsafe behaviors and unsafe states of objects as basic events into the fault tree structure, transforming these into a fault tree-BN model through GeNie for visualization, reverse diagnosis, and accident cause analysis. This lays the foundation for subsequent risk analysis and assessment, playing a significant role in preventing accidents.
Currently, many accident models are based on systems theory, describing the accident process as a complex, interrelated network of events rather than just simple causal chains. In 2005, scholar Lyu et al. [2] proposed the "2-4" Model of accident causation, combining personal behavior (human factor analysis) and organizational behavior (organizational analysis) based on previous studies and the current state of safety management in China. This research aims to establish a safety accident causation model for wind power engineering based on the "2-4" Model, analyzing its feasibility and effectiveness in the analysis of accidents during the construction phase of wind power projects, and summarizing unsafe actions and states from accident samples. The "2-4" Model has been applied in various fields including coal mine safety, construction electrical fire accidents, gas explosion accidents, high-altitude fall accidents, general aviation accidents, food and chemical accident statistical analysis, highway traffic accidents, and urban underground space pipeline collapses. Lyu et al. [2] compared ten different accident causation models, with the description of accident pathways evolving from linear to networked systems, although the "2-4" Model lacks in probabilistic analysis.
Scholars like Zhou et al. [3] have used dynamic BN models for risk assessment of offshore wind farms, establishing dynamic BN models in GeNie, and evaluating their effectiveness in risk analysis at different lifecycle stages of offshore wind farms. Other researchers, such as Zhang, have designed a complete Engineering, Procurement, and Construction (EPC) project management system covering project risk identification, analysis, response, and risk control management, proposing a Bayesian fault tree-based engineering risk assessment strategy for intelligent risk management and control of wind power projects [4]. Adedipe et al. [5] have systematically reviewed and evaluated the existing research on the use of BN models in the wind energy field, demonstrating their wide application from wind power and weather forecasting to risk management, fault diagnosis and prediction, structural analysis, reliability evaluation, and maintenance planning and updating. Yu et al. [6] developed a semi-qualitative risk model by combining BN with Evidence Reasoning (ER) methods to assess the risk of ship-turbine collisions, verifying the BN model through sensitivity analysis and other methods, indicating that the minimum passing distance is a key factor in the risk of collisions between ships and offshore wind turbines.
BN can demonstrate its potential applicability in modeling risks and reliability in different complex systems, considering different system levels and their interactions through causal methods. Thus, BN has significant potential research and practical value in the field of wind power engineering safety. While researchers have extensively applied BN for diverse risk assessments in offshore wind farms and have utilized them in fields spanning from wind energy forecasting, project risk management, to fault diagnosis of wind turbine equipment, structural analysis, reliability evaluation, and maintenance, there remains a notable gap in focusing on accident causation factors associated with onshore wind power engineering construction projects. Specifically, analyses based on the "2-4" Model, encompassing fault tree-BN modeling and the examination of the most critical causation chains, have not been sufficiently explored. Therefore, this study on the accident causation factors involved in the construction period of onshore wind power engineering projects based on BN has significant research value and innovation.
This paper primarily explores the following three issues: (1) How to incorporate human unsafe behaviors and unsafe states of objects as basic events into the fault tree structure diagram during the construction period of wind power engineering accidents. (2) To construct a fault tree-BN model, perform visualization with the help of GeNie, and analyze and diagnose the causes of accidents. (3) What are the key means and effective methods to reduce the occurrence of accidents during the construction period of wind power projects?
Given the short construction cycle, high intensity, and high-quality requirements of wind power engineering projects, along with the harsh natural conditions and adverse environments of wind farms, the safety management capabilities and awareness of construction personnel are relatively low, presenting unique challenges and difficulties in improving the safety management system of wind power projects. Based on the "2-4" Model, this paper establishes a fault tree-BN model of safety accident causation for onshore wind power engineering during the construction period, clarifying the network model of accidents occurring during this phase, which has significant theoretical and practical significance for improving the safety of wind power construction projects, and enhancing the safety level of wind power engineering construction.
2.1 Theories of accident causation
The theories of accident causation aim to explain the mechanisms behind accidents, helping to understand their occurrence, development, and formation, as well as to prevent and control them. Over the years, research across various scientific fields and industries has led to the development of numerous theories of accident causation, enabling a deeper analysis of the fundamental reasons behind accidents with the goal of their control and prevention.
Internationally, in 1931, William Heinrich published the book Industrial Accident Prevention: A Scientific Approach, marking a pioneering work in the field of industrial safety. This scientific approach to accident prevention was based on extensive study and data analysis from insurance company databases. However, due to its inability to adequately explain accidents in complex socio-technical systems, James Reason introduced the "Swiss Cheese" model in his 1990 book Human Error. This model suggested that safety barriers, such as procedures, training, and equipment, are like slices of cheese with holes that can align, allowing errors to pass through and cause accidents [7]. This model aimed to explain the causal relationships in complex system accidents, leading to the development of practical tools like the Human Factors Analysis and Classification System (HFACS) and the Incident Cause Analysis Method (ICAM). However, the Swiss Cheese model, with its linear thinking, fails to describe the dynamic and nonlinear interactions between components in complex socio-technical systems [2]. Current accident models, based on systems theory, describe the accident process as a complex, interconnected network of events rather than simple causal chains. Lyu et al. [2] compared ten types of accident causation models, showing an evolution from linear to networked descriptions of accident pathways, such as Rasmussen's Hierarchical Model of Socio-technical System (SMSS) [8], the Accident Analyse Mapping (AcciMap), the Systems Theoretic Accident Model and Processes (STAMP) proposed by Leveson [9], the Cognitive Reliability and Error Analysis Method (CREAM), the "2-4" Model, and the Functional Resonance Analysis Method (FRAM).
2.2 The "2-4" Model
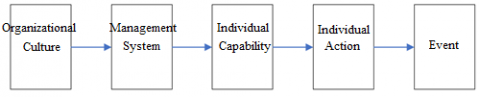
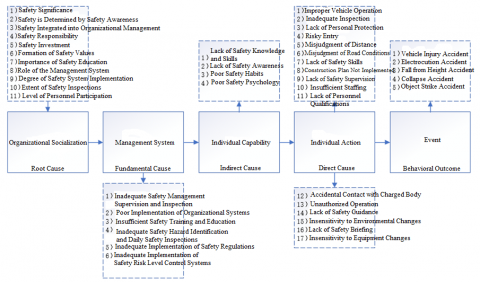
The "2-4" Model specifies management factors, positing that the root cause of accidents lies in the deficiencies of the safety management system of the organization responsible for the accident. A safety management system can be established according to Occupational Health and Safety Management System standards or can naturally form without following these standards. According to the "2-4" Model, accident causes or causative factors are divided into two main categories: organizational factors and individual factors. Organizational factors are further divided into safety culture and safety management systems, while individual factors are divided into personal safety capabilities and safe actions of individuals and objects. This division into two main categories and four subcategories, together with the accidents, forms a new model of accident causation [2]. The accident causation model is also a model for accident prevention, with the "2-4" Model highlighting the evolutionary relationships between the four causes of accidents, hence it is also known as the behavioral safety "2-4" Model [10], and the static structure of the sixth edition of the "2-4" Model is shown in Figure 1. Based on previous statistical analysis of accidents, a static structure of the causes of safety accidents during the construction period of wind power engineering based on the "2-4" Model is constructed as shown in Figure 2. From previous accident reports, accidents during the wind power engineering construction period are classified into five categories: vehicle injuries, electric shocks, falls from heights, collapses, and object strike accidents, summarizing 17 unsafe individual actions, 4 individual capabilities, 6 management system defects, and 11 root causes of safety culture deficiencies.
Li et al. [11] proposed the "2-4" Model for risk analysis based on coal mine gas explosion injuries, resulting in the identification of 6 unsafe conditions, 25 unsafe behaviors, 13 pieces of safety knowledge, and 13 elements of safety management systems. The application of the "2-4" Model and analysis methods can help employees clearly see the evolution process of injuries and identify the causes of injuries, better understand the logical relationship with the causes of injuries, and improve the effectiveness of training. Lyu et al. [2] developed a conceptual framework for intelligent safety management using the "2-4" Model, their study showed that the intelligent safety management framework based on the "2-4" Model could integrate the functionalities of existing intelligent safety management, establish management sustainability, and improve data quality. An et al. [10] analyzed 28,445 miners from 320 coal mines in China, showing that unconscious unsafe behaviors are predicted by human safety capabilities, while deliberate unsafe behaviors should primarily be predicted by psychological driving factors. Based on the literature analysis, the "2-4" Model has potential applicability in various accident analyses and risk analyses due to its ability to elucidate the logical relationships between causes and predict accident factors. However, there is less research on the application of the model in the field of wind power engineering safety accidents, indicating a need for further analysis and research to fill the gaps in the application of the "2-4" Model in the safety domain of wind power engineering.
Figure 1. The static structure of the 6th edition of the "2-4" Model
Figure 2. The static structure of the causes of safety accidents during the construction period of wind power engineering based on the "2-4" Model
2.3 About the BN
BN, first introduced by Pearl in 1988, also known as Bayesian Belief Network (BBN), aims to provide a probabilistic framework for addressing and quantifying the causal relationships and interactions under uncertainty. The overall architecture of a system is modeled using BN, and the dynamics of the system are realized through the interactions of variables and agents within and between different levels of the environment, organization, human, and technical factors of the system. A BN is a graphical model consisting of directed acyclic graphs, where nodes represent variables, and directed links between nodes represent causal relationships. If a variable is discrete, the probabilistic relationship of each node X to its respective parent nodes is defined by its Conditional Probability Table (CPT), and for continuous variables, this probabilistic relationship is defined by their conditional probability distributions. The joint probability distribution of a network with n nodes can be found using the chain rule:
$P\left(x_1, x_2, \ldots x_n\right)=\prod_{i=1}^n P\left(x_i \mid\right.$ parent $\left.x_i\right)$ (1)
where, $\mathrm{P}\left(\mathrm{x}_1, \mathrm{x}_2, \ldots \mathrm{x}_{\mathrm{n}}\right)$ represents the probability distribution of target nodes, $\mathrm{P}\left(\mathrm{x}_{\mathrm{i}} \mid\right.$ parent $\left.\mathrm{x}_{\mathrm{i}}\right)$ represents the conditional probability distribution of nodes, $parentx _i$ represents the probability distribution of the parent nodes. Based on the assumption of conditional independence, all nodes $x_i$ and the target node x are conditionally independent of each other, thus allowing the joint probability distribution (Eq. (1)) to be solved using the chain rule [12]. For example, in a BN as shown in Figure 3, its joint probability distribution can be expressed as:
$P\left(X_1, X_2, X_3\right)=P\left(X_1 \mid X_2, X_3\right) \times P\left(X_2, X_3\right) \times P\left(X_3\right)$ (2)
Through BN, the paths of accidents can be considered retrospectively in a backward manner, and several potential scenarios and their impacts on system safety can be predicted and analyzed in a forward-looking predictive manner. BN has been widely used in various safety research fields due to its visualization capabilities and the ability to perform bi-directional (i.e., forward predictive and backward diagnostic) risk analysis. A typical BN model, as illustrated in Figure 1, consists of nodes and directed arcs. The nodes represent random variables, which can express the score states of risk impact factors and the probability of being in different score states. Directed arcs represent the logical relationship between two connected nodes, with the direction from the parent node to the child node, where the child node is assigned a CPT that expresses the conditional dependence relationship between the two nodes.
Figure 3. Example of a BN
Scholars both domestically and internationally have applied BN for reliability analysis and fault diagnosis. For instance, Li et al. [13] used BN to model and analyze the reliability of floating offshore wind turbines, identifying the key systems, components, and reliability influencing factors through BN diagnostic analysis. Wang et al. [14] developed a data-driven BN method with a spatio-temporal vulnerability model to study the dependency between lightning strikes and Overhead Contact Line (OCL) faults, predicting the risk of OCL failures related to lightning strikes. However, the construction of complex BN models and the corresponding probabilistic reasoning have become a reality and are widely applied in engineering management, especially in the field of safety engineering. Li et al. [15] utilized fuzzy logic theory combined with BN to assess the risk of underground gas explosions in coal mines, finding that fan failure and electrical failure are the two most significant risk factors. Yan and Wu [16] built a BN model for the causation analysis of coal mine roof accidents using software GeNie and employed the Expectation Maximization (EM) algorithm for model parameter training. By using reverse reasoning, sensitivity, and maximum causation chain analysis, the most significant causation path impacting roof accidents was identified. In 2023, they furthered their research on the causation risk of coal and gas outburst accidents using Dempster-Shafer (DS) evidence theory and BN, applying parameter learning to calculate their conditional and posterior probabilities, identifying key factors causing accidents [17]. Waskito et al. [18] used BN analysis to identify relationships between accident patterns within the HFACS framework, showing that driver violations had the most significant impact on fatalities and multi-vehicle accidents.
In summary, based on the deficiencies in probabilistic analysis described by the "2-4" Model, this paper proposes to use BN to analyze specific causation paths and important factors in wind power engineering safety accidents. Previous applications of BN in the field of wind power have focused on risk and reliability analysis and fault diagnosis. This research could further expand the practical value of BN in the field of wind power engineering safety.
3.1 Fault tree analysis method
Fault tree analysis is a graphical analysis method that identifies the causal and logical relationships between various factors related to an accident, tracing from the outcome to the causes. Starting with a specific accident or failure for analysis, it delves into the causes layer by layer until the basic causes, or basic events, are found. After constructing the model, the fault tree uses Boolean algebra to list its mathematical expressions. Boolean algebra is particularly suited to describing the accident process that takes two opposite states. The structure function describes the system's state, completely dependent on the condition of elements or components. It is usually assumed that at any time, elements, components, and the system can only be in a normal or failure state, and at any moment, the system's state is uniquely determined by the state of its elements or components. Assuming a fault tree system is composed of n basic events, the event state function can be defined as:
$\mathrm{x}=\left(\mathrm{x}_1, \mathrm{x}_2, \ldots, \mathrm{x}_{\mathrm{n}}\right)$
where, xi is the state variable of the i-th basic event.
$x_i=\left\{\begin{array}{c}1 \text { indicates that event } \mathrm{i} \text { occurs }(\mathrm{i}=1,2, \ldots, \mathrm{n}) \\ 0 \text { indicates that event } \mathrm{i} \text { does not occur }(\mathrm{i}=1,2, \ldots, \mathrm{n})\end{array}\right.$
The state of the top event depends on the state of all basic events, i.e., y is a function of x:
$y=\varphi(x)$ is referred to as the fault tree's structure function. y=1 indicates the occurrence of the top event; y=0 indicates the non-occurrence of the top event. The fault tree is composed of events and logic gates, with events divided into bottom events, intermediate events, and top events. Bottom events are located at the lowest end of the fault tree structure diagram, consisting of basic events and undetermined events; intermediate events are the result events between the top event and bottom events; the top event is the target event of study, located at the top of the fault tree, with logic gates divided into AND and OR gates.
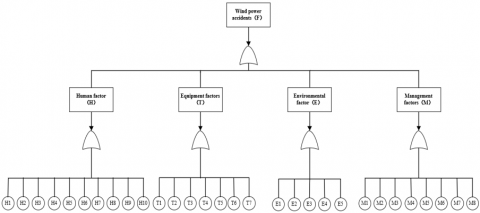
By analyzing human unsafe behaviors and unsafe states of objects during the construction period of wind power engineering through the "2-4" Model as basic events, they are categorized into human factors, equipment factors, environmental factors, and management factors as intermediate events, with accidents during the construction period of wind power engineering as the top event, to compile a fault tree.
3.2 BN modeling method
Compared to fault tree analysis, BN can perform bidirectional reasoning, but its structure learning is relatively complex. Converting a fault tree into a BN offers a clearer and more convenient approach. The correspondence between the bottom events, intermediate events, top events, and logic gates in the fault tree and the nodes and logical connections between nodes in the BN are as follows: (1) The bottom events of the fault tree correspond to the root nodes in the BN; (2) Intermediate events correspond to non-root nodes, and top events correspond to leaf nodes; (3) The input-output relationship of AND and OR gates in the fault tree corresponds to the direction of directed edges in the BN.
By using the above correspondences, the fault tree is converted into a BN. This paper utilizes Bayesian theory and the software tool GeNie for visualization operations and employs the EM algorithm for parameter learning to obtain the BN model. GeNie, a BN learning and inference software developed by Bayes Fusion, LLC, based on the Decision Systems Laboratory at the University of Pittsburgh, is a professional tool for BN modeling.
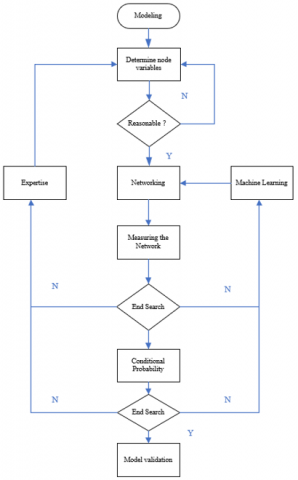
The general process of BN modeling (as shown in Figure 4) includes:
(1) Selection and definition of network node variables are based on the knowledge of experts in the relevant field. The chosen variables should be representative and crucial, with a strong relevance to the problem being solved. The selection of node variables has a significant impact on the model's accuracy in representing reality. It is a complex process that requires experts to deliberate repeatedly.
(2) Determination of the domain of network node variables. Once node variables are determined, the range of values for the variables is defined based on expert knowledge. Typically, the values of variables are discrete, such as occurrence or non-occurrence.
(3) Analysis of variable correlations. Based on expert experience or statistical methods, the correlations between variables are analyzed to determine the ranking of variable correlations. Variables with lower correlations are excluded to further optimize the selection of node variables.
(4) Structural learning and parameter learning. Using case data and referring to different learning algorithms, the structure of the model and the learning of parameter probability distributions are conducted. The process of network construction should fully utilize expert knowledge to check the model's effectiveness and logical correctness in solving practical problems.
(5) Model validation and inference. After the BN model is established, it is necessary to validate the scientific validity and effectiveness of the model with examples. If there is a significant deviation from actual situations, the model should be corrected promptly to ensure that the inference meets the requirements of precision and accuracy.
Figure 4. BN modeling process
4.1 Data source and variable settings
For the research period from 2013 to 2023, accident investigation reports related to the construction period of wind power engineering projects were collected and organized from the official websites of the National Energy Administration and various provincial and municipal emergency management bureaus as data sources. A total of 41 cases of wind power engineering construction accidents were obtained for analysis and investigation reports. Based on expert opinions and the analysis of unsafe actions and unsafe states obtained from Figure 2, a summary and simplification of names were conducted. Variables were considered from four aspects: human, equipment, environment, and management, as shown in Table 1.
Table 1. Variable settings for wind power accident causation
|
Category |
Variable Name |
Variable Symbol |
Variable Value |
|
Accident |
Wind Power Engineering Construction Accident |
F |
1(Occurs)2(Does Not Occur) |
|
Human Factors (H) |
Proper Vehicle Operation |
H1 |
1(Yes)2(No) |
|
Personal Protection |
H2 |
1(Adequate)2(Inadequate) |
|
|
Distance Judgment |
H3 |
1(Correct)2(Mistake) |
|
|
Safety Work Skills |
H4 |
1(Possessed)2(Lacking) |
|
|
Personnel Qualification |
H5 |
1(Possessed)2(Lacking) |
|
|
Risky Entry |
H6 |
1(Yes)2(No) |
|
|
Accidental Contact with Charged Body |
H7 |
1(Yes)2(No) |
|
|
Unauthorized Operation |
H8 |
1(Yes)2(No) |
|
|
Equipment Misuse |
H9 |
1(Yes)2(No) |
|
|
Sensitivity to Equipment Changes |
H10 |
1(High)2(Low) |
|
|
Equipment Factors (T) |
Transportation of Wind Turbine Blades, Towers, Gearboxes |
T1 |
1(Yes)2(No) |
|
Lifting Equipment |
T2 |
1(Normal)2(Faulty) |
|
|
Equipment Carrying Hazardous Voltage |
T3 |
1(Yes)2(No) |
|
|
Distance to Charged Body |
T4 |
1(Close)2(Far) |
|
|
Safety Protection Equipment Failure |
T5 |
1(Yes)2(No) |
|
|
Equipment Installation Compliant with Regulations |
T6 |
1(Yes)2(No) |
|
|
Failure of Wind Turbine and Its Auxiliary Equipment |
T7 |
1(Yes)2(No) |
|
|
Environmental Factors (E) |
Geological Issues |
E1 |
1(Yes)2(No) |
|
Road Condition Issues |
E2 |
1(Yes)2(No) |
|
|
Abnormal Weather |
E3 |
1(Yes)2(No) |
|
|
Limited Working Platform/Space at Height |
E4 |
1(Yes)2(No) |
|
|
Abnormal Changes in Workplace Environment |
E5 |
1(Yes)2(No) |
|
|
Management Factors (M) |
Safety Management Supervision |
M1 |
1(Adequate)2(Inadequate) |
|
Execution of Safety and Organizational Systems |
M2 |
1(Adequate)2(Inadequate) |
|
|
Safety Training, Education, and Guidance |
M3 |
1(Adequate)2(Inadequate) |
|
|
Accident Hazard Investigation |
M4 |
1(Adequate)2(Inadequate) |
|
|
Safety Risk Level Control System |
M5 |
1(Adequate)2(Inadequate) |
|
|
Daily Safety Inspection |
M6 |
1(Adequate)2(Inadequate) |
|
|
Safety Briefing |
M7 |
1(Possessed)2(Lacking) |
|
|
Staffing |
M8 |
1(Sufficient)2(Insufficient) |
Figure 5. Fault tree of wind power engineering construction accident
Figure 6. BN model of causation for wind power engineering construction accident
4.2 Model construction
Initially, a fault tree model was constructed with a wind power accident (F) as the top event, as shown in Figure 5. The relationships between related variables were determined based on questionnaires and expert judgments from within the wind power engineering industry, as indicated in Table 2. The relationship between the bottom events, intermediate events, top events, and logic gates in the fault tree is mirrored in the BN through the nodes and their logical connections, establishing a correspondence that facilitates the transformation of these elements into a coherent BN structure.
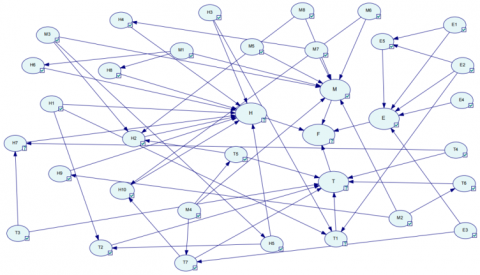
The processed structured data is imported into the BN software GeNie, where structural learning is conducted with the help of relevant algorithms. Based on this, the BN model is adjusted and corrected in conjunction with the results of the node correlation analysis, resulting in the final construction of the BN model for causation of accidents during the construction period of wind power engineering, as shown in Figure 6, it can be observed that the BN model reflects the causes of accidents during the construction period of wind power engineering and the causal relationships between these causes. The arrows between nodes point from cause to effect, indicating the relationships between two variables. The node F (wind power engineering construction accident) is the subject of the model, showing clear intrinsic causal logical relationships with H (human factors), T (equipment factors), E (environmental factors), and M (management factors). There are also close causal relationships between other nodes, studying these relationships can delve into the causes of accidents during the construction period of wind power engineering, finding the most important causative factors from the root.
Table 2. Relationship between related variables
|
Influencing Variable |
Influenced Variable |
Direction of Relationship |
Expert Opinion(Y=1; N=0) |
|
H1 |
T1 |
H1→T1 |
1 |
|
H3 |
T1 |
H3→T1 |
1 |
|
E2 |
T1 |
E2→T1 |
1 |
|
E2 |
T1 |
E2→T1 |
1 |
|
T3 |
H7 |
T3→H7 |
1 |
|
T4 |
H7 |
T4→H7 |
1 |
|
T5 |
H2 |
T5→H2 |
1 |
|
M8 |
H2 |
M8→H2 |
1 |
|
M3 |
H2 |
M3→H2 |
1 |
|
M6 |
H10 |
T6→H10 |
1 |
|
T7 |
H10 |
T7→H10 |
1 |
|
E1 |
E5 |
E1→E5 |
1 |
|
E2 |
E5 |
E2→E5 |
1 |
|
E3 |
T7 |
E3→T7 |
1 |
|
M4 |
T7 |
M4→T7 |
1 |
|
M1 |
H6 |
M1→H6 |
1 |
|
M1 |
H8 |
M1→H8 |
1 |
|
M2 |
H9 |
M2→H9 |
1 |
|
M3 |
H5 |
M3→H5 |
1 |
|
M4 |
T5 |
M4→T5 |
1 |
|
M7 |
H4 |
M7→T4 |
1 |
|
H5 |
T2 |
H5→T2 |
1 |
|
M2 |
T6 |
M2→T6 |
1 |
|
H1 |
E1 |
H1→E1 |
0 |
|
H2 |
T2 |
H2→T1 |
0 |
|
H3 |
T2 |
H3→T2 |
0 |
|
H4 |
M1 |
H4→M1 |
0 |
5.1 Model validation
To verify the reliability and predictability of the BN model, effective cross-validation of the network model is conducted. The Leave-One-Out Cross-Validation method is used to calculate the effectiveness of the prediction accuracy for each node in the model. The validation results are shown in Table 3. Among the 34 nodes, the precision of node E reached the highest at 0.947368, followed by F at 0.938235. Overall, the prediction accuracy for most nodes is above 0.8. This indicates that the BN model constructed in this paper has a high prediction accuracy and is suitable for reasoning and analyzing the causation relationships of accidents during the construction period of wind power engineering.
Table 3. Cross-validation results of the model
|
Node |
Accuracy |
Node |
Accuracy |
|
F |
0.938235 |
H1 |
0.807018 |
|
E |
0.947368 |
H2 |
0.807018 |
|
E1 |
0.824561 |
H3 |
0.824561 |
|
E2 |
0.894737 |
H4 |
0.596491 |
|
E3 |
0.824561 |
H5 |
0.824561 |
|
E4 |
0.859649 |
H6 |
0.859649 |
|
E5 |
0.877193 |
H7 |
0.859649 |
|
M |
0.877193 |
H8 |
0.842105 |
|
M1 |
0.70175 |
H9 |
0.578947 |
|
M2 |
0.614035 |
H10 |
0.631579 |
|
M3 |
0.894737 |
T |
0.526316 |
|
M4 |
0.578947 |
T1 |
0.894737 |
|
M5 |
0.561404 |
T2 |
0.631579 |
|
M6 |
0.754386 |
T3 |
0.807018 |
|
M7 |
0.842105 |
T4 |
0.859649 |
|
M8 |
0.807018 |
T5 |
0.912281 |
|
H |
0.77193 |
T6 |
0.684211 |
5.2 Parameter learning
Parameter learning in BN aims to determine the conditional probability distributions of node variables, quantifying the degree of dependency relationships between model node variables. Currently, the main parameter learning algorithms include the Bayesian method, the EM algorithm, and the Maximum Likelihood Estimation (MLE) method, etc. In this case, the EM algorithm is chosen mainly because it can perform MLE of parameters in the presence of missing data, making it well-suited for handling various types of incomplete data. The basic steps of the EM algorithm are as follows:
(1) Calculate $\mathrm{z}^{(\mathrm{i})}=\mathrm{E}\left[\mathrm{Z} \mid \mathrm{y}, \hat{\theta}^{(\mathrm{i})}\right]$;
(2) Expand the observed data y to (y, $\left.\mathrm{z}^{(\mathrm{i})}\right)$, maximize $\pi\left(\theta \mid y, z^{(i)}\right)$, denoting its maximum value as $\hat{\theta}^{(i+1)}$;
(3) Use $\hat{\theta}^{(\mathrm{i}+1)}$ and the results from step (1) to obtain $\mathrm{z}^{(\mathrm{i}+1)}$, which is then substituted into step (2), repeating this process until convergence criteria are met.
where, y represents the observed data, z represents the missing data or latent variable data, $\mathrm{p}(\mathrm{z} \mid \mathrm{y}, \hat{\theta})$ is the predictive distribution of $\mathrm{Z}$ given $y, \hat{\theta} ; \hat{\theta}^{(\mathrm{i})}$ is the estimate at the i-th iteration.
Through parameter learning of the BN, the conditional probabilities between nodes can be obtained. Due to the large number of nodes and limitations in space, this analysis will focus on the conditional probability distributions of key nodes H2 (Personal Protection), M4 (Accident Hazard Investigation), and M5 (Safety Risk Level Control).
From Table 4, it is known that when safety equipment fails, if personnel safety training is adequate and personnel are sufficiently staffed, then the probability of personal protection issues occurring is 0.5. However, even if personnel safety training is adequate, if staffing is insufficient when safety equipment fails, the probability of inadequate personal protection issues occurring is 0.78. If safety equipment fails and personnel safety training is inadequate, regardless of whether staffing is sufficient, personal protection issues are likely to arise. Inadequate personnel education and staffing can affect the adequacy of personal protection in wind power engineering.
When safety equipment is functioning properly, and personnel safety training is adequate with sufficient staffing, the probability of personal protection issues being adequately addressed is 0.88. If safety equipment is functioning properly but personnel safety training is inadequate, even with sufficient staffing, the probability of inadequate personal protection issues occurring is 0.84. If safety equipment is functioning properly, personnel safety training is inadequate, and staffing is insufficient, the probability of inadequate personal protection issues occurring is 0.71.
From Table 5, it is known that during abnormal weather conditions, if accident hazards are adequately addressed, the probability of failure in the wind turbine and its auxiliary equipment not occurring is 0.66; if accident hazards are not adequately addressed, the probability of failure occurring is 0.5. During normal weather conditions, if accident hazards are adequately addressed, the probability of failure in the wind turbine and its auxiliary equipment not occurring is 1.
Table 4. CPT for node H2
|
Parent Node State |
Conditional Probability of Child Node H2 |
|||
|
T5 |
M3 |
M8 |
Y |
N |
|
Y |
Y |
Y |
0.5 |
0.5 |
|
N |
0.22 |
0.78 |
||
|
Y |
N |
Y |
0 |
1 |
|
N |
0 |
1 |
||
|
N |
Y |
Y |
0.88 |
0.11 |
|
N |
1 |
0 |
||
|
N |
N |
Y |
0.16 |
0.84 |
|
N |
0.29 |
0.71 |
||
Table 5. CPT for child node T7
|
Parent Node State |
Conditional Probability of Child Node T7 |
||
|
E3 |
M4 |
Y |
N |
|
Y |
Y |
0.33 |
0.66 |
|
N |
0.5 |
0.5 |
|
|
N |
Y |
0 |
1 |
|
N |
0.1 |
0.9 |
|
Table 6. CPT for child node H7
|
Parent Node State |
Conditional Probability of Child Node H7 |
||
|
T3 |
T4 |
Y |
N |
|
Y |
Y |
0.73 |
0.27 |
|
N |
0.27 |
0.73 |
|
|
N |
Y |
0 |
1 |
|
N |
0 |
1 |
|
From Table 6, it is known that when equipment carries hazardous voltage and is close to a charged body, the probability of accidentally touching the charged body is 0.73. When equipment does not carry hazardous voltage, the distance to the charged body does not affect the occurrence of danger from accidentally touching the charged body.
5.3 Reverse inference of BN model nodes
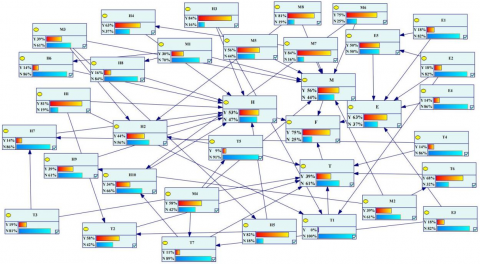
Reverse inference in BN model nodes involves calculating the posterior probabilities of other node variables when the target node of the network model is known. By constructing a BN model and performing reverse inference on variables, the posterior probabilities of other node variables can be accurately determined, allowing for a more precise assessment and prediction of accident situations. Based on the constructed BN model, setting the root node "Wind Power Engineering Construction Accident (F)" as the evidence node, the posterior probability distributions of other nodes related to preventing accidents are derived. By analyzing and comparing the posterior probability values of various nodes, the most likely causes of wind power engineering construction accidents can be inferred, as shown in Table 7 and Figure 7.
Table 7. Posterior probability values of key node variables
|
Rank |
Node |
Posterior Probability (%) |
|
1 |
M1 |
70 |
|
2 |
E |
63 |
|
3 |
M2 |
61 |
|
4 |
M3 |
61 |
|
5 |
M |
56 |
|
6 |
H2 |
56 |
|
7 |
H |
53 |
|
8 |
E5 |
50 |
|
9 |
M5 |
44 |
|
10 |
T2 |
42 |
From Table 7 and Figure 7, it is known that in the event of a wind power engineering construction accident, the probability of inadequate safety management supervision (M1 value as N) exceeds 70%, environmental factors (E value as Y) exceed 63%; the execution of safety management and organizational systems (M2 value as N) exceeds 61%, safety training, education, and guidance (M3 value as N) exceed 61%, management factors (M value as Y) exceed 56%; the inadequacy of personal protection (H2 value as N) exceeds 56%, human factors (H value as Y) exceed 53%; occurrence of abnormal changes in the workplace environment (E5 value as Y) exceeds 50%; inadequate safety risk level control (M5 value as N) exceeds 44%, and failure of lifting equipment (T2 value as N) is at 42%.
5.4 Node sensitivity analysis and maximum causation chain analysis
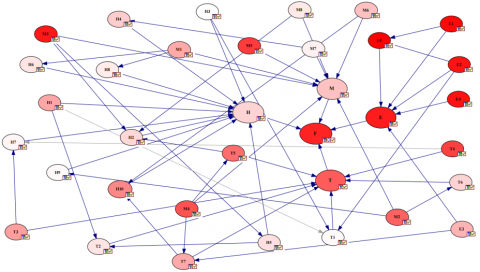
In the BN model, sensitivity analysis can reflect how changes in local parameters of the network model cause quantitative changes in the target node, thereby identifying sensitive factors within the model. The depth of the red color of the nodes is proportional to their sensitivity; the deeper the red, the higher the sensitivity. At the same time, the accident's maximum causation chain is used to find key risk factors, highlighting the risk causation chain, or the most likely key risk pathway leading to an accident, with a bold arrow. Setting node F as the target node, the variable sensitivity and the maximum causation chain analysis were performed, as shown in Figure 8.
From Figure 8, it is evident that the sensitivity levels of network model nodes vary, with nodes such as E1, E2, E4, E5, M3, M4, M5, T4, M2, and T5 showing high sensitivity. Focusing on these factors for prevention and being vigilant against accidents caused by geological reasons, observing road conditions before transporting wind turbine blades, avoiding operations in limited spaces, staying away from charged bodies, maintaining safety protection equipment, strengthening safety training, education, and guidance, addressing accident hazards in advance, paying attention to safety risk level control, and strictly implementing safety and organizational systems can effectively enhance the ability to resist accidents. In Figure 8, the longest causation chain leading to wind power engineering construction accidents includes E3 (Abnormal Weather) → T7 (Failure of the Wind Turbine and Its Auxiliary Equipment) → H10 (Sensitivity to Equipment Changes) → H (Human Factors) → F (Wind Power Engineering Accident) and M3 (Safety Training, Education, and Guidance) → H5 (Personnel Qualification) → T2 (Lifting Equipment) → T (Equipment Factors) → F (Wind Power Engineering Accident). Therefore, control measures should prioritize these key risk factors to reduce the probability of factors occurring in the maximum causation chain. During the construction of wind power projects, changes in weather or the environment should be closely monitored, along with changes in wind turbines and their auxiliary equipment. In the management process, personnel qualifications and safety training, education, and guidance before operations should be strengthened to timely detect safety hazards, enhance the safety construction awareness of operational and management personnel, ensure the safety of personnel and property, and effectively prevent accidents during the construction period of wind power engineering.
Figure 7. Distribution map of reverse inference for nodes in the BN model
Figure 8. Sensitivity analysis and maximum causation chain analysis of variables in the BN model
The study of safety in wind power engineering construction is paramount to ensuring the smooth completion of construction and system safety. To ensure the safety of wind power construction and reduce the rate of accidents during the construction period, this paper, based on the causative factors of accidents during the construction period of wind power engineering, incorporates human unsafe behaviors and unsafe states of objects as basic events into the fault tree structure. By transforming these into a fault tree-Bayesian model and using GeNie for visualization, it reverse diagnoses and analyzes the causes of accidents.
After organizing and investigating the related materials of accidents during the construction period of wind power engineering, and summarizing unsafe actions and states based on the "2-4" Model, causative variables were selected from four aspects: human, equipment, environment, and management. Combining expert opinions and experience to determine the relationships between factors, the reliability and accuracy of the BN model were cross-validated. The accident model was constructed using BN software GeNie, and the EM algorithm was used for parameter training of the Bayesian analysis model to understand the probability distribution between variables. Through reverse inference, sensitivity, and maximum causation chain analysis, significant causative factors impacting wind power engineering construction accidents were identified. Nodes E1 (Geological Issues), E2 (Road Conditions), E4 (Limited Working Space), E5 (Abnormal Changes in Workplace Environment), M3 (Safety Training, Education, and Guidance), M4 (Accident Hazard Investigation), M5 (Safety Risk Level Control), T4 (Distance from Charged Body), M2 (Execution of Safety and Organizational Systems), T5 (Safety Protection Equipment Failure) show strong sensitivity. The longest causation chain identified is E3 (Abnormal Weather) → T7 (Failure of the Wind Turbine and Its Auxiliary Equipment) → H10 (Sensitivity to Equipment Changes) → H (Human Factors) → F (Wind Power Engineering Accident) and M3 (Safety Training, Education, and Guidance) → H5 (Personnel Qualification) → T2 (Lifting Equipment) → T (Equipment Factors) → F (Wind Power Engineering Accident). Preventing accidents during the construction period of wind power engineering, based on the analysis results, is a key and effective method to reduce the occurrence of accidents during the construction period of wind power projects.
In future work, based on the results of the causation analysis of accidents during the construction period of wind power engineering, dynamic BN will be used for risk assessment to build a safety risk assessment system for wind power engineering. This aims to address the issue of insufficient safety risk identification and assessment during the construction period of onshore wind farms.
[1] Liu, J., Song, D., Li, Q., Yang, J., Hu, Y., Fang, F., Hoon Joo, Y. (2023). Life cycle cost modelling and economic analysis of wind power: A state of art review. Energy Conversion and Management, 277: 116628. https://doi.org/10.1016/j.enconman.2022.116628
[2] Lyu, Q., Fu, G., Wang, Y., Li, J., Han, M., Peng, F., Yang, C. (2022). How accident causation theory can facilitate smart safety management: An application of the 24Model. Process Safety and Environmental Protection, 162: 878-890. https://doi.org/10.1016/j.psep.2022.04.068
[3] Zhou, C., Liu, X., Gan, L., Zheng, Y., Zhong, Q., Ge, K., Zhang, L. (2018). Assessment and countermeasures for offshore wind farm risks based on a dynamic Bayesian network. Journal of Environmental Protection, 9(4): 368-384. https://doi.org/10.4236/jep.2018.94024
[4] Zhang, C., Zhao, F., Gao, J. (2022). EPC wind power engineering risk assessment system based on bayesian fault tree. In 2022 IEEE 2nd International Conference on Power, Electronics and Computer Applications (ICPECA), Shenyang, China, pp. 525-531. https://doi.org/10.1109/ICPECA53709.2022.9719048
[5] Adedipe, T., Shafiee, M., Zio, E. (2020). Bayesian network modelling for the wind energy industry: An overview. Reliability Engineering & System Safety, 202: 107053. https://doi.org/10.1016/j.ress.2020.107053
[6] Yu, Q., Liu, K., Chang, C.H., Yang, Z. (2020). Realising advanced risk assessment of vessel traffic flows near offshore wind farms. Reliability Engineering & System Safety, 203: 107086. https://doi.org/10.1016/j.ress.2020.107086
[7] Franca, J., Hollnagel, E. (2023). From unsafe acts to system resilience—How emerging technologies in the O&G industry reach new safety frontiers. Human Interaction and Emerging Technologies (IHIET 2023), 111: 735-742. https://doi.org/10.54941/ahfe1004080
[8] Rasmussen, J. (1997). Risk management in a dynamic society: A modelling problem. Safety Science, 27(2-3): 183-213. https://doi.org/10.1016/S0925-7535(97)00052-0
[9] Levenson, N. (2011). Engineering a Safer World: Systems Thinking Applied to Safety. Cambridge: Mit Press. https://doi.org/10.7551/mitpress/8179.001.0001
[10] An, Y., Wang, H., Yang, X., Zhang, J., Tong, R. (2023). Using the TPB and 24Model to understand workers’ unintentional and intentional unsafe behaviour: A case study. Safety Science, 163: 106099. https://doi.org/10.1016/j.ssci.2023.106099
[11] Li, J., Qin, Y., Wang, Z., Xin, Y. (2021). How to analyse the injury based on 24Model: A case study of coal mine gas explosion injury. Injury Prevention, 27(6): 542-553. https://doi.org/10.1136/injuryprev-2021-044281
[12] Hao, J., Liu, L., Long, Z., Chu, Y., Zhang, D., Chen, X., Huang, C. (2023). Scenario deduction of Natech accident based on dynamic Bayesian network: A case study of landslide accident in a liquor storage tank area in Guizhou Province, China. Journal of Loss Prevention in the Process Industries, 83: 105067. https://doi.org/10.1016/j.jlp.2023.105067
[13] Li, H., Guedes Soares, C., Huang, H.Z. (2020). Reliability analysis of a floating offshore wind turbine using Bayesian networks. Ocean Engineering, 217: 107827. https://doi.org/10.1016/j.oceaneng.2020.107827
[14] Wang, J., Gao, S., Yu, L., Zhang, D., Xie, C., Chen, K., Kou, L. (2023). Data-driven lightning-related failure risk prediction of overhead contact lines based on Bayesian network with spatiotemporal fragility model. Reliability Engineering & System Safety, 231: 109016. https://doi.org/10.1016/j.ress.2022.109016
[15] Li, M., Wang, H., Wang, D., Shao, Z., He, S. (2020). Risk assessment of gas explosion in coal mines based on fuzzy AHP and Bayesian network. Process Safety and Environmental Protection, 135: 207-218. https://doi.org/10.1016/j.psep.2020.01.003
[16] Yan, Q., Wu, S. (2022). Study on causes of coal mine roof accidents based on Bayesian network. Mining Safety & Environmental Protection, 49(3): 136-142. https://doi.org/10.19835/j.issn.1008-4495.2022.03.023
[17] Yan, Q., Wu, S. (2023). Study on cause of coal and gas outburst accident based on D-S evidence theory and Bayesian network. Safety in Coal Mines, 54(5): 153-160.
[18] Waskito, D.H., Bowo, L.P., Kurnia, S.H.M., Kurniawan, I., Nugroho, S., Irawati, N., Mutharuddin, Mardiana, T.S., Subaryata. (2024). Analysing the impact of human error on the severity of truck accidents through HFACS and Bayesian network models. Safety, 10(1): 8. https://doi.org/10.3390/safety10010008