Muhammad Fathur Rouf Hasan![]() | Meea Yuniar Frastika
| Meea Yuniar Frastika![]() | Putera Agung Maha Agung*
| Putera Agung Maha Agung*![]() | Adi Susilo
| Adi Susilo![]() | Eko Andi Suryo
| Eko Andi Suryo![]() | Yulvi Zaika
| Yulvi Zaika![]() | Alamsyah M. Juwono
| Alamsyah M. Juwono![]() | Siti Zulaikah
| Siti Zulaikah![]()
© 2024 The authors. This article is published by IIETA and is licensed under the CC BY 4.0 license (http://creativecommons.org/licenses/by/4.0/).
OPEN ACCESS
The rock weathering process produces chemical and physical transformations in the rock mass, decreasing the soil's strength and stability. The presence of water in rocks reduces the coefficient of friction and cohesion between mineral particles, changing the mineral composition and microstructure of rocks, resulting in an increase in porosity and a decrease in rock strength, thus accelerating the collapse process. This study aims to determine the effect of the degree of saturation and weathering on the maximum compressive strength, safety factor, and slope failure line. The uniaxial compressive strength (UCS) test uses a compression machine to press the rock specimen until deformation. The UCS value of a rock sample is the stress that occurs in the rock sample when the sample collapses due to compression. This research uses 20 specimens taken from Trunojoyo Street, Payung Area, Batu City, consisting of three types of rock: breccia, clay and lapilli; for every kind of rock, 5 variations of saturation with 0-8 minutes of soaking. The results show the average SF value of specimens 1B, 2L, and 3L is 6,02, 2,55, and 1,81, where SF>1.25; it means that the slope conditions are stable and landslides rarely occur. The average SF value of specimen 2C is 1,14 at intervals of 1.07<x<1.25, meaning that the slope conditions are critical and landslides have occurred. Based on the loading index, the rock strength has a negative relation with the level of weathering. This means that the higher the level of weathering, the stronger the rock will decrease.
2D Plaxis, degree of saturation, rock weathering, safety factor, uniaxial compressive strength
Rock collapse is an event of shifting rock or soil that moves down in the direction of the sloping plane. Rock collapse occurs due to physical and mechanical processes involving deformation and crack propagation in the rock mass [1, 2]. In addition, the rock collapse process is triggered by many factors, such as topography, climate, vegetation, and rock weathering [3]. Rock weathering processes in tropical areas such as Batu City will occur faster due to changes in vegetation conditions, climate, and high rainfall [4]. One of the factors that affect the weathering condition of rocks is the saturation or condition of the water contained in the rocks. The presence of water in rocks reduces the coefficient of friction and cohesion between mineral particles [5]; these conditions change the mineral composition and microstructure of rocks, resulting in an increase in porosity [6, 7] and a decrease in rock strength, accelerating the collapse process. The most common example of rock failure is landslides. Landslides are defined as the movement of slope-forming material in the form of rock, soil or mixed materials. The movement of material begins with the infiltration of water into the soil layer, thereby increasing the weight of the soil [8]. When water enters into an impermeable layer, this layer will function as a sliding zone, so that the soil becomes slippery and the weathered soil above it will move along the slope.
Several researchers have concluded that water content significantly impacts changes in the structure and characteristics of rocks [9], so the strength of various rocks due to saturation can be reduced by up to 90%. Rock strength increases when saturation is low and decreases significantly when saturation is high [10]. Zhou et al. [11] observed the uneven water distribution on the soaked cylindrical sandstone specimens; the rock strength is greatly reduced even when the water content is less than 3.51%. Zheng et al. [9] researched saturated and unsaturated limestone, which were comparatively investigated through compressive strength test results. The average compressive strength of the saturated limestone was reduced by 24.3% compared to the unsaturated limestone. In addition, the water content reduced the brittleness index of unsaturated limestone by 17.1%. These statistics demonstrate that water and geology are the most important factors influencing rock slope stability [12]. Water is one of the most important environmental factors affecting fractured rocks' deformation and failure behaviour in civil engineering, such as slopes, tunnels, and mining [13, 14].
The analysis of rock collapse in this study was carried out on weathered rock because weathered rock is a weak rock that occurs due to the process of changing rock characteristics into soil [15]. Weathered rock significantly reduces the mechanical properties of the original rock [16], decreasing the strength and stability of the slope [17] that caused the rock collapse. Rock collapse is a classic problem in road design for geotechnical engineers [18]; for example, the Malang-Kediri provincial road has a high potential for landslides because the topography of the area consists of highlands and hills with a land slope of >40°, this condition is included in the medium-high steepness category. So far, few researchers have studied the shape and position of erosion sliding surfaces due to sedimentary rock collapse based on the degree of weathering. Therefore, this has attracted the attention of many researchers to reduce the risk of rock collapse, especially regarding the physical aspects of the Payung Area on Trunojoyo Street, Batu City.
Different types of slope failure are associated with different geological structures and the slope designer must be able to recognize potential stability problems during the early stages of a project. The main types of collapse on rock slopes, according to Hoek and Bray in 1981, there, are 4 which are influenced by structural geological conditions: (a) plane failure in rock containing persistent joints dipping out of the slope face, and striking parallel to the face; (b) wedge failure on two intersecting discontinuities; (c) toppling failure in strong rock containing discontinuities dipping steeply into the face; and (d) circular failure in rock fill (Figure 1), very weak rock or closely fractured rock with randomly oriented discontinuities [12, 19].
Figure 1. Main types of block failures in slopes and structural geology conditions likely to cause these failures: (a) plane failure; (b) wedge failure; (c) toppling failure; and (d) circular failure [12]
The principle of soil or rock collapse is influenced by gravity, driving and resisting forces. Generally, the retaining force is influenced by the rock's strength and the soil's density. Meanwhile, the driving force is influenced by the slope angle, water in the soil, the load, and the specific gravity of the rock. Therefore, the Uniaxial Compressive Strength (UCS) test is the most appropriate for analysing rock failure. This method is commonly used to analyse determining parameters for rock mechanics engineering purposes because it can represent the strength of the rock against pressure, which describes the value of the condition of the rock in withstanding the force applied before the rock is destroyed. The UCS test is used on rocks in saturated and unsaturated conditions. Based on the geological map of the Batu City, Kediri and Malang Quadrangles, the weathered rock types often found in this area are breccia, claystone, lapilli, and tuff. So, we used this type of rock as our research sample because, based on the history of landslides at that location, landslide runoff was dominated by this type of rock. The condition of the rocks in each area is always different even though the rock type is the same; because the geological structure and formation process are certainly different, testing needs to be carried out in each area.
Different rock types have different levels of strength and water absorption depending on the texture and lithology of the rock. This research not only improves the understanding of the effect of water on the compressive strength of breccia, claystone, and lapilli rocks but also its effect on the fracturing process. Previous research shows more than one definition of the wetting process, although the rationale behind the various definitions is the same. The differences are generally related to the procedures for obtaining dry mass, wet mass, and duration of water saturation. Although several experts have investigated several water-weakening mechanisms, no universally proven mechanism addresses the effect of water on rock strength due to the variety of rock types on the earth's surface [10, 19]. Rock saturation levels change rapidly during the transition from the dry to the rainy season. During the dry season, the soil is fractured due to a decrease in water content in the soil. When entering the rainy season, the previously dry soil suddenly gets excess water that fills the fractures. Sudden changes in soil reaction can affect rock collapse and result in landslides. This can be seen from the many landslides that occur at the beginning of the rainy season. Therefore, water is an essential factor that must be considered in a rock slope's stability analysis. Due to the existence of joints and fractures in the rock mass, the weakening effect of rock mass when saturated can be more significant [12].
Several experimental studies have revealed that the decrease in strength and modulus of rocks depends on the water content and other internal and external factors [20]. Internal factors include the rock's porosity, density, and geological structure [21]. The main external factors include strain rate, surface tension, and water absorption percentage [22]. Therefore, this test is modeled with several variations of the degree of saturation to describe the distribution of water in the rock specimen and investigate the mechanical behaviour of rocks with different air contents, as well as determine the relation between the two [10], so the UCS results are needed to determine the strength of the rock according to the specified conditions [23]. Rocks are said to be water-saturated when the pores in the rock no longer contain air at all or the pores are completely filled with water. This theory can be seen through the fact that the soil conditions below the water table, such as reservoirs, are generally in a water-saturated state so that the water in the reservoir never runs out.
This study aims to determine the effect of the degree of saturation and weathering on the maximum compressive strength, safety factor, and slope failure line. The test results can be used as evaluation material for the local government regarding the possible influence of water absorption, physical, and mechanical properties of breccia, claystone, and lapilli rocks due to the influence of the degree of saturation that can cause degradation of rock strength and durability. The study results were modeled with rock slopes using Plaxis 2D software, which is expected to provide new insights into understanding the effects of weakening rock strength by the presence of water [10]. So, this research can be used as a reference or parameter in geotechnical engineering work, such as retaining wall structural design planning, drainage planning and soil stabilization. Several other geotechnical management plans also need to be considered to choose the most efficient plan to minimize the intensity of landslide events.
2.1 Sample location
Geographically, Batu City has a total area of 202.30 Km2. The city area is located at an altitude of 700-1800 m above sea level and surrounded by 3 mountains, namely Mount Panderman (2045 m), Mount Arjuna (3339 m), and Mount Welirang (3156 m). The average rainfall in this area ranges from 1749.15-2238.73mm/year, with air humidity around 75-98% [24]. The lithological structure of the area is dominated by sedimentary rocks in the form of volcanic breccias, lapilli, claystone, and tuff. The research location is Trunojoyo Street, Payung Area, Batu City. The rocks sampled for UCS testing, both in saturated and unsaturated conditions, were taken from three different locations [6]. The three locations are one of the areas with the highest landslide rate in Batu City (Figure 2) due to land use change, vegetation change, high slope steepness, and high rain intensity [25], so the physical properties of soil and rocks at the research location are predicted to have a high degree of saturation and weathering of the bedrock, this is one of the factors that cause rock collapse or landslides in the area.
Figure 2. Study area design
2.2 UCS test and specimen
Compressive strength is defined as the ability of rocks to accept loads until they experience deformation when pressure is applied. The UCS test uses a compression machine to press the rock specimen, which in this study is in the shape of a cube from one direction (uniaxial), and the loading follows the standard from the International Society of Rock Mechanics (ISRM) [26]. When a rock specimen receives a regularly increasing load, its condition will tend to change shape. This shape change will occur in the lateral (∆d) and axial (∆I) directions so the rock specimen directly experiences a volumetric shape change. The Uniaxial Compressive Strength value of a rock sample is the stress that occurs in the rock sample when the sample experiences failure due to loading; the value can be obtained from the equation:
${{\sigma }_{c}}=~\frac{F}{A}$ (1)
where,
${{\sigma }_{c}}$=Uniaxial compressive strength of the rock (MPa)
F =Axial force when a rock sample is crushed (kN)
A=The initial surface area of a rock sample perpendicular to the direction of force (m2)
Specimens were taken from the slope's surface on Trunojoyo Street, Batu City with the slope height under review as high as 6m in the vertical direction with an average slope of 60-80°. The height of the position of the rock samples taken is at a height of 1-2 m to be easily accessible with simple tools. Rock samples consist of breccia, claystone, and lapilli rock types taken based on the mapping of 3 locations. Samples taken at point 1 are in the form of breccia, at point 2 claystone and lapilli rock, while at point 3 lapilli rock.
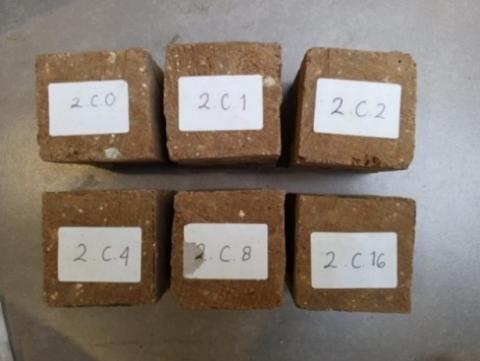
The samples were formed into cube specimens with dimensions of 5×5×5 cm (Figure 3), where each type of rock made 5 saturation variations with soaking times of 0, 1, 2, 4, and 8 minutes, especially for breccia at point 1 (1B) the length of soaking time was multiplied by 10 from the normal time. So, a total of 20 specimens were tested with the aim of comparing the results of testing rock specimens in variations of saturated and unsaturated conditions. The reason for choosing the soaking time is because the sample is rock, which is easily destroyed if soaked in water, so this research chose the time in a matter of minutes. If the sample is soaked for more than one hour, it is possible that the sample will be destroyed before the testing process or even when taking the sample from the soaking place. Generally, soaking samples for Uniaxial tests take up to several hours; this applies to concrete samples because they have a high density.
(a) Breccia rock (1B)
(b) Claystone (2C)
(c) Lapilli rock (2L)
(d) Lapilli rock (3L)
Figure 3. Uniaxial test samples
The test results obtained several parameters, such as compressive strength (${{\sigma }_{c}}$) saturated and unsaturated weight. These parameters were analyzed into the Hoek-Brown (2002) rock collapse criteria to find the correlation of the Mohr-Coulomb soil collapse criteria parameters to the cohesion value (c) and the inner shear angle value (ϕ) [27]. The parameter values that have been analyzed are used as input data for slope modeling using Plaxis 2D.
2.3 Safety factor modelling
The results of the previous compressive strength test analysis were used to determine the safety factor value using Plaxis 2D V8.2. The method developed by Plaxis 2D is through the Finite Element Method principle approach. This principle is a way to solve a problem in the geotechnical field by dividing the object of analysis into infinitely small parts for slope modeling and analysis of deformation and slope stability [28] in geotechnical engineering and rock mechanics to approach actual conditions.
The analysis using Plaxis 2D software takes the rock parameters as input values so that the safety factor, landslide potential or stability of soil and rock masses on the slope can be estimated. All rock parameter analysis data are generated from the correlation of the Hoek-Brown and Mohr-Coulomb equation approaches [29]. The mechanism of rock collapse and slope stability is analyzed based on the Strength Reduction Method [30]; This method reduces the value of rock shear strength in the form of cohesion value (c) and inner shear angle value (ϕ) gradually until collapse occurs. The equation used to find the SF value is shown in the equation below.
$\sum MSF=\frac{c}{{{c}_{reduced}}}=ta{{n}^{-1}}\left( \frac{tan~\phi }{{{\phi }_{reduced}}} \right)$ (2)
where,
∑MSF = Safety Factor
$c$ = Cohesion (kN/m2)
${{c}_{reduced}}$= Reduced Cohesion (kN/m2)
$\phi$= Inner Shear Angle (°)
${{\phi }_{reduced}}$= Reduced Inner Shear Angle (°)
3.1 Uniaxial compressive strength (UCS) analysis
The uniaxial compressive strength values reviewed in this study are based on the condition of the degree of rock weathering and variations in specimen soaking time or saturation level. The degree of rock weathering is obtained from visual observations of the rock's physical condition, which is determined based on the International Society of Rock Mechanics (ISRM) [26]. Breccia rock specimens at point 1 (1B), lapilli rock at point 2 (2L), and lapilli rock at point 3 (3L) are classified as rocks with a moderate degree of weathering. Meanwhile, the claystone rock specimen (2C) at point 2 is classified as highly weathered. Based on the results of rock classification, it is concluded that rocks taken as test samples from the same formation can have different strengths due to their heterogeneous nature. Based on the research location's condition, rock weathering is caused by physical and biological weathering processes. The characterization of weathering is analyzed from the physical condition of the rock in the form of colour changes due to the influence of weather, climate, and the activity of organisms around the rock.
The classification of rock mass conditions can also be determined based on the Rock Mass Rating (RMR) method, which was developed into the Geological Strength Index (GSI) [31]. The GSI value can be used to determine the rock mass's cohesion value, inner shear angle, and compressive strength. These values are obtained by giving weights according to the observed rock condition parameters [32]. Based on the calculation of the weight of breccia rock mass, claystone, and lapilli it is shown in Table 1 below:
Table 1. GSI value and rock classification [31]
|
Specimen |
GSI |
Class Number |
|
1B |
55 |
III/Fair Rock |
|
2C |
35 |
IV/Bad Rock |
|
2L |
50 |
III/Fair Rock |
|
3L |
48 |
III/Fair Rock |
Based on the GSI value, the classification of breccia rock mass at point 1 (1B), lapilli at point 2 (2L), and lapilli at point 3 (3L) are included in class III, namely the condition of the rock mass in the moderate category. While the claystone at point 2 (2C) is included in class IV, which is a bad category of rock condition. Based on the classification of rock mass and degree of weathering, it can be predicted that the highest compressive strength value belongs to the breccia rock type at point 1 (1B), and the lowest compressive strength value belongs to the claystone type at point 2 (2C).
Figure 4 shows the shape of the rock specimen after the uniaxial compressive strength testing process. The strength of rock, which is influenced by variations in saturation, has results that are comparable to the results of its compressive strength. The smaller the rock strength, the more fractures the rock specimen produces; this is because many discontinuity areas cut the rock mass, which causes collapse. Apart from that, the denser the discontinuities, the easier it is for water to enter and weather the rock.
Figure 4. The sample after the UCS test
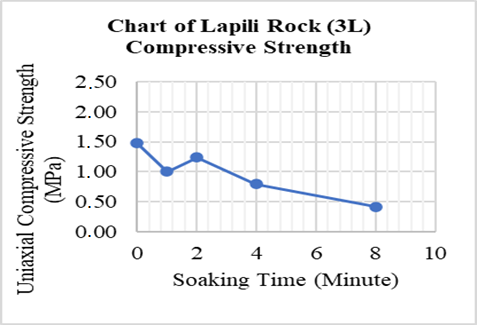
The uniaxial compressive strength test results of the rock specimens showed that the compressive strength of the breccia rock (1B) decreased by 26.7; 1.3; 2.2; and 38.8% after being soaked in water for 10, 20, 40, and 80 minutes. The compressive strength of claystone (2C) decreased by 27.3; 22.2; 46.1; and 46.7% after being soaked in water for 1, 2, 4, and 8 minutes. The test results of the compressive strength of lapilli rock at point 2 (2L) decreased by 48.5, 11.2, 1.1, and 46.6% after being soaked in water for 1, 2, 4, and 8 minutes. While the compressive strength of lapilli rock at point 3 (3L) decreased by 40.0, 16.0, 46.3, and 71.5% after being soaked in water for 1, 2, 4, and 8 minutes. All results of the decrease in compressive strength are obtained by comparing each soaking variation's compressive strength with the rock's compressive strength in its original condition or no soaking.
(a) Breccia rock (1B)
(b) Claystone (2C)
(c) Lapilli rock (2L)
(d) Lapilli rock (3L)
Figure 5. Uniaxial compressive strength and soaking time relation
Figure 5 shows that the uniaxial compressive strength values of all specimens at three different location points experience almost the same fluctuations, namely a decrease in the first-minute immersion condition and gradually increases in the 2nd-minute immersion, then drops back in the 4th-minute soaking. Rocks have properties that allow them to adjust or adapt to new conditions so that they can interfere with the rock mechanics process. When specimens with original conditions were tested for compressive strength, the test results showed normal compressive strength values. Then, when the specimens with a soaking time of 1 minute were tested for compressive strength, the compressive strength results decreased. This is because the entry of water into the pores in a short time makes the rock specimen react to new conditions quickly, eventually causing the pores to expand. This condition causes the porosity number to increase and makes the compressive strength value decrease. The results of testing the rock specimens of the 2nd immersion variation showed that the compressive strength relatively increased because the rock began to adapt to the previous conditions by strengthening the binding force between grains. The 4-minute immersion variation specimens began to enter the saturation period; the increasing water content in the rock caused the porosity rate to rise again and caused the compressive strength to decrease gradually.
Rocks have different porosities even though they are of the same rock type. Porosity occurs due to the presence of cavities in the rock; the more cavities are formed, the more rock has many weak planes [18]. This is because the number of cavities illustrates the ease with which rocks can absorb water. The higher the porosity value, the higher the water content in the rock [23], so the rock's strength will decrease. This is shown in the results of research by Liu et al. [33]; namely, the relation between UCS and absorption shows a decrease in compressive strength value when there is an increase in the absorption value of the rock.
The porosity value significantly influences rocks' uniaxial compressive strength values due to the reaction between rock mineral grains [9]. The strength of the rock binding force affects the compactness between rock grains; if the binding force is strong, it produces a hard rock with a high uniaxial compressive strength value, and vice versa, if the binding force between the grains is weak, it produces a rock that is less compact and forms many pores filled with water or air, so that the uniaxial compressive strength value is low.
The results of the compressive strength analysis can also be caused by the fact that previous research has shown that changes in rock saturation levels occur rapidly during the transition from the dry season to the rainy season. During the dry season, the soil experiences fractures due to decreased water content in the soil. When entering the rainy season, the previously dry soil suddenly gets excess water that fills the fractures. Sudden changes in soil reaction can affect rock collapse and result in landslides. This can be seen from the many landslides that occur at the beginning of the rainy season.
3.2 Slope stability analysis
Rock slope stability analysis was conducted using Plaxis 2D. The results of the Hoek-Brown parameter correlation analysis that have been obtained produce a slide plane scheme in Mohr-Coulomb modeling shown in Figure 6. Based on the slope modeling image, it can be seen that the depth and shape of the slide plane between rocks have different collapses according to the magnitude of the results of the analysis of the rock condition parameters.
The results of the SF value analysis, when sorted from the largest SF value to the smallest based on all saturation variations, are specimens 1B, 2L, 3L, and 2C. Based on the classification of slope conditions and the intensity value of the collapse or landslide, according to Bowles in 1991, the SF value of specimens 1B, 2L, and 3L>1.25 describes the slope in a very stable condition and landslides rarely occur. While the SF value of specimen 2C slopes in a stable condition or SF>1.25 is only owned by rock slope modeling in the original condition or without soaking so that it is predicted that landslides rarely occur, while in specimens with immersion variations of 1, 2, 4, and 8 minutes SF values include intervals of 1.07<x<1.25 so that it describes slopes in critical conditions and landslides have occurred.
Figure 6. Distribution of slipping planes in MC modelling against variations in soaking time
The results of slope modeling can be concluded that the SF value is fluctuating and linear with the results of the classification of rock conditions obtained from weighting the GSI value of each specimen, and the SF value is also linear with the graph of the uniaxial compressive strength value. It can be concluded that the condition of the degree of rock weathering greatly affects the results of the compressive strength and SF values. The better the rock condition, the greater the compressive strength and SF value of the slope, and vice versa; the worse the rock condition, the smaller the compressive strength and SF value of the slope.
The results of the parameter analysis of compressive strength, cohesion, and inner shear angle values in the slope modeling shown in Figure 6 using Plaxis 2D obtained the distribution of landslide planes for rock material slopes presented with different colours. The blue colour in the modeling illustrates the slope's safe condition, and the more critical the slope is, the redder the colour will be. The greater the SF value, the smaller the area of critical slope conditions and the lower the risk of slope collapse, and vice versa, the smaller the SF value, the wider the critical slope conditions and the higher the risk of slope collapse. Based on the parameters and slope modeling obtained from the kinematic analysis of rock collapse types according to Hoek and Bray in 1981, we evaluated the potential kinematic feasibility involving planar, wedge, and toppling failure based on the above parameters [13, 34]. The analysis results suggest that all rock slopes 1B, 2C, 2L, and 3L have a potential kinematic feature of wedge failure rather than planar and toppling failure.
Figure 7. Normal distribution of PDF of UCS for all rocks
Figure 8. Empirical vertical ACF at failure and no-failure sections on all specimens
The probability distribution of the weathered and saturated rock for all sections could be found to be normally distributed [35]. The probability distribution function (PDF) of failure and no-failure conditions for weathered and saturation are plotted together in Figure 7. Typical empirical vertical direction autocorrelation function (ACF) values plotted with lag distance for all specimens are given in Figure 8.
Based on Figure 8, the following observations can be made:
(1) The mean uniaxial compression strength (UCS) value in Mpa is slightly lower for the failed section.
(2) The uniaxial compression strength (UCS) standard deviation is lower for the failed section.
The results suggest that the actual pattern of slope failures may not be explained solely based on the mean of uniaxial compression strength (UCS). Thus, a purely deterministic stability analysis is bound to yield results opposite to what occurred in the slope.
Based on the testing and analysis conducted in this research on breccia, clay, and lapilli rock types at three points of the research location, it is concluded that the degree of saturation and weathering of rocks greatly affects the maximum compressive strength and SF value of rocks. Changes in the mechanical properties of rocks between saturated and unsaturated are related to rock composition and water absorption methods. Water content and porosity have a positive relation with the degree of weathering; this means that the higher the level of weathering, the greater the rock porosity value. Meanwhile, rock strength based on the point load index has a negative relation with the weathering level; this means that the higher the weathering level, the stronger the rock will decrease [4]. The classification of the condition of the breccia rock mass at point 1 (1B), lapilli at point 2 (2L), and lapilli at point 3 (3L) is included in class III, namely the condition of the rock mass in the medium. Clay rock at point 2 (2C) is included in class IV, which is in bad condition. The results of the uniaxial compressive strength analysis based on variations in the degree of saturation obtained average compressive strength values from highest to lowest, respectively, namely specimens 1B, 2L, 3L, and 2C with compressive strength values of 17.96MPa, 2.95MPa, 1.62MPa, 1.49MPa. Based on the input data parameters of compressive strength analysis results, the average SF value of specimens 1B, 2L, and 3L is 6,02, 2,55, and 1,81, eq SF>1.25 means that the slope conditions are stable and landslides rarely occur. While the average SF value of specimen 2C is 1,14 at intervals of 1.07<x<1.25, meaning that the slope conditions are critical and landslides have occurred. The type of collapse that occurs in all slope modeling based on the parameters obtained is the wedge collapse. The higher probability of failure at the failure section during the lowest groundwater surface elevation level was confirmed. The locations of critical failure surfaces in the slope stability analysis may form a banded zone bounded by the slip surface with the lowest safety factor and the other slip surface with the maximum probability of failure.
The author would like to thank P3M Politeknik Negeri Jakarta for funding this research through the 2023 PIT Grant Number: 541/PL3.18/PT.00.06/2023. The author would also like to thank the Brawijaya University structural laboratory for the sample testing facilities.
|
1B |
Symbol of breccia test specimen point 1 |
|
|
2C |
Symbol of claystone test specimen point 2 |
|
|
2L |
Symbol of lapilli test specimen point 2 |
|
|
3L |
Symbol of lapilli test specimen point 3 |
|
|
ISRM |
International society of rock mechanics |
|
|
GSI |
Geological strength index |
|
|
RMR |
Rock mass rating |
|
|
SF |
Safety factor |
|
|
UCS |
Uniaxial compressive strength |
|
|
Greek symbols |
||
|
${{\sigma }_{c}}$ |
Uniaxial compressive strength of rock (MPa) |
|
|
F |
Axial force at the time of rock sample crushing (kN) |
|
|
A |
Initial surface area of the rock sample perpendicular to the direction of the force (m2) |
|
|
∑MSF |
Safety factor values |
|
|
$c$ |
Cohesion (kN/m2) |
|
|
${{c}_{Reduced}}$ |
Reduced cohesion (kN/m2) |
|
|
$\phi $ |
Inner shear angle (°) |
|
|
${{\phi }_{Reduced}}$ |
Reduced inner shear angle (°) |
|
[1] Yang, Y., Xu, D., Liu, F., Zheng, H. (2020). Modeling the entire progressive failure process of rock slopes using a strength-based criterion. Computers and Geotechnics, 126: 103726. https://doi.org/10.1016/j.compgeo.2020.103726
[2] Li, B., Bao, R., Wang, Y., Liu, R., Zhao, C. (2021). Permeability evolution of two-dimensional fracture networks during shear under constant normal stiffness boundary conditions. Rock Mechanics and Rock Engineering, 54: 409-428. https://doi.org/10.1007/s00603-020-02273-2
[3] Bachri, S., Shrestha, R.P., Yulianto, F., Sumarmi, S., Utomo, K.S.B., Aldianto, Y.E. (2020). Mapping landform and landslide susceptibility using remote sensing, GIS and field observation in the southern cross road, Malang regency, East Java, Indonesia. Geosciences, 11(1): 4. https://doi.org/10.3390/geosciences11010004
[4] Firdaus, A.N., Indrawan, I., Warmada, I.W. (2021). Characteristic of rock masses and the influence of weathering on engineering properties of andesite breccia. In AIP Conference Proceedings. AIP Publishing, 2363(1). https://doi.org/10.1063/5.0061094
[5] Yang, Y.Y. (2020). Grey relational analysis on influencing factors of highway slope safety in Ankang mountain area. International Journal of Safety and Security Engineering, 10(5): 721-726. https://doi.org/10.18280/ijsse.100518
[6] Jia, C., Xu, W., Wang, H., Zhang, Q. (2021). Experimental investigation of the mechanical and permeability characteristics of volcanic breccia. Bulletin of Engineering Geology and the Environment, 80: 599-610. https://doi.org/10.1007/s10064-020-01949-x
[7] Li, H., Zhong, Z., Liu, X., Sheng, Y., Yang, D. (2018). Micro-damage evolution and macro-mechanical property degradation of limestone due to chemical effects. International Journal of Rock Mechanics and Mining Sciences, 110: 257-265. https://doi.org/10.1016/j.ijrmms.2018.07.011
[8] Hasan, M.F.R., Salimah, A., Susilo, A., Rahmat, A., Nurtanto, M., Martina, N. (2022). Identification of landslide area using geoelectrical resistivity method as disaster mitigation strategy. International Journal on Advanced Science, Engineering and Information Technology, 12(4): 1484-1490. https://doi.org/10.18517/ijaseit.12.4.14694
[9] Zheng, L.J., Xie, H.P., Xu, Z.X., Deng, J.H., Wang, D., Zhang, G.Z., Li, C.B., Zhang, R., Feng, G. (2022). A comparison of mechanical properties and failure processes of saturated and unsaturated slate from Sichuan-Tibet Plateau Area, China. Lithosphere, 2021(Special 4): 4503366. https://doi.org/10.2113/2022/4503366
[10] Li, D., Wang, W. (2019). Quantitative analysis of the influence of saturation on rock strength reduction considering the distribution of water. Geomechanics and Geophysics for Geo-Energy and Geo-Resources, 5(2): 197-207. https://doi.org/10.1007/s40948-019-00106-3
[11] Zhou, Z., Cai, X., Cao, W., Li, X., Xiong, C. (2016). Influence of water content on mechanical properties of rock in both saturation and drying processes. Rock Mechanics and Rock Engineering, 49(8): 3009-3025. https://doi.org/10.1007/s00603-016-0987-z
[12] Wyllie, D.C., Mah, C. (2004). Rock Slope Engineering (Civil and Mining) (4th Edition). London: Spon Press.
[13] Li, B., Ye, X., Dou, Z., Zhao, Z., Li, Y., Yang, Q. (2020). Shear strength of rock fractures under dry, surface wet and saturated conditions. Rock Mechanics and Rock Engineering, 53(6): 2605-2622. https://doi.org/10.1007/s00603-020-02061-y
[14] Pan, Y., Wu, G., Zhao, Z., He, L. (2020). Analysis of rock slope stability under rainfall conditions considering the water-induced weakening of rock. Computers and Geotechnics, 128: 103806. https://doi.org/10.1016/j.compgeo.2020.103806
[15] Waluyo, G., Permanajati, I., Laksono, F.X. (2023). Chemical index alteration of weathering on pyroclastic breccia in the Pawinihan mountain avalanche, Banjarnegara, Central Java, Indonesia. In AIP Conference Proceedings. AIP Publishing, 2482(1). https://doi.org/10.1063/5.0120777
[16] Ietto, F., Perri, F., Cella, F. (2018). Weathering characterization for landslides modeling in granitoid rock masses of the Capo Vaticano promontory (Calabria, Italy). Landslides, 15: 43-62. https://doi.org/10.1007/s10346-017-0860-5
[17] Permanajati, I., Candra, A., Zaenurrohman, J.A. (2023). The impact of clay mineral in the zone of weathering which trigger landslide in Pawinihan Mountain, Sijeruk, Banjarnegara, Central Java, Indonesia. In AIP Conference Proceedings. AIP Publishing, 2482(1). https://doi.org/10.1063/5.0111341
[18] Ceryan, N., Samui, P. (2020). Application of soft computing methods in predicting uniaxial compressive strength of the volcanic rocks with different weathering degree. Arabian Journal of Geosciences, 13: 288. https://doi.org/10.1007/s12517-020-5273-4
[19] Hoek, E., Bray, J.D. (1981). Rock Slope Engineering (Revised Third Edition). United Kingdom: Taylor & Francis.
[20] Higuchi, K., Chigira, M., Lee, D.H., Wu, J.H. (2020). Pore-water chemistry and its influence on rock mechanical properties and hydrogeophysical processes in a mudstone slope in the southwestern Taiwan badlands. Catena, 190: 104533. https://doi.org/10.1016/j.catena.2020.104533
[21] Cai, X., Zhou, Z., Liu, K., Du, X., Zang, H. (2019). Water-weakening effects on the mechanical behavior of different rock types: Phenomena and mechanisms. Applied Sciences, 9(20): 4450. https://doi.org/10.3390/app9204450
[22] Wong, L.N.Y., Maruvanchery, V., Liu, G. (2016). Water effects on rock strength and stiffness degradation. Acta Geotechnica, 11: 713-737. https://doi.org/10.1007/s11440-015-0407-7
[23] Ranaweera, N., Togashi, Y., Osada, M., Kawanoue, R. (2023). Numerical approach to evaluate the influence of water saturation on the strength of Neogene Tuff in Utsunomiya city, Japan. IOP Conference Series: Earth and Environmental Science, 1124: 012121. https://doi.org/10.1088/1755-1315/1124/1/012121
[24] Regional Disaster Management Agency (BPBD) Batu City. (2022). Rainfall Map Intensity Map 2022 in Batu City. Batu City: Regional Disaster Management Agency.
[25] Agung, P.A.M., Hasan, M.F.R., Susilo, A., Ahmad, M.A., Ahmad, M.J.B., Abdurrahman, U.A., Sudjianto, A.T., Suryo, E.A. (2023). Compilation of parameter control for mapping the potential landslide areas. Civil Engineering Journal, 9(4): 974-989. https://doi.org/10.28991/CEJ-2023-09-04-016
[26] Brown, E.T. (1981). Rock Characterization, Testing & Monitoring: ISRM Suggested Methods. Oxford: International Society for Rock Mechanics by Pergamon Press.
[27] Zhang, F.P., Li, D.Q., Cao, Z.J., Xiao, T., Zhao, J. (2018). Revisiting statistical correlation between Mohr-Coulomb shear strength parameters of Hoek-Brown rock masses. Tunnelling and Underground Space Technology, 77: 36-44. https://doi.org/10.1016/j.tust.2018.03.018
[28] Luo, J., Mi, D., Huang, H., Zhang, T., Sun, G., Chen, D. (2020). Intelligent monitoring, stability evaluation, and landslide treatment of a carbonaceous mudstone and shale slope in Guangxi, China. International Journal of Safety and Security Engineering, 10(3): 373-379. https://doi.org/10.18280/ijsse.100309
[29] Khalkhali, A.B., Koochaksaraei, M.K. (2019). Computational engineering and physical modeling evaluation of limit equilibrium and finite element methods in slope stability analysis-Case study of Zaremroud landslide, Iran. Computational Engineering and Physical Modeling, 2(3): 1-15. https://doi.org/10.22115/cepm.2019.206590.1072
[30] Shiferaw, H.M. (2021). Study on the influence of slope height and angle on the factor of safety and shape of failure of slopes based on strength reduction method of analysis. Beni-Suef University Journal of Basic and Applied Sciences, 10: 31. https://doi.org/10.1186/s43088-021-00115-w
[31] Marinos, P.G., Marinos, V., Hoek, E. (2007). The geological strength index (GSI): A characterization tool for assessing engineering properties for rock masses. Proceedings of the International Workshop on Rock Mass Classification in Underground Mining, 87-94.
[32] Xiaohu, H., Changming, W., Tianzuo, W., Zhiming, Z. (2015). Quantification of geological strength index based on discontinuity volume density of rock masses. International Journal of Heat and Technology, 33(4): 255-261. https://doi.org/10.18280/ijht.330434
[33] Liu, D., Wang, Z., Zhang, X., Wang, Y., Zhang, X., Li, D. (2018). Experimental investigation on the mechanical and acoustic emission characteristics of shale softened by water absorption. Journal of Natural Gas Science and Engineering, 50: 301-308. https://doi.org/10.1016/j.jngse.2017.11.020
[34] He, K., Li, Y., Ma, G., Hu, X., Liu, B., Ma, Z., Xu, Z. (2021). Failure mode analysis of post-seismic rockfall in shattered mountains exemplified by detailed investigation and numerical modelling. Landslides, 18: 425-446. https://doi.org/10.1007/s10346-020-01532-1
[35] Li, K.S., Lo, S.C. (Eds. ). (1993). Probabilistic methods in geotechnical engineering. In Proceedings of the Conference on Probabilistic Methods in Geotechnical Engineering.