Abdi Sukmono*![]() | Firman Hadi
| Firman Hadi![]() | Eko Widayanti
| Eko Widayanti![]() | Arief Laila Nugraha
| Arief Laila Nugraha![]() | Nurhadi Bashit
| Nurhadi Bashit![]()
© 2023 IIETA. This article is published by IIETA and is licensed under the CC BY 4.0 license (http://creativecommons.org/licenses/by/4.0/).
OPEN ACCESS
Forest and land fires are global disasters that pose a serious threat to society, particularly during the dry season. Sumatra Island, located in Indonesia, is one of the areas prone to forest and land fires. It causes thick smoke every year which has implications for health and flight activities. It also threatens the 18,931 endemic plant species on the Sumatra Island so this needs to be monitored continuously for mitigation and recovery. This study aims to identify areas of past forest and land fires to support it. In this study, burnt areas were identified by utilizing Normalized Burn Ration (NBR) index on Sentinel-2 Satellite imagery using thresholding method. It is calculated as the ratio between the near-infrared (NIR) and short-wave infrared (SWIR) wavelengths. Both are very sensitive to vegetation and bare land so NBR is very potential for identification of burnt areas using multitemporal techniques. The results of this study indicated that the highest accuracy was achieved using the µ-2σ threshold model of dNBR, with the highest accuracy rate of 81.56% for the February 2019 fires. The results of this study suggest that the thresholding method using the NBR index can be utilized to identify burnt areas effectively.
burnt area, forest fire, land fire, NBR index, Sentinel-2, thresholding
Indonesia is the largest tropical rainforest in Asia and the third-largest in the world. According to Indonesia’s Ministry of Environment and Forestry, the forest area in Indonesia reaches 125.81 million hectares by 2022, which is equivalent to 62.97% of Indonesia’s land area [1]. The forest areas in Indonesia can be classified into various types, such as protected forests for protecting the environmental carrying capacity system (covering an area of 29.56 million hectares), permanent production forests for production timber (covering 29.23 million hectares), conservation areas for national parks, wildlife reserves, nature reserves (covering 27.41 million hectares), limited production forests (covering 26.8 million hectares), and convertible production forests (covering 12.79 million hectares) [1, 2]. However, Indonesia has been experiencing a continuous decrease in forest area over the years. One of the major reasons for forest loss in the country is the occurrence of forest fires. The largest forest fires in Indonesia happened in 1997/1998, which affected around 9.7 million hectares of land across several islands. Kalimantan was hit the hardest with 6.5 million hectares of burnt land, followed by Sumatra with 1.7 million hectares, Irian Jaya with 1 million hectares, Sulawesi with 0.4 million hectares, and Java with 0.1 million hectares [3].
The occurrence of forest and land fires in Indonesia is a frequent disaster, particularly during the dry season in various regions, causing enormous economic, social, and environmental losses and damages [4, 5]. Forest and land fires occurred especially in the Sumatra Island and Kalimantan Island every year. One of potential factor is both of them have peatland soil types. According to study [6-8], the distribution of peatlands affects the level of occurrence of forest fires in Sumatra and Kalimantan. This becomes even stronger when an El Nino occurs in Indonesia, the rate of forest fires in both increases. The smoke resulting from forest and land fires causes severe air pollution that can negatively impact the health of individuals residing in affected areas and even spread to neighboring countries [9, 10]. Besides that, the reduction of forest area and land degradation due to fires creates uncertainty in the restoration of ecosystem conditions [11]. Based on the significant losses caused by forest and land fires, it is crucial to implement effective fire disaster management efforts to minimize their impact.
According to data from the Indonesian Ministry of Environment and Forestry’s Sipongi website, Bengkalis Regency has been one of the areas in Indonesia that have been severely affected by forest fires. From 2017 to 2021, the regency experienced fires that burnt an area of 25,745 hectares. The highest number of fires was recorded in 2019, which burnt 15,398 hectares [12]. The yearly fires in Bengkalis Regency are mainly caused by the fact that the area is covered with peatlands. When these peatlands catch fire, the soil is burnt entirely, and the resulting impact is the heating of organic matter that does not combust [13, 14]. The heating caused by the fires can reduce the water-holding capacity of organic matter, leading to the drying of the peat soil. Due to the low soil water content and reduced water absorption capability, burnt peat soil becomes more susceptible to re-ignition, increasing the likelihood of fires recurring [15, 16].
Remote sensing techniques can be used to identify forest and land fires by analyzing satellite imagery to obtain data and information on changes in land conditions before and after the fires. Several types of satellite imagery can be used to identify post-burnt areas, as was done [17, 18] using high-resolution Ikonos and GeoEye satellite images with the Support Vector machine (SVM) and Segmentation methods. This actually gives optimal results but this is not free access/paid while monitoring forest fires for tropical countries requires continuity. Several studies [19-21] were also carried out on free access imagery such as Modis satellite imagery and Landsat-8 satellite imagery for the identification of forest and land fires. Modis satellite imagery can monitor forest fires on a daily basis because of their temporal resolution per day. However, it has a low spatial resolution (250m-1km) so it is for early and rapid identification. While Landsat-8 imagery has a spatial resolution of 30m so it is more detailed but monitored every 16 days. This is a challenge for studies on other free access satellite imagery with better spatial resolution and free access such as the Sentinel-2A image (spatial resolution 10) needs to be carried out to obtain optimal and continuous results.
Forest and land fires can be identified by analyzing the resulting fire index values, such as the Normalized Burn Ratio (NBR), which is a measure of the severity of the fire. The burnt area can be identified by determining the threshold value based on fire sampling results obtained from the NBR index. Referring to the study [22], the threshold model used to determine the potential burnt area includes µ+2σ, µ+1σ, µ, µ-1σ, and µ-2σ. Despite using the threshold model, several studies have found differences in the best threshold results for identifying burnt areas. Also, a study [23] is conducted that employed three threshold models and found that the µ+1σ model yielded the best results for identifying burnt areas, with an accuracy rate of up to 63.5%. In contrast, the study [24] used the same threshold model and found that the best threshold model for identifying burnt areas was µ-1σ, with an accuracy rate of 85.85%. Similarly, the study [25] also utilized the µ-1σ threshold model to identify burnt areas. To account for the discrepancies in the best threshold model used by previous studies, this research will employ five threshold models: µ+2σ, µ+1σ, µ, µ-1σ, and µ-2σ, to determine the optimal threshold model for identifying burnt areas.
Based on the description of the problem under study and previous research regarding the problem of forest and land fires, this study aims to use Sentinel-2 imagery in conjunction with the Normalized Burn Ratio (NBR) index and the thresholding method to identify previously burnt areas. The identification of burnt areas can be leveraged to expedite planning and restoration efforts aimed at rehabilitating the condition of the affected land.
2.1 Research location
The research area is situated in Bengkalis Regency, Riau Province, which is astronomically located between 2°7'37.2"-0°55'33.6" N and 100°57'57.6"-102°30'25.2" E. Riau Province is one of the provinces with the largest land and forest fires in Indonesia with an area of 418,619.46 ha in a certain period of time. In September 2019, the number of hotspots in this area reached 1.616 points [26]. It is the highest number of hotspots compared to other provinces in that period. the area with the most hotspots in Riau province is in Bengkalis Regency.
Bengkalis is dominated by peatland, which makes this area very prone to forest and land fires. Peatland in this regency is equivalent to about 65-67% of its area [27]. The location of Bengkalis Regency can be seen in Figure 1.
Figure 1. Research location
2.2 Research tools and data
The tool used in this study was QGIS software for data processing and analysis. It is open sources software with complete tools in GIS [28]. It is GIS software that also compatible with image processing. There are complete tools of image processing in QGIS from preprocessing until advance processing. We can use raster calculator to compute NBR and analysis the area burn using GIS spatial analysis. Meanwhile, the data needed were as follows:
2.3 Research implementation
(1) Image preprocessing
The Sentinel-2 imagery data downloaded via Google Earth Engine has undergone geometric correction, radiometric correction, and atmospheric correction using sen2cor. The imagery has been resampled to a 10m image resolution. In addition, a geometric accuracy test was conducted in this study to ensure the accuracy of the Sentinel-2 imagery. The geometric test was carried out using the image-to-image method to determine the RMSE (Root Mean Square Error) value as the coordinate shift value and the CE90 (Circular Error) value, which is the horizontal accuracy value of the satellite imagery at a 90% confidence level. The equations for calculating RMSE and CE90 were obtained from PERKA BIG No. 6/2018. In this study, the examined data was Sentinel-2 imagery using a distribution of 30 independent checkpoints (ICPs).
(2) Extracting burnt areas using NBR
The burnt area index was obtained by calculating the image index before and after burning, as well as the difference value of the NBR index (dNBR). NBR (Normalized Burn Ratio) is an index used to identify burnt areas and provide a measure of burn severity. NBR (Normalized Burn Ratio) is calculated as the ratio between the near-infrared (NIR) and short-wave infrared (SWIR) wavelengths. Vegetation before the fire will have a high reflectance value to the NIR wavelength and a low reflectance to the SWIR wavelength, and the opposite will happen in the image after the fire. This means that the image after the fire will have a low reflectance value to the NIR wavelength and a high reflectance to the SWIR wavelength. High values of the NBR typically indicate healthy vegetation, while low values indicate empty land and recently burnt areas [29]. The equation used for the NBR method is shown in Eq. (1).
$N B R=\frac{N I R-S W I R}{N I R+S W I R}$ (1)
where,
NBR=Normalized Burn Ratio;
NIR=Spectral value of NIR channel (Band 8);
SWIR=Spectral value of SWIR channel (Band 12).
Meanwhile, the dNBR value can be used to determine the severity of forest and land fires properly. The dNBR value can be calculated using satellite imagery data before and after burning [30]. The dNBR value is an indicator of forest and land fire severity, with a high value indicating a large, severe fire and a negative value indicating a high rate of post-fire vegetation growth [31]. The dNBR value can be calculated using Eq. (2).
$d N B R=N B R ~pre~ fire -N B R~ post~fire$ (2)
where,
dNBR=Difference in NBR before and after fires;
NBRprefire=NBR image before fires;
NBRpostfire=NBR image after fires.
(3) Determining threshold value
Threshold values can be used to determine fire area information. The threshold is calculated using the mean value (µ) and standard deviation (σ) of the sample area which represents the burnt area in the difference image. Sampling was carried out using the systematic grid sampling method, in which the coordinates of the sample selection for burnt areas were determined systematically based on predetermined intervals according to the grid. The calculation of the threshold value was performed by extracting the difference image value at the sample point. The extracted samples were then tested for normality to determine whether the sample data in this study followed a normal distribution. The threshold models used in this study were µ+2σ, µ+1σ, µ, µ-1σ, and µ-2σ.
(4) Testing the accuracy of the classification
The accuracy test for the classification of burnt areas was conducted by comparing the estimated burnt areas identification results with the reference data for burnt areas. Both the identification result data and the fire reference data must be in the same format to accurately calculate valid data, omissions, and commissions. Valid data refers to processed burnt area data that matches the reference data. Omission data refers to reference data that does not match the processed burnt area data, while commission data refers to processed burnt area data that does not match the reference data. The results of calculating the extent of valid data, omission, and commission data were then used to calculate the accuracy of users, producers, and overall accuracy.
2.4 Data analysis
The analysis of data in this study was conducted digitally using QGIS software, which involved calculating the Normalized Burn Ratio (NBR) index values of satellite images before and after fires. The burnt areas were identified by applying a threshold value derived from the difference in NBR (dNBR) index values, which was obtained through the sampling of the burnt area. The threshold models used to identify burnt areas in this study were µ+2σ, µ+1σ, µ, µ-1σ, and µ-2σ. After that, to assess the accuracy of our identification method, we compared the results with reference data on burnt areas.
3.1 Results of the image geometric test
To assess the accuracy of the satellite imagery, we conducted a geometric test using the image-to-image method. This involved determining two values: the Root Mean Square Error (RMSE), which represents the coordinate shift value, and the Circular Error (CE90), which is the horizontal accuracy value with a 90% confidence level. The equations for calculating RMSE and CE90 were sourced from PERKA BIG No. 6/2018. In our study, we tested Sentinel-2 imagery using 30 independent checkpoints (ICPs). The RMSE was calculated by distributing the ICPs and yielded a value of 1.33103.
The CE90 calculation was used to determine the difference in the horizontal position of the object on the map with the position that is considered to be not greater than the radius. To calculate this value, we used the Root Mean Square Error (RMSE) from the test sample points, as shown in Eq. (3).
$CE 90=1.5175 \times R M S E$
$CE90 =1.5175 \times 1.33103=2.01983 ~pixels$ (3)
Table 1. Technical guidelines for basic map accuracy
|
No |
Scale |
Contour Interval (m) |
RBI Map Accuracy |
|||||
|
Class 1 |
|
Class 2 |
|
Class 3 |
|
|||
|
Horizontal (CE90 in m) |
Vertical (LE90 in m) |
Horizontal (CE90 in m) |
Vertical (LE90 in m) |
Horizontal (CE90 in m) |
Vertical (LE90 in m) |
|||
|
1 |
1:1,000,000 |
400 |
300 |
200 |
600 |
300 |
900 |
400 |
|
2 |
1:500,000 |
200 |
150 |
100 |
300 |
150 |
450 |
200 |
|
3 |
1:250,000 |
100 |
75 |
50 |
150 |
75 |
225 |
100 |
|
4 |
1:100,000 |
40 |
30 |
20 |
60 |
30 |
90 |
40 |
|
5 |
1:50,000 |
20 |
15 |
10 |
30 |
15 |
45 |
20 |
|
6 |
1:25,000 |
10 |
7,5 |
5 |
15 |
7.5 |
22.5 |
10 |
|
7 |
1:10,000 |
4 |
3 |
2 |
6 |
3 |
9 |
4 |
|
8 |
1:5,000 |
2 |
1.5 |
1 |
3 |
1.5 |
4.5 |
2 |
|
9 |
1:2,500 |
1 |
0.75 |
0.5 |
1.5 |
0.75 |
2.3 |
1 |
|
10 |
1:1,000 |
0.4 |
0.3 |
0.2 |
0.6 |
0.3 |
0.9 |
0.4 |
The CE90 value obtained in our study was 2,0198 pixels, in which each pixel in Sentinel-2 imagery corresponds to a size of 10 meters. This means that the calculated value for CE90 is 20.198 meters. According to Table 1, this value falls into class 1 with a horizontal scale of 1:50,000 and a corresponding horizontal accuracy of up to 15 meters [32].
3.2 Results of the burnt area extraction using the NBR index
3.2.1 Results of applying the NBR index
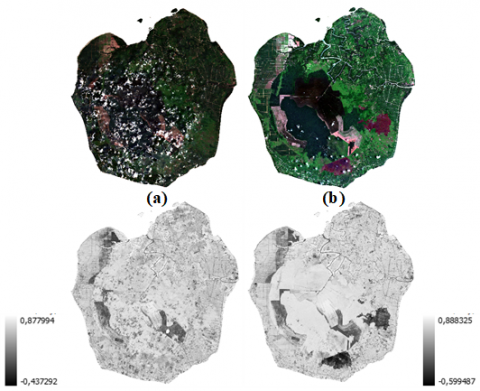
Figure 2. RGB and NBR visualization for February 2019: (a) pre-fire and (b) post-fire
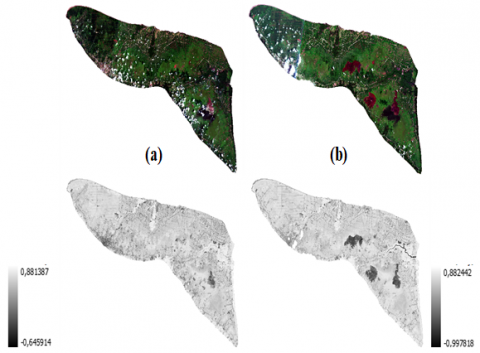
Figure 3. RGB and NBR visualization for March 2019: (a) pre-fire and (b) post-fire
Figure 4. RGB and NBR visualization for February 2020: (a) pre-fire and (b) post-fire
Figure 5. RGB and NBR visualization for April 2020: (a) pre-fire and (b) post-fire
To apply the NBR index for burnt area extraction, pre-fire and post-fire images were required. The resulting burnt area maps using the NBR index were presented as single-band grayscale images for four periods: February 2019 (see Figure 2), March 2019 (see Figure 3), February 2020 (see Figure 4), and April 2020 (see Figure 5).
The true color band composite (R:4 G:3 B:2) images shown in Figures 2 to 5 illustrate the changes in vegetation land cover before and after the fire. In the images on the left, the land cover appears as green vegetation, while the images on the right show open land with a dark red color, indicating the burnt areas. The NBR index visualizations using single-band grayscale images reveal the changes in the index values before and after the fire. The range of values is represented from black to white, indicating a change from low to high values. During the February 2019 fire, the pre-fire NBR index ranged from-0.437 to 0.878, while the post-fire NBR index ranged from-0.599 to 0.888. In addition, during the March 2019 fire, the pre-fire NBR index ranged from-0.646 to 0.881, while the post-fire NBR index ranged from-0.998 to 0.883. Furthermore, during the February 2020 fire, the pre-fire NBR index ranged from-0.507 to 0.868, while the post-fire NBR index ranged from-0.733 to 0.882. Finally, during the April 2020 fire, the pre-fire NBR index ranged from-0.733 to 0.882, while the post-fire NBR index ranged from-0.990 to 0.856. In the images after burning (right), areas that indicate forest and land fires appear black.
3.2.2 Results of applying the difference value of the NBR index (dNBR)
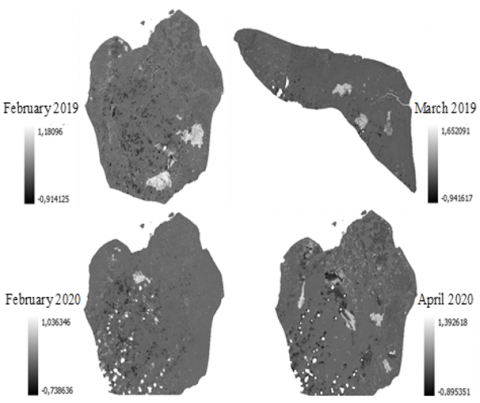
The difference value of the NBR index (dNBR) is the result of changing the value of the NBR image before burning with the NBR image after burning. This value represents the change in land cover in the area affected by the fire. The visualization of the dNBR index is shown in Figure 6.
The visualization of the dNBR index using the single-band gray in Figure 6 reveals the inverse results of the application of the NBR index in Figures 2 to 5. In Figure 6, areas of forest and land fires with high values are indicated by white color in the image. In the February 2019 fires, the dNBR value ranged from-0.914 to 1.181. Furthermore, in the March 2019 fires, the dNBR value ranged from-0.941 to 1.652. Additionally, in the February 2020 fires, the dNBR value was from-0.739 to 1.036. Finally, in the April 2020 fires, the dNBR value was from-0.895 to 1.393.
Figure 6. The visualization of the difference value of the NBR index (dNBR)
3.3 Results of the threshold model and testing the accuracy of the application of the threshold model on the burnt areas
3.3.1 Results of the threshold models on the burnt areas
The results of the threshold models were obtained by calculating the mean and standard deviation at sample points spread across the burnt area. This study employed five threshold models, namely µ+2σ, µ+1σ, µ, µ-1σ, and µ-2σ, with the calculation results of each threshold model shown in Table 2.
3.3.2 Results of the accuracy test on the application of the threshold model on the burnt areas
The accuracy test involved comparing the burnt area identification results obtained using the threshold model with the burnt area reference data. The accuracy calculations were based on a comparison of the polygon area of the burnt area resulting from the processing with the burnt area reference data. Table 3 shows the results of the accuracy calculation.
Table 2. The results of the calculation of the threshold models
|
Threshold Models for February 2019 |
||||||
|
Mean (µ) |
Standard Deviation (σ) |
Threshold Models |
||||
|
µ+2σ |
µ+1σ |
µ |
µ-1σ |
µ-2σ |
||
|
0.7830 |
0.1612 |
1.1054 |
0.9442 |
0.7830 |
0.6218 |
0.4606 |
|
Threshold Models for March 2019 |
||||||
|
Mean (µ) |
Standard Deviation (σ) |
Threshold Models |
||||
|
µ+2σ |
µ+1σ |
µ |
µ-1σ |
µ-2σ |
||
|
0.8074 |
0.1696 |
1.1466 |
0.9770 |
0.8074 |
0.6377 |
0.4681 |
|
Threshold Models for February 2020 |
||||||
|
Mean (µ) |
Standard Deviation (σ) |
Threshold Models |
||||
|
µ+2σ |
µ+1σ |
µ |
µ-1σ |
µ-2σ |
||
|
0.7033 |
0.1006 |
0.9045 |
0.8039 |
0.7033 |
0.6027 |
0.5021 |
|
Threshold Models for April 2020 |
||||||
|
Mean (µ) |
Standard Deviation (σ) |
Threshold Models |
||||
|
µ+2σ |
µ+1σ |
µ |
µ-1σ |
µ-2σ |
||
|
0.8029 |
0.1569 |
1.1168 |
0.9598 |
0.8029 |
0.6460 |
0.4891 |
Table 3. Results of the accuracy test before adding land cover parameters
|
Fire Period |
Treshold Models |
Area (Ha) |
Accuracy (%) |
|||||
|
Overall |
Valid |
Omission |
Commission |
User |
Producer |
Overall |
||
|
February 2019 |
µ+2σ |
70.632 |
70.290 |
4897.051 |
0.342 |
99.52 |
1.42 |
1.41 |
|
µ+1σ |
826.105 |
797.806 |
4169.535 |
28.298 |
96.57 |
16.06 |
15.97 |
|
|
µ |
2546.384 |
2229.859 |
2737.482 |
316.525 |
87.57 |
44.89 |
42.20 |
|
|
µ-1σ |
4401.645 |
3624.213 |
1343.128 |
777.432 |
82.34 |
72.96 |
63.09 |
|
|
µ-2σ |
5637.771 |
4303.361 |
663.981 |
1334.411 |
76.33 |
86.63 |
68.29 |
|
|
March 2019 |
µ+2σ |
157.949 |
47.794 |
1567.029 |
110.155 |
30.26 |
2.96 |
2.77 |
|
µ+1σ |
828.230 |
622.785 |
992.039 |
205.445 |
75.19 |
38.57 |
34.21 |
|
|
µ |
1568.263 |
1144.305 |
470.518 |
423.958 |
72.97 |
70.86 |
56.13 |
|
|
µ-1σ |
2123.937 |
1393.686 |
221.137 |
730.250 |
65.62 |
86.31 |
59.43 |
|
|
µ-2σ |
2686.343 |
1498.993 |
115.830 |
1087.350 |
57.96 |
92.83 |
55.47 |
|
|
February 2020 |
µ+2σ |
18.981 |
18.135 |
839.490 |
0.846 |
95.54 |
2.11 |
2.11 |
|
µ+1σ |
174.993 |
125.970 |
731.656 |
49.023 |
71.99 |
14.69 |
13.89 |
|
|
µ |
481.095 |
339.017 |
518.609 |
142.078 |
70.47 |
39.53 |
33.91 |
|
|
µ-1σ |
843.105 |
535.757 |
321.868 |
307.347 |
63.55 |
62.47 |
45.99 |
|
|
µ-2σ |
1316.636 |
650.485 |
207.140 |
666.151 |
49.41 |
75.85 |
42.69 |
|
|
April 2020 |
µ+2σ |
45.480 |
44.861 |
2693.800 |
0.619 |
98.64 |
1.64 |
1.64 |
|
µ+1σ |
377.957 |
368.923 |
2369.739 |
9.034 |
97.61 |
13.47 |
13.43 |
|
|
µ |
1556.041 |
1062.723 |
1675.938 |
493.317 |
68.30 |
38.80 |
32.88 |
|
|
µ-1σ |
2745.136 |
1693.015 |
1045.647 |
1052.121 |
61.67 |
61.82 |
44.66 |
|
|
µ-2σ |
3960.214 |
2100.504 |
638.158 |
1859.710 |
53.04 |
76.70 |
45.68 |
|
From the results of the accuracy test using five threshold models as shown in Table 3, we found that the µ-2σ threshold model had the highest accuracy value. During the February 2019 fire period, the overall accuracy value was 68.29%. In March 2019, it was 55.47%. In February 2020, it was 42.69%. Finally, in April 2020, it reached 45.68%. The identification of burnt areas using the NBR index and the threshold model still detected other land covers as burnt areas, including some open areas. The inclusion of other land covers detected as burnt areas, such as open areas, can affect the accuracy of the processed data compared to the fire reference data. To mitigate this issue, an alternative approach is required. This involves overlaying the processed data on burnt areas with non-vegetative land cover data. This will help to identify the actual fire areas in forest and land cover. The processed data is overlaid with land cover data, including bodies of water, open ground, ponds, rice fields, swamps, dryland farming, mining, and settlements, to obtain more accurate fire area identification. The accuracy of the results obtained after overlaying is shown in Table 4.
Table 4. Results of the accuracy test after adding land cover parameters
|
Fire Period |
Treshold Models |
Area (Ha) |
Accuracy (%) |
|||||
|
Overall |
Valid |
Omission |
Commission |
User |
Producer |
Overall |
||
|
February 2019 |
µ+2σ |
70.493 |
70.290 |
4897.051 |
0.203 |
99.71 |
1.42 |
1.41 |
|
µ+1σ |
816.892 |
797.806 |
4169.535 |
19.086 |
97.66 |
16.06 |
16.00 |
|
|
µ |
2338.943 |
2229.859 |
2737.482 |
109.084 |
95.34 |
44.89 |
43.93 |
|
|
µ-1σ |
3880.144 |
3624.213 |
1343.128 |
255.931 |
93.40 |
72.96 |
69.39 |
|
|
µ-2σ |
4612.203 |
4303.361 |
663.981 |
308.843 |
93.30 |
86.63 |
81.56 |
|
|
March 2019 |
µ+2σ |
50.207 |
47.794 |
1567.029 |
2.413 |
95.19 |
2.96 |
2.96 |
|
µ+1σ |
698.454 |
622.785 |
992.039 |
75.669 |
89.17 |
38.57 |
36.84 |
|
|
µ |
1377.873 |
1144.305 |
470.518 |
233.568 |
83.05 |
70.86 |
61.91 |
|
|
µ-1σ |
1806.838 |
1393.686 |
221.137 |
413.152 |
77.13 |
86.31 |
68.72 |
|
|
µ-2σ |
1922.662 |
1498.993 |
115.831 |
423.670 |
77.96 |
92.83 |
73.53 |
|
|
February 2020 |
µ+2σ |
18.237 |
18.135 |
839.490 |
0.101 |
99.44 |
2.11 |
2.11 |
|
µ+1σ |
127.270 |
125.970 |
731.656 |
1.300 |
98.98 |
14.69 |
14.67 |
|
|
µ |
347.937 |
339.017 |
518.609 |
8.920 |
97.44 |
39.53 |
39.12 |
|
|
µ-1σ |
562.746 |
535.757 |
321.868 |
26.989 |
95.20 |
62.47 |
60.56 |
|
|
µ-2σ |
700.052 |
650.039 |
207.586 |
49.502 |
92.92 |
75.80 |
71.66 |
|
|
April 2020 |
µ+2σ |
44.964 |
44.861 |
2693.800 |
0.103 |
99.77 |
1.64 |
1.64 |
|
µ+1σ |
374.691 |
368.923 |
2369.739 |
5.768 |
98.46 |
13.47 |
13.44 |
|
|
µ |
1117.007 |
1062.723 |
1675.938 |
54.283 |
95.14 |
38.80 |
38.05 |
|
|
µ-1σ |
1869.937 |
1693.015 |
1045.647 |
176.922 |
90.54 |
61.82 |
58.07 |
|
|
µ-2σ |
2359.936 |
2077.399 |
661.262 |
282.537 |
88.03 |
75.85 |
68.76 |
|
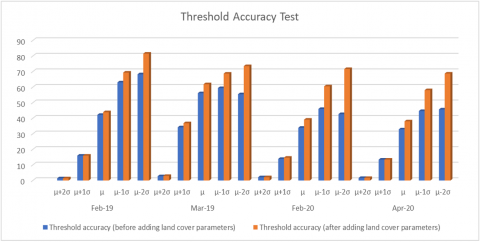
Figure 7. Differences in the results of the accuracy test
After testing the accuracy of the overlay results between the image processing data and non-vegetation land cover data, the µ-2σ threshold model was found to be the most effective in detecting fires during each fire period. Figure 7 illustrates the difference in the accuracy test results before and after applying the overlay method.
The conclusion drawn from Figure 7 is that overlaying the processing results of burnt areas with non-vegetative land cover data can significantly improve the accuracy of detecting burnt areas, especially in forest and land areas. The accuracy of identifying burnt areas was then improved by using the best threshold model, which is µ-2σ, and overlaying the processing results with non-vegetative land cover data. In the February 2019 fire period, the accuracy test results showed an improvement to 81.56% with a total area of 4,612,203 hectares. In the March 2019 fire period, it was 73.53% with a total area of 1,922,662 hectares. In the February 2020 fire period, it was 71.66% with a total area of 700,052 hectares. Finally, in the April 2020 fire period, it was 68.76% with a total area of 2,359,936 hectares. Using combination dNBR and Land cover can improve the accuracy until 81.56%. It appropriate to identify burnt area of forest and land fire in Bengkalis, especially in peatland area.
This study shows that the most effective threshold model for detecting fires in each fire period is the µ-2σ model. This finding is consistent with a study conducted [33] that compared some models of identifying forest and land fire areas using the NBR indices with the µ+2σ and µ-2σ threshold models in Landsat-8 imagery. The study found that the best identification results for burnt areas were obtained using the NBR threshold model with the index µ-2σ, achieving an accuracy rate of 50.62 %. Furthermore, in a recent study [34], various fire indices, including the NBR, were compared using five threshold models on Sentinel-2 imagery. The study found that the µ-2σ threshold model had the highest accuracy in identifying burnt areas, reaching 75.51%. The differences in the accuracy of the threshold model can be influenced by the quality of the remote-sensing satellite imagery used. Higher-resolution satellite imagery can provide more detailed identification results. Furthermore, other types of land covers that are not burnt areas can also be detected when applying a threshold model to the NBR index. Therefore, in this study, the identified burnt areas were re-examined using non-vegetation land cover data to obtain more accurate results for forest and land areas. This process resulted in higher accuracy in the application of the threshold model. Furthermore, the challenge for future research is to obtain the most optimal threshold value for dNBR in the detection of burnt areas. Future research can improve accuracy by using combination dNBR and machine learning-based thresholds such as machine learning threshold [35], OTSU threshold [36] and others.
The results of this study lead to the conclusion that the extraction and identification of burnt areas in the NBR index were achieved by processing the difference value of the NBR index (dNBR). This was calculated using satellite imagery data before and after a fire to determine the extent of the difference. A high dNBR value indicates a large fire that has caused significant damage, while a negative dNBR value suggests a high rate of vegetation growth after burning.
The NBR change algorithm model is effective in identifying burnt areas. The calculation of the burnt area reveals that the best threshold model to use is µ-2σ, which is consistent with the reference data for forest and land fires. The µ-2σ threshold model continues to be the best option for detecting fires during each fire period, even after overlaying image processing data on non-vegetation land cover data to accurately locate fire areas in forests and on land covers. Combination dNBR and Land cover needed to improve the accuracy. The results of the accuracy test of the µ-2σ threshold model after the addition of land cover in different fire periods were as follows: February 2019-81.56%, March 2019-73.53%, February 2020-71.66%, and April 2020-68.76%. For this reason, the NBR method applied to Sentinel-2 data can be considered a quick and highly accurate way to detect burnt areas using remote sensing techniques. In the future, this accuracy can be improved by combining dNBR with other threshold methods such as machine learning threshold, OTSU threshold and others.
This research was financially supported by The Faculty of Engineering, Diponegoro University, Indonesia through Strategic Research Grant 2023 with Grant Number: 038/S/Geodesi/5/UN7.F3/PP/III/2023.
[1] Mutaqin, F., Nurrochmat, D.R., Supriyanto, B. (2023). Evaluating the sustainability of forest utilization in the protected areas of Mandalagiri Forest, West Java, Indonesia. Biodiversitas Journal of Biological Diversity, 24(5): 2745-2755. https://doi.org/10.13057/biodiv/d240528
[2] Santika, T., Meijaard, E., Budiharta, S., Law, E.A., Kusworo, A., Hutabarat, J.A., Indrawan, T.P., Struebig, M., Raharjo, S., Huda, I., Sulhani, Ekaputri, A.D., Trison, S., Stigner, M., Wilson, K.A. (2017). Community forest management in Indonesia: Avoided deforestation in the context of anthropogenic and climate complexities. Global Environmental Change, 46: 60-71. https://doi.org/10.1016/j.gloenvcha.2017.08.002
[3] Wulandari, E., Mardiatno, D., Susilastuti, D.H., Maryudi, A. (2022). Scholarly interest in forest fires in Indonesia: A bibliographical review. Forest and Society, 6(2): 609-619. https://doi.org/10.24259/fs.v6i2.21473
[4] Ryadi, A., Masyhar, A. (2021). Forest fires and law enforcement: The capture of Indonesian contemporary condition. Journal of Law and Legal Reform, 2(1): 39-50. https://doi.org/10.15294/jllr.v2i1.42723
[5] Kadir, E.A., Rosa, S.L., Syukur, A., Othman, M., Daud, H. (2022). Forest fire spreading and carbon concentration identification in tropical region Indonesia. Alexandria Engineering Journal, 61(2): 1551-1561. https://doi.org/10.1016/j.aej.2021.06.064
[6] Nurhayati, A.D., Saharjo, B.H., Sundawati, L., Syartinilia, S., Cochrane, M.A. (2021). Forest and peatland fire dynamics in south sumatra province. Forest and Society, 5(2): 591-603. https://doi.org/10.24259/fs.v5i2.14435
[7] Brasika, I.B.M. (2022). The role of el Nino variability and peatland in burnt area and emitted carbon in forest fire modeling. Forest and Society, 6(1): 84-103. https://doi.org/10.24259/fs.v6i1.10671
[8] Yulianti, N., Kusin, K., Naito, D., Kawasaki, M., Kozan, O., Susatyo, K.E. (2020). The linkage of el Niño-induced peat fires and its relation to current haze condition in central Kalimantan. Journal of Wetlands Environmental Management, 8(2): 100-116. https://doi.org/10.20527/jwem.v8i2.221
[9] Sheldon, T.L., Sankaran, C. (2017). The impact of Indonesian forest fires on Singaporean pollution and health. American Economic Review, 107(5): 526-529. https://doi.org/10.1257/aer.p20171134
[10] Hasyim, S., Abdullah, R., Ibrahim, H. (2021). Forest damage and preservation through forest resources management in Indonesia. GeoJournal, 86: 2183-2189. https://doi.org/10.1007/s10708-020-10177-5
[11] Sanderfoot, O.V., Bassing, S.B., Brusa, J.L., Emmet, R.L., Gillman, S.J., Swift, K., Gardner, B. (2022). A review of the effects of wildfire smoke on the health and behavior of wildlife. Environmental Research Letters, 16(12): 123003. https://doi.org/10.1088/1748-9326/ac30f6
[12] Thoha, A.S., Istima, N., Daulay, I.A., Hulu, D.L.N., Budi, S., Ulfa, M., Mardiyadi, Z. (2023). Spatial distribution of 2019 forest and land fires in Indonesia. Journal of Physics: Conference Series, 2421: 012035. https://doi.org/10.1088/1742-6596/2421/1/012035
[13] Wösten, J.H.M., Van Den Berg, J., Van Eijk, P., Gevers, G.J.M., Giesen, W.B.J.T., Hooijer, A., Idris, A., Leenman, P.H., Rais, D.S., Siderius, C., Silvius, M.J., Suryadiputra, N., Wibisono, I.T. (2006). Interrelationships between hydrology and ecology in fire degraded tropical peat swamp forests. International Journal of Water Resources Development, 22(1): 157-174. https://doi.org/10.1080/07900620500405973
[14] Albar, I., Jaya, I.N.S., Saharjo, B.H., Kuncahyo, B. (2016). Spatio-temporal typology of land and forest fire in Sumatra. Indonesian Journal of Electrical Engineering and Computer Science, 4(1): 83-90. https://doi.org/10.11591/ijeecs.v4.i1.pp83-90
[15] Ardiansyah, M., Boer, R., Situmorang, A.P. (2017). Typology of land and forest fire in South Sumatra, Indonesia based on assessment of MODIS data. In IOP Conference Series: Earth and Environmental Science, IOP Publishing, 54(1): 012058. https://doi.org/10.1088/1755-1315/54/1/012058
[16] Prasetyo, L.B., Setiawan, Y., Condro, A.A., Kustiyo, K., Putra, E.I., Hayati, N., Wijayanto, A.K., Ramadhi, A., Murdiyarso, D. (2022). Assessing sumatran peat vulnerability to fire under various condition of enso phases using machine learning approaches. Forests, 13(6): 828. https://doi.org/10.3390/f13060828
[17] Dragozi, E., Gitas, I.Z., Stavrakoudis, D.G., Theocharis, J.B. (2014). Burned area mapping using support vector machines and the FuzCoC feature selection method on VHR IKONOS imagery. Remote Sensing, 6(12): 12005-12036. https://doi.org/10.3390/rs61212005
[18] Dragozi, E., Gitas, I.Z., Bajocco, S., Stavrakoudis, D.G. (2016). Exploring the relationship between burn severity field data and very high resolution GeoEye images: The case of the 2011 Evros wildfire in Greece. Remote Sensing, 8(7): 566. https://doi.org/10.3390/rs8070566
[19] Escuin, S., Navarro, R., Fernández, P. (2008). Fire severity assessment by using NBR (normalized burn ratio) and NDVI (normalized difference vegetation index) derived from LANDSAT TM/ETM images. International Journal of Remote Sensing, 29(4): 1053-1073. https://doi.org/10.1080/01431160701281072
[20] Veraverbeke, S., Lhermitte, S., Verstraeten, W.W., Goossens, R. (2011). A time-integrated MODIS burn severity assessment using the multi-temporal differenced normalized burn ratio (dNBRMT). International Journal of Applied Earth Observation and Geoinformation, 13(1): 52-58. https://doi.org/10.1016/j.jag.2010.06.006
[21] Indratmoko, S., Rizqihandari, N. (2019). Burn area detection using landsat 8 OLI TIRS. In IOP Conference Series: Earth and Environmental Science, IOP Publishing, 338(1): 012035. https://doi.org/10.1088/1755-1315/338/1/012035
[22] Fraser, R.H., Li, Z., Cihlar, J. (2000). Hotspot and NDVI differencing synergy (HANDS): A new technique for burned area mapping over boreal forest. Remote Sensing of Environment, 74(3): 362-376. https://doi.org/10.1016/S0034-4257(00)00078-X
[23] Suwarsono, Rokhmatuloh, Waryono, T. (2013). Pengembangan model identifikasi daerah bekas kebakaran hutan dan lahan (burned area) menggunakan citra modis di Kalimantan (model development of burned area identification using modis imagery in Kalimantan). Jurnal Penginderaan Jauh dan Pengolahan Data Citra Digital, 10(2): 93-112.
[24] Pujana, A.M. (2020). Identifikasi burned area menggunakan citra satelit landsat 8 dengan metode normalized difference vegetation index (NDVI) dan normalized burn ratio (NBR) (studi kasus: Kota Palangka Raya, Kalimantan Tengah). Doctoral dissertation, Institut Teknologi Nasional Malang.
[25] Sukojo, B.M., Herwanda, A.S. (2018). Analisis akurasi citra modis dan landsat 8 menggunakan algoritma normalized burn ratio untuk pemetaan area terbakar (studi kasus: Provinsi Riau). Geoid, 13(1): 101-108. http://doi.org/10.12962/j24423998.v13i1.3639
[26] Yuliana, N., Supriatna, J., Winarni, N.L. (2021). Community perceptions and conceptions of the impact of forest and land fires in Bengkalis Regency, Riau Province. In IOP Conference Series: Earth and Environmental Science, IOP Publishing, 886(1): 012102. http://doi.org/10.1088/1755-1315/886/1/012102
[27] Maulana, S.I., Syaufina, L., Prasetyo, L.B., Aidi, M.N. (2019). F In IOP Conference Series: Earth and Environmental Science, IOP Publishing, 399(1): 012021. http://doi.org/10.1088/1755-1315/399/1/012021
[28] Rosas-Chavoya, M., Gallardo-Salazar, J.L., López-Serrano, P.M., Alcántara-Concepción, P.C., León-Miranda, A.K. (2022). QGIS a constantly growing free and open-source geospatial software contributing to scientific development. Cuadernos de Investigación Geográfica, 48(1): 197-213. https://doi.org/10.18172/cig.5143
[29] Loboda, T., O'neal, K.J., Csiszar, I. (2007). Regionally adaptable dNBR-based algorithm for burned area mapping from MODIS data. Remote Sensing of Environment, 109(4): 429-442. https://doi.org/10.1016/j.rse.2007.01.017
[30] Wulder, M.A., Franklin, S.E. (2006). Understanding forest disturbance and spatial pattern: remote sensing and GIS approaches. CRC Press.
[31] Saputra, A.D., Setiabudidaya, D., Setyawan, D., Iskandar, I. (2019). Validasi areal terbakar dengan metode normalized burning ratio menggunkan uav (unmanned aerial vehicle): Studi kasus. Jurnal Penelitian Sains, 19(2): 66-72. https://doi.org/10.56064/jps.v19i2.476
[32] Prabandaru, M. (2022). Proses georeferencing citra Sentinel-2 dengan menggunakan software ArcGIS. Jurnal Ilmiah Geomatika, 2(1): 73-84. https://doi.org/10.31315/imagi.v2i1.7481
[33] Armanto, A.N., Perdinan, Dasanto, B.D., Hidayati, R. (2021). Forest fires and carbon emission release in semi-arid regions of Indonesia: The evidence from medium resolution of satellite imagery. In IOP Conference Series: Earth and Environmental Science, IOP Publishing, 622(1): 012021. https://doi.org/10.1088/1755-1315/622/1/012021
[34] Rizqika, S.N., Prasetyo, Y., Yusuf, M.A. (2022). Analisis akurasi perbandingan algoritma indeks kebakaran hutan (NBR, Bais2, Mirbi, dan ndvi) berdasarkan citra sentinel-2a (studi kasus: Taman Nasional Gunung Merbabu Provinsi Jawa Tengah). Elipsoida: Jurnal Geodesi dan Geomatika, 5(1): 1-8. https://doi.org/10.14710/elipsoida.2022.16858
[35] Khan, S., Alotaibi, R.M. (2023). A novel thresholding for prediction analytics with machine learning techniques. IJCSNS International Journal of Computer Science and Network Security, 23(1): 33-40. https://doi.org/10.22937/IJCSNS.2023.23.1.5
[36] Cao, Q.L., Qingge, L., Yang, P. (2021). Performance analysis of otsu-based thresholding algorithms: A comparative study. Journal of Sensors, 2021: 1-14. https://doi.org/10.1155/2021/4896853