Adedayo F. Adedotun* | Olumide S. Adesina | Olanrewaju K. Onasanya | Edeki S. Onos | Odekina G. Onuche
© 2022 IIETA. This article is published by IIETA and is licensed under the CC BY 4.0 license (http://creativecommons.org/licenses/by/4.0/).
OPEN ACCESS
The current state of all Nigerian roads is in poor condition, and reports of accidents have been recorded across the federation. The larger mission of the sustainable development goal is to promote sustainable cities and communities. This research study aims to examine factors responsible for road accidents in Nigeria through the quantitative tool of higher extensions of the Poisson regression model (ZTNPRM). A cross-sectional study design was adopted and secondary data was used within a sample period from the 1st quarter of 2006 to the 2nd quarter of 2020. Due to overdispersion, ZTNPRM indicates human errors contribute to a large proportion (41.4%) of road accidents. Vehicle factors are also statistically and positively related to road accidents. All the factors this model identified that lead to road accidents predicted low road accidents. Hence, the study recommends that Nigerian car users follow all rules and regulations associated with safe driving and make the environment safer for people as the sustainable development goal (SDGs). This study recommends more attention to the area of accident and injury prevention as a strategic objective of the SDGs.
overdispersion, count models, road accident, zero truncated Poisson model, zero truncated negative Poisson
The injury prevention of the SDG that is related to road safety appears in SDG 3.6 and SDG 11.2 under “good health and well-being” and sustainable cities and communities,” respectively. This stress makes the environment safe for people. To achieve global sustainable growth, injury has to be drastically reduced. Ultrasonics Sonochemistry (2021) [1], the study by Ma et al. [2] highlighted thirteen more relevant areas of SDGs that relate to injury prevention beyond SDGs 3.6 and 11.2.
When a road vehicle collides with another vehicle, a person, an animal, or a topographical or architectural obstruction, it is called a road traffic accident (RTA). Injury, property destruction, and death are all possible outcomes. RTA kills 1.2 million people per year and injures four times as many [3]. A road traffic accident is defined in this study as a collision on the road between two or more objects, one of which must be a moving vehicle of any sort [4]. Road traffic accidents (RTAs) are on the rise in developing countries, and they are now one of the main causes of death.
Accidents and fatalities on the road are the results of a complex interaction of factors. In Nigeria, road users range from pedestrians, rickshaws, bicycles, hand carts, and tractor trolleys to various types of two/three-wheelers, cars, trucks, buses, and multi-axle commercial vehicles, among other things. Because of changes in people's standards of life and urbanization, the automobile population has been steadily expanding. The need and urgency for a well-thought-out policy on the subject of road safety have been highlighted by growth in vehicle population combined with limited road space used by a wide variety of vehicles.
Accidents are becoming more common in Nigeria as the country's population of vehicles grows. Road traffic accidents are human tragedies that cause a significant deal of suffering. They impose a significant socio-economic cost in terms of untimely deaths, injuries, and lost revenue opportunities. Road traffic accidents can have devastating implications, affecting not only people, their health, and well-being, but also the economy. As a result, road safety has become a national concern. Road safety is a multi-faceted and multi-sectorial problem. This includes things like improving and supervising road infrastructure, providing safer vehicles, enforcing rules and laws, mobility planning, providing health and hospital services, child safety, and urban land use planning, among other things. In other words, its scope includes engineering elements of both automobiles and roads on the one hand, as well as health and medical services for trauma cases in the aftermath of a crash on the other.
The biggest issue that Nigerian roads are facing is deterioration owing to a lack of road quality construction by the engineering business in charge, or simply a lack of road maintenance [5]. Accident rates have resulted in many lives being lost over many years, and the trend of death continues to rise. Until now, Nigeria's major roadways have remained in a state of terror, with people fearful of traveling on them for their daily needs or any other reason. According to a report by Saliu et al. [6], numerous locations across the country had extremely inhumane road conditions that had been neglected for many years, and the governments of the various states had never considered constructing them.
According to statistics, around 24% of national highways in Nigeria are in inconvenient shapes, and this trend has continued to rise to 60% since 1999 [7]. According to the report [7], it will cost nearly N350 billion to bring Nigerian roads up to standard or in good repair over the next 9 to 10 years, and upkeep of Nigerian roads will cost N25 billion each year on average, with a cost of N33 billion for road rehabilitation. Ignoring these roads will inevitably result in traffic accidents, resulting in a high number of fatalities and injuries, and, as a result, the country's public and profit-making development would be hampered. The major goal of this research study is to examine the factors that cause road accidents in Nigeria using the quantitative tool of higher extensions of the Poisson regression model because the current state of all Nigerian roads is in poor condition and reports of accidents have been recorded across the federation.
Vehicle-related, environment-dependent, and driver dependent (i.e., pedestrian dependent for hazard between a motor and a pedestrian) are the three categories of risk factors discovered in road accidents.
According to references [8-10], the majority of road crashes are caused by driver factors, which account for 60 percent to 90 percent of all road accidents. 'The constant rising toll of catastrophes or fatalities and wounds or injuries from road crashes in low-income countries is a significant item or an essential success factor in the spontaneous growth in the value of the motor, including vehicles, cars, and trucks [11-13].
Corruption is also a problem in some nations, like Nigeria, where an unskilled individual or driver would be unable to get through driving school and obtain a driver's license. With bribery, the driver will seek alternate means of obtaining licenses through corruption by meeting with license issuance authorities, and as a result, there is a greater likelihood of a death occurring while he or she is on the road. The issue will be raised between the driver and the police, blame between the public and the driver, or the public will blame the police and the drivers, and the police and drivers will blame the public in either direction.
Many authors' efforts and contributions on the factors that cause road accidents are well appreciated and will be remembered for a long time. In various areas of the world [14-16], and also in Nigeria [17-20] different studies have been carried out on factors associated with road accidents. Most of these studies focused to identify determinants of factors associated with road accidents and also used binary logistic regression and Cox proportional regression models. Moreover, different approaches are commonly used to model the number of factors associated with road accidents in different studies. These models might be more recommended to measure the incidence of factors associated with road accidents and associated factors. There is a need for data on the causes that cause road accidents, and additional study is needed to update policy design and programme implementation for the best health intervention.
All of the aforementioned authors, on the other hand, used a variety of statistical methodologies to address the elements that could lead to road accidents, resulting in a variety of statistical outcomes. However, most of the authors' work is focused on regression models, which are unable to capture overdispersion; so, the purpose of this research study is to investigate overdispersion as a gap to be filled.
2.1 Study design
This research study used a cross-sectional study in which secondary data from the National Bureau of Statistics [20] was used to determine the factors associated with road accidents between the years 1st quarter in 2006 and 2nd quarter in 2020. Cross-sectional variables of the states in Nigeria are repeated across the likelihood factors of road accidents in Nigeria. The following Table 1 summarizes the description of the data used in this research, the variables used, and check appendix A for the complete data set.
Table 1. Road accidents summary data for the sample period 2006 – 2020 period 2006 – 2020
|
Variable used |
Abbreviation |
Unit used |
Meaning |
|
$X_1$ |
SPV |
number |
Speed violation |
|
$X_2$ |
UPWD |
number |
Use of phone while driving |
|
$X_3$ |
TBT |
number |
Tyre burst |
|
$X_4$ |
MDV |
number |
Mechanical deficiency vehicle |
|
$X_5$ |
BFL |
number |
Brake failure |
|
$X_6$ |
OVL |
number |
Overloading |
|
$X_7$ |
DOT |
number |
Dangerous overtaking |
|
$X_8$ |
WOT |
number |
Wrongful overtaking |
|
$X_9$ |
DGD |
number |
Dangerous driving |
|
$X_10$ |
BRD |
number |
Bad road |
|
$X_11$ |
RTV |
number |
Route violation |
|
$X_12$ |
OBS |
number |
Road obstruction violations |
|
$X_13$ |
SOS |
number |
Sleeping on steering |
|
$X_14$ |
DAD |
number |
Driving under alcohol/ drug influence |
|
$X_15$ |
PWR |
number |
Poor weather |
|
$X_16$ |
FTQ |
number |
Fatigue |
|
$X_17$ |
SLV |
number |
Sign light violation |
|
$X_18$ |
OTH |
number |
Others |
|
$Y_t$ |
RTA |
number |
Road accident |
2.2 Study variables
The response variable used in this study was the “no. of road accidents” that occurred in Nigeria. This is a count variable because the number of accidents that occur is always nonnegative and they assume exactly whole numbers. The control variables and stimulus variables in this study included environmental factors, vehicular factors, and human factors as summarized in Table 1 above. All the covariate variables are regressed using the extension of the Poisson model and the software to use is strictly R programming.
Firstly, descriptive statistics of all stimulus variables and the controlled variable are found to enable us to have a glimpse of these variables, then followed by the test of collinearity of all stimulus variables. The collinearity test was carried out using the variance inflation factor (VIF), mathematically, VIF is written as:
$V I F=G V I F^{\frac{1}{2 d f}}$
where, GVIF $=$ is the generalized variance inflator factor and is the degree of freedom. But and are reported as well. It is important to note that a variance inflation factor (VIF) value greater than 5 indicates the presence of a correlation between a given independent variable and other independent variables in the model. Once the test of collinearity is done, we proceed to perform a backward stepwise vector generalized linear regression model to enable us to know the variables to use in the actual or final model building or simply the model selection using Alkaike information criteria to select the best model, though VIF will identify that we just to do perform this as well. Stepwise regression is the step-by-step repeated process of building of a regression model that entails the selection of stimulus variables to be worn in a final model. This entails deleting or adding control variables in cycles and testing for statistical significance after each repetition. The mathematical methodology of backward regression model is described below and estimators $\alpha, b_1-b_{18}$ are estimated using maximum likelihood estimation method:
$Y_t=\alpha+b_1 X_1+b_2 X_2+b_3 X_3+b_4 X_4+b_5 X_5+b_6 X_6+b_7 X_7+b_8 X_8+b_9 X_9+b_{10} X_{10}+b_{11} X_{11}+b_{12} X_{12}+b_{13} X_{13}+b_{14} X_{14}+b_{15} X_{15}+b_{16} X_{16}+b_{17} X_{17}+b_{18} X_{18}+\epsilon_t$ (1)
where, $\epsilon_t=$ stepwise regression error or stepwise regression residual and $Y_t=$ number of road accidents and finally $\alpha=$ stepwise regression constant.
Eq. (1) is built and each explanatory variable is deleted at a time as the regression advances and this is based on the following criteria; at each iteration, the variable with the lowest “F to remove” statistic is deleted from the model. Once the explanatory variables are all identified, then we move ahead to build our proposed model, which is a Zero truncated Poisson regression model to account for zero truncation. From the concept of Poisson regression model which models count of data and is described as:
$p\left(y_i\right)=\frac{e^{-\mu_i} \mu_i^{y_i}}{y_{i} !}$
$i=1,2,3,4,5, \ldots \ldots$ (2)
where, $\mu_i=$ long-run expected accidents count occurring at $i^{t h}$ road at a particular time. And also $p\left(y_i\right)$= is the probability of y accidents occurring at the i road during a particular period. Now in the Poisson regression model, the long-run expected accident count is assumed to be a function of control predictors described mathematically as:
$\mu=\exp \left(\vartheta_0+\vartheta_1 X_1+\vartheta_2 X_2+\vartheta_3 X_3+\vartheta_4 X_4\right. \left.+\cdots \vartheta_n X_n\right)$ (3)
where, $X_1, X_2, X_3, \ldots, X_n$ are the predictor variables and their respective coefficients are $\vartheta_1, \vartheta_2, \vartheta_3, \ldots, \vartheta_n$ which all stands for statistical significance of each predictor variable, and they are estimated using the maximum likelihood or the through the method of moment. By taking the logarithm of Eq. (3), thus we have:
$\log \left(\mu_i\right)=\log \left(\exp \left(\vartheta_0+\vartheta_1 X_1+\vartheta_2 X_2+\vartheta_3 X_3+\vartheta_4 X_4\right.\right. \left.\left.+\cdots \vartheta_n X_n\right)\right)$
$\log \left(\mu_i\right)=\left(\vartheta_0+\vartheta_1 X_1+\vartheta_2 X_2+\vartheta_3 X_3+\vartheta_4 X_4+\cdots \vartheta_n X_n\right)+\epsilon_t$
Now recall that
$\mu_i=E\left(Y_i\right)$;
$\rightarrow \log \left(E\left(Y_i\right)\right)=\left(\vartheta_0+\vartheta_1 X_1+\vartheta_2 X_2+\vartheta_3 X_3+\vartheta_4 X_4+\cdots \vartheta_n X_n\right)+\epsilon_t$
$\log \left(Y_i\right)=\left(\vartheta_0+\vartheta_1 X_1+\vartheta_2 X_2+\vartheta_3 X_3+\vartheta_4 X_4+\cdots+\vartheta_n X_n\right)+\epsilon_t$ (4)
From Eq. (4) is the Poisson regression model that model the dependent variable of counts (which can include zero counts i.e. no zero truncation) as a function of many explanatory variables, But this research is now because the dependent variable is disregarding zero i.e. zero is been truncated, hence if $Y_1=0$, its $P_r\left(Y_1=0\right)=e^{-\mu_1}$ and this is obtained from Eq. (2), then its conditional probability mass function is defined as
$P_r\left(Y_1=y_1 \mid Y_1>0\right)=\frac{P_r\left(Y_1=y_1\right)}{P_r\left(Y_1>0\right)}=\frac{P_r\left(Y_1=y_1\right)}{1-P_r\left(Y_1=0\right)}$ (5)
Now using Eq. (2), the zero truncated probability mass function for $\left(Y_1 \mid Y_1>0\right)=$
$f_1^*\left(y_1\right)=P_r\left(Y_1=y_1 \mid Y_1>0\right)$
$=\frac{e^{-\mu_1} \times \mu_1^{y_1}}{y_{1} !} \times \frac{1}{\left(1-e^{-\mu_1}\right)}=\frac{\mu_1^{y_1}}{y_{1} !\left(e^{-\mu_1}-1\right)}$ (6)
Then taking the exponential form of the mass function in Eq. (6), thus we have:
$f_1^*\left(y_1\right)=\exp \left[y_1 \ln \left(\mu_1\right)-\ln \left(y_{1} !\right)-\ln \left(e^{\mu_1}-1\right)\right]$ (7)
Similarly, the zero truncated conditional distribution of $\left(Y_2 \mid y_1, Y_2>0\right)$ is
$P_r\left(Y_2=y_2 \mid Y_2>0\right)=\frac{P_r\left(\left(Y_2=y_2 \mid y_1\right)\right)}{P_r\left(Y_2>0 / y_1\right)}=\frac{P_r\left(\left(Y_2=y_2 \mid y_1\right)\right)}{1-P_r\left(Y_2=0 / y_1\right)}$ (8)
The zero truncated condition Poisson distribution of Eq. (8) is given as
$f_2{ }^*\left(y_2\right)=f_2{ }^*\left(\left(Y_2=y_2 \mid y_1, Y_2>0\right)\right)$
$=\frac{e^{-\mu_2 y_1} \times\left(\mu_2 y_1\right)^{y_2}}{y_{2} !} \times \frac{1}{\left(1-e^{-\mu_2 y_1}\right)}=\frac{\left(\mu_2 y_1\right)^{y_2}}{y_{2} !\left(e^{-\mu_2 y_1}\right)}$ (9)
Now taking the exponential form of the mass function in Eq. (10), thus we have:
$f_2^*\left(y_2\right)=f_2^*\left(\left(Y_2=y_2 \mid y_1, Y_2>0\right)\right)$
$=\exp \left[\left(y_2 \ln \left(\mu_2\right)+y_2 \ln \left(y_1\right)-\ln \left(y_{2} !\right)-\ln \left(e^{\mu_2 y_1}-1\right)\right)\right]$ (10)
Both Eq. (6) and Eq. (9) are two zero truncated conditional distributions, finding their joint distribution will lead to another model called zero truncated bivariate Poisson model and which is not our proposed model. Eq. (7) is used to estimate our long-run expected frequency $\mu_1$ from the conditional distribution.
Hence, from Eq. (7) we say:
Let $L=f_1^*\left(y_1\right)$, then
$L=\exp \left[y_1 \ln \left(\mu_1\right)-\ln \left(y_{1} !\right)-\ln \left(e^{\mu_1}-1\right)\right]$ (11)
Now $\ln \left(\mu_1\right)=X^{\prime} \varphi_i$, where $X^{\prime}=\sum_{i=1}^n X_i$ now from Eq. (11), we have that:
$L=\exp \left[y_1 \ln \left(\sum_{i=1}^{18} \varphi_i X_i\right)-\ln \left(y_{1} !\right)-\ln \left(e^{\sum_{i=1}^{18} \varphi_i X_i}-1\right)\right]$ (12)
Now differentiating Eq. (12) with respect to the parameters $\varphi_i$ and then equate to 0 to estimate the parameters $\varphi_i$. Then this $\varphi_i$ are now substituted into this equation:
$\hat{Y}_t=\varphi_0+\varphi_1 X_1+\varphi_2 X_2+\varphi_3 X_3+\varphi_4 X_4+\varphi_5 X_5+\varphi_6 X_6+\varphi_7 X_7+\varphi_8 X_8+\varphi_9 X_9+\varphi_{10} X_{10}+\varphi_{11} X_{11}+\varphi_{12} X_{12}+\varphi_{13} X_{13}+\varphi_{14} X_{14}+\varphi_{15} X_{15}+\varphi_{16} X_{16}+\varphi_{17} X_{17}+\varphi_{18} X_{18}+\epsilon_t$ (13)
where, $\hat{Y}_t=$log expected number of road accidents and $X_i$ are the stimulus variables and which are reduced by a variance inflation factor. Once Eq. (13) has been estimated, we determined whether it is good or appropriate to describe such explanatory variables, and this is done by testing for model fitness, this test explains whether all covariate variables will explain the response variable (number of road accidents).
The model fitness is checked by applying the residual deviance which measures the change in the deviance between the given model and the observed model i.e., the model that fits the data. Residual deviance has a degree of freedom n-p, where n= number of observations and p= number of parameters in the model. In this research, the number of observations we had is 36 observations plus 19 parameters, constant inclusive. Now, if the residual deviance is greater than its corresponding degrees of freedom then the model does not fit the data i.e., the observed values are not close to the predicted means and causing both of them to be large or have a great discrepancy.
In a nutshell, the residual deviance should be relatively small. For a fitted zero truncated Poisson regression model, the deviance D is given by:
$D=2 \sum_{i=1}^N\left[y_i \log \left(\frac{y_i}{\mu_i}\right)-\left(y_i-\mu_i\right)\right]$ (14)
where, $y_i$ observed number of road accidents that occurred at a particular period for any state and $\mu_i$ predicted number of road accidents that occurred at a particular period for any state.
Once the model of the goodness of fit test is done, we determine whether the model in Eq. (13) is over dispersed i.e., we test whether we need to estimate the overdispersion parameter. The mathematical illustration of how to test for overdispersion of the model for this research study is illustrated below:
$\operatorname{disp}_{\text {change }}=2 \times\left(\begin{array}{c}\log \operatorname{like}\left(m_1\right)- \\ \operatorname{loglike}\left(m_2\right)\end{array}\right)$
where, $m_1$ is the log-likelihood obtained when Eq. (13) is modeled with positive negative binomial distribution and $m_2$ is the log-likelihood obtained when Eq. (13) is modeled with positive Poisson regression.
Then dispersion $_{\text {change }}$ is tested using chi-squared under the degree of freedom of the number of dispersed parameters.
The hypothesis is:
$H_0$: No need for dispersion parameter
$H_1$: There is a need for dispersion parameter
The decision rule: if the observed p-value is lower than the exact p-value then $H_0$ is rejected, hence otherwise.
The essence of checking for overdispersion is that if found that the model is over dispersed, it has a great negative effect in estimating the standard error of estimates of the parameters. Once there is a presence of overdispersion, the proposed model is being corrected with a zero truncated negative Poisson regression model.
4.1 Descriptive analysis of variables studies
From Table 2, the total number of road accidents that occurred between the year 2006 to the 2nd quarter in 2020 was about 8319 across all the states in Nigeria. The minimum and the maximum number of road accidents that occurred within the stipulated period is 92 and 686 respectively across all the states.
Table 2. Descriptive analysis of all the stimulus variables understudied
|
Abbr variables |
Meaning |
Average |
Variance |
Std. deviation |
Min |
Max |
Total |
|
RA |
Road accidents |
220 |
1.4e+04 |
120 |
92 |
686 |
8319 |
|
SPV |
Speed violation |
59 |
6.9e+03 |
83 |
6 |
462 |
2190 |
|
UPWD |
Use of phone while driving |
1.1 |
5.6e+00 |
24 |
0 |
14 |
42 |
|
TBT |
Tyre burst |
17 |
4.0e+02 |
20 |
0 |
78 |
634 |
|
MDV |
Mechanical deficiency vehicle |
4.3 |
1.4e+01 |
3.8 |
0 |
17 |
158 |
|
BFL |
Brake failure |
22 |
6.8e+02 |
26 |
0 |
136 |
803 |
|
OVL |
Over loading |
1.7 |
5.8e+00 |
2.4 |
0 |
9 |
62 |
|
DOT |
Dangerous overtaking |
4.1 |
1.3e+01 |
3.5 |
0 |
16 |
152 |
|
WOT |
Wrongful overtaking |
25 |
3.2e+02 |
18 |
2 |
70 |
938 |
|
DGD |
Dangerous driving |
45 |
4.6e+02 |
21 |
0 |
87 |
1675 |
|
BRD |
Bad road |
24 |
1.9e+02 |
14 |
0 |
56 |
880 |
|
RTV |
Route violation |
4.4 |
2.2e+01 |
4.7 |
0 |
28 |
163 |
|
OBS |
Road obstruction violations |
6.2 |
5.2e+2 |
23 |
0 |
140 |
230 |
|
SOS |
Sleeping on steering |
1.6 |
4.1e+00 |
2 |
0 |
9 |
61 |
|
DAD |
Driving under alcohol/ drug influence |
.84 |
2.9e+00 |
1.7 |
0 |
8 |
31 |
|
PWR |
Poor weather |
0.24 |
1.9e-01 |
0.43 |
0 |
1 |
9 |
|
FTQ |
Fatigue |
1.1 |
2.8e+02 |
1.73 |
0 |
7 |
41 |
|
SLV |
Signed light violation |
6.6 |
1.3e+02 |
12 |
0 |
43 |
244 |
|
OTH |
others |
0.16 |
3.1e-01 |
0.55 |
0 |
3 |
6 |
On average, 59 vehicle drivers had driven over speed per year within the sample set of data. Motor vehicle Tyre bursts and brake failure from vehicles constitute about 7.62% (634/8319) and 9.65% (803/8319) for road accidents to occur. 11.25% (938/8319) and 20.13% (1675/8319) constituted the proportion of Motor – vehicle drivers that wrongfully overtake and drove dangerously.
A lower proportion (10.578%,880/8319) of bad road construction leads to road accidents. For the essence of under dispersion, all the variables in Table 2 were all subjected to variance inflation factor to determine variables needed for the actual model, so Table 3 presents it.
Table 3. Variance inflation factor of all the stimulus variables understudied
|
Abbr variables |
Meaning |
GVIF |
VIF |
|
SPV |
Speed violation |
95900 |
$\infty$ |
|
UPWD |
Use of phone while driving |
27 |
5.19*** |
|
TBT |
Tyre burst |
3.2 |
1.79 |
|
MDV |
Mechanical deficiency vehicle |
1.8 |
1.34 |
|
BFL |
Brake failure |
5.12 |
2.26 |
|
OVL |
Overloading |
8.30 |
2.88 |
|
DOT |
Dangerous overtaking |
1.92 |
1.39 |
|
WOT |
Wrongful overtaking |
1.97 |
1.4 |
|
DGD |
Dangerous driving |
2.74 |
1.66 |
|
BRD |
Bad road |
4.03 |
2.01 |
|
RTV |
Route violation |
2.72 |
1.65 |
|
OBS |
Road obstruction violations |
3.99 |
2.00 |
|
SOS |
Sleeping while on steering |
31.50 |
5.61*** |
|
DAD |
Driving under alcohol or drugs |
2.43 |
1.56 |
|
PWR |
Poor weather conditions |
1.45 |
1.21 |
|
FTQ |
Fatigue |
1.61 |
1.27 |
|
SLV |
Sign light violation |
2.45 |
1.57 |
|
OTH |
Others |
3.00 |
1.73 |
4.2 Variance inflation factor analysis of stimulus variables studied
Table 3, shows that all the variables have VIF values less than 5, except “use of phone gadgets while driving” and “sleeping on steering” variables had higher VIF than 5, implying that there is no multicollinearity among the explanatory variables except those variables mentioned. Thus, all variables can be included in the subsequent analysis and modelling with the zero truncated Poisson regression [21]. The step-wise regression model was critically assessed for the variables with VIF larger than 5 for the sake of conformance.
4.3 Backward stepwise regression analysis of stimulus variables studied
For a careful selection of variables and actual model fit, stepwise regression was performed. Based on the stepwise regression model, the following Eq. (15) was suggested:
$y_t=\varphi_0+\varphi_3 X_3+\varphi_4 X_4+\varphi_5 X_5+\varphi_6 X_6+\varphi_7 X_7+\varphi_8 X_8+\varphi_9 X_9+\varphi_{10} X_{10}+\varphi_{11} X_{11}+\varphi_{12} X_{12}+\varphi_{14} X_{14}+\varphi_{15} X_{15}+\varphi_{16} X_{16}+\varphi_{17} X_{17}+\varphi_{18} X_{18}+\varepsilon_t$ (15)
where, $X_1$ and $X_{13}$ were deleted when the backward stepwise vector generalized linear regression model was performed by having the smallest Akaike Information criteria of value 316.61 among all other vector generalized linear regression models. This confirms the true result of the variance inflation factor by eliminating UPWD and SOS. So, Eq. (15) it is estimated.
4.4 Parameter estimation of Eq. (15)
Table 4. Parameter estimation description of zero truncated Poisson regression model
|
Coefficient |
Estimates |
Std. error |
$Z_{\text {value }}$ |
$P_r(>|z|)$ |
|
INTERCEPT |
4.3951 |
0.0708 |
62.041 |
<2e-16 |
|
SPV |
0.00249 |
0.00399 |
6.253 |
4.04e-10 |
|
TBT |
0.005148 |
0.000728 |
7.071 |
1.53e-12 |
|
MDV |
-0.00510 |
0.00401 |
-1.271 |
0.2037 |
|
BFL |
0.003805 |
0.000884 |
4.301 |
1.7e-05 |
|
OVL |
-0.00388 |
0.00618 |
-0.628 |
0.5297 |
|
DOT |
0.00439 |
0.004 |
1.021 |
0.3074 |
|
WOT |
0.00571 |
0.0008841 |
6.463 |
1.03e-10 |
|
DGD |
0.00648 |
0.000853 |
7.604 |
2.88e-14 |
|
BRD |
0.00418 |
0.00108 |
3.862 |
0.000113 |
|
RTV |
0.0113 |
0.00382 |
2.965 |
0.0003026 |
|
OBS |
0.00349 |
0.00152 |
2.3 |
0.0214 |
|
DAD |
-0.01513 |
0.00887 |
-1.705 |
0.088207 |
|
PWR |
-0.0139 |
0.0349 |
-0.397 |
0.6912 |
|
FTQ |
-0.00381 |
0.0104 |
-0.368 |
0.7127 |
|
SLV |
0.00485 |
0.00157 |
3.073 |
0.00212 |
|
OTHERS |
0.00358 |
0.0253 |
0.142 |
0.8874 |
Since the dependent variable is a variable that accepts counts and its value cannot be zero, the estimation of the parameters is shown above from the zero truncated Poisson regression model. From Table 4, it reveals that most of all the stimulus variables are positive except few explanatory variables such as MDV (Mechanical deficient vehicle), OVL (overloading), DAD (Driving under Alcohol or drug influence), PWR (poor weather condition), and FTQ - Driver’s fatigue) are negative and also not significant because their respective p_values are all greater than the observed level of significance or $\alpha=0.05$.
The positivity of other explanatory variables indicated that such variables cause the occurrence of road accidents in Nigeria. For example, from the angle of speed violation factor, the variable was positive and significant, indicating that speed violation is a great cause of road accidents. Similarly, from the angle of brake failure, this variable is also significant and positive and it has a positive effect on the cause of road accidents. The increase in brake failure will lead to an increase in road accidents, as this is in no doubt. From the angle of dangerous driving, it is significant as well and there is a great tendency of road accidents to occur if a driver of a vehicle is driving recklessly.
4.5 Model diagnostic and goodness of fit test
The zero truncated Poisson regression model was subjected to model diagnostics, the value of the deviance for the model estimated was 0 and this value is less than the degree of freedom, hence we say that the model of Eq. (15) built explains all the variables identified in the model. Further, the plot of fitted values against the residual obtained proves that the model is accurate.
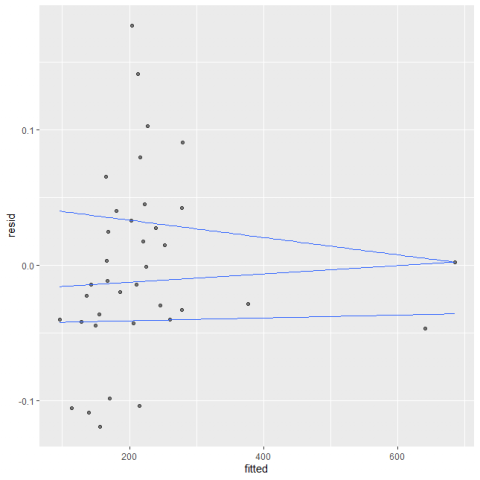
Figure 1. Model diagnosis - The plot of residuals against the fitted values
Figure 2. Model diagnosis - The plot of residual against the fitted values
From Figure 1, most of the fitted values hover around the mean (value=0), hence the model fitted is good. To demonstrate how much of an influence some of the fitted values have, some are far from the mean. These lines, which represent the 25th, 50th, and 75th percentiles, were fitted using quantile regression to assess their impact. Figure 2 describes the effects of extreme fitted values.
From Figure 2, the spread of fitted values is most concentrated at the higher levels rather than the middle levels. Hence having a lower effect on the residual and this signifies that the model is appropriate for under dispersion.
4.6 Test for overdispersion
The change in deviance or dispersion change was estimated to be 10.07956 and significant at p-value (0.001499) indicating that there is a need to estimate dispersion. This dispersion has effect in estimating the standard errors of the estimates of the coefficients of Eq. (15). Hence, to correct this dispersion, a Zero truncated negative Poisson regression model will be fitted and which correct the model estimated in Eq. (15).
4.6.1 Parameter estimation in Zero truncated negative Poisson regression model (To correct for overdispersion in Eq. (15))
This regression model fits a very robust class of models called vector generalized linear models (VGLM) to different diversity of assumed distributions. This research assures that the data – road accidents originated from the negative binomial distribution, but this time without zeros. Thus, these values are strongly and strictly positive Poisson, for which we utilize the positive-negative binomial family from the “posnegbinomial” function passed to “vglm” function in our R programming. The parameter estimations can be seen in Table 5.
Table 5. Parameters estimation description of zero truncated negative Poisson regression model
|
Coefficient |
Estimates |
Std. error |
$Z_{\text {value }}$ |
$P_r(>|z|)$ |
|
INTERCEPT1 |
4.36666 |
0.0737 |
59.203 |
<2e-16 |
|
INTERCEPT2 |
11.4 |
85.003 |
0.134 |
0.038933 |
|
SPV |
0.00285 |
0.004439 |
6.431 |
1.27e-10 |
|
UPWD |
0.01638 |
0.00736 |
2.224 |
0.0262 |
|
TBT |
0.00535 |
0.00737 |
7.252 |
4.09e-13 |
|
MDV |
-0.0125 |
0.00548 |
-2.287 |
0.05222 |
|
BFL |
0.00417 |
0.00888 |
4.703 |
2.56e-06 |
|
OVL |
0.00492 |
0.006835 |
0.72 |
0.4716 |
|
DOT |
0.00509 |
0.00446 |
1.141 |
0.02538 |
|
WOT |
0.00543 |
0.000905 |
6.001 |
1.96e-09 |
|
SOS |
-0.0146 |
0.008 |
-1.819 |
0.0689 |
|
DGD |
0.00667 |
0.000968 |
6.886 |
5.74e-12 |
|
BRD |
0.00476 |
0.00111 |
4.253 |
2.11e-05 |
|
RTV |
0.00992 |
0.00413 |
2.401 |
0.0164 |
|
OBS |
0.00264 |
0.00162 |
1.622 |
0.01048 |
|
DAD |
-0.0148 |
0.00922 |
-1.605 |
0.1084 |
|
PWR |
-0.01146 |
0.00359 |
0.319 |
0.7496 |
|
FTQ |
-0.00126 |
0.011 |
-0.114 |
0.9092 |
|
SLV |
0.00513 |
0.00157 |
3.263 |
0.0011 |
|
OTHERS |
-0.00206 |
0.025 |
-0.082 |
0.9350 |
Table 5 looks similar to table 4 but presents the intercept of the real model and the intercept for the dispersion parameter. The dispersion parameter is indeed significant and thus signifies that there is overdispersion in the dependent variable. Also, the standard error of estimates in Table 5 is higher than the ones in table 4 indicating the impact of the Zero truncated negative Poisson regression model. Now the dependent variable accepts the count of road accidents as inputs and whose value cannot be zero but it can be overdispersed, hence, because of overdispersion, the estimation of the parameters is shown above from zero truncated negative Poisson regression model to correct the model estimated in Eq. (15).
From Table 5, it reveals that most of all the stimulus variables are positive except few explanatory variables such as MDV (Mechanical deficient vehicle), SOS (Sleeping while on steering), PWR (poor weather condition ), DAD (Driving under Alcohol or drug influence), FTQ Driver’s fatigue) and others such as the age of the driver, gender of the driver and drivers’ experience, category of the vehicle, etc. are negative and also not significant because their respective p_values are all greater than the observed level of significance or $\alpha=0.05$. The positivity of other explanatory variables indicated that such variables cause the log occurrence of road accidents in Nigeria. The deficiency of road traffic accidents is multi-factorial. These factors are broad categories into driver factors, vehicle factors, and roadway factors. For example, for driver’s factors - from the angle of speed violation factor, dangerous overtaking, use of phone while driving, wrongful overtaking, route violation, dangerous driving, road obstruction violation and sign light violation were all positive and significant, indicating that all these variables are all good predictors of road accidents and this conforms to references [22-24], Accidents can also occur as a result of a combination of these factors mentioned. Driver factors also solely contribute to about 41.39% (3444 out of 8319) of road bumps occurrence. It has been documented in literature reviews that driver factors in road bump occurrence are all factors related to drivers and other road users. This includes visual and auditory acuity, driver behavior, decision-making ability, and reaction speed. It is no doubt that Drug and alcohol usage while driving is a glaring predictor of a road crash, road crash injury, and death. Traveling too fast for persuading conditions or above the speed limit, speeding is also a driving factor that adds to a road traffic crash. The consequence of speed violation is that, the odds of being injured increases exponentially with speed faster than average speeds. The seriousness of the injury depends on the vehicle velocity change at congestion and transferring of kinetic energy. Now, motor vehicles travelling slower than average speed are similar at increased chances of road traffic crash, most require speed too fast in the circumstances.
Similarly, from the angle of vehicle factors such as brake failure, Tyre burst, and vehicle being overloaded; this variable is also significant and positive and it has a positive effect on the cause of road accidents. The increase in brake failure will lead to an increase in road accidents, as this is in no doubt [23]. Vehicle factors also solely contribute to about 18.02% (1499 out of 8319) of road accidents occurrence. Bun [22] documented that vehicle factors can be classified into vehicle maintenance and vehicle design. Some safety characteristics of motor like airbags and seatbelts are likely to minimize the chance of death and severe injuries all in turn for low road accidents. Lack or improper use of seat-belts and other safety constraints, e.g. (booster seats and child seats) are chance factors for the fatalities and wounds or injuries that can result from road crashes. In forward collisions involving occupants who are not restrained by seatbelts, the most common and most serious wounds or injuries are to the victim's head. Also, a constructed, well-designed, and maintained vehicle is less likely to be involved in accidents. Now if tires and brakes of the vehicle are good and the suspension is well adjusted, then the vehicle has the advantage of being more controllable in an emergency and hence, better furniture to avert crashes. Moreover, constant checking of expiration of motor tyres and replacement of motor tyres are highly better in reduction of road accidents.
Finally, from environmental factors such as poor weather considered in this research study, poor weather is negative and insignificant because its associated p_value (0.7496) is greater than the exact probability of value $\alpha=0.05$, hence indicating that poor weather does not affect or lead to the cause of road accident. Well, further studies prove has been justified that inadEq.uate visibility i.e., making it hard to see or detect vehicles and other road users is the best leading cause of road accidents. For example, in a motorized country like Nigeria, insufficient visibility plays a very critical key role in the following three types of accidents: — constant vehicle located beyond on the roadway or a moving motor running into the rear or beside of a slow moving car, at night-time; — rear-end collisions in fog; — angled collisions or head-on collisions in the daytime; at daytime and night. But in other middle-income and low-income countries, the situations of pedestrians and motors are not being properly transparent, this is continuously a dam and concern issue. In plenty of places, there are fewer roads with proper clarity and some may not even be lit. In supplement, it is common for huge numbers of vehicles and other bicycles to have no reflectors or no light and for road space to be distributed by slow-moving and fast-moving road users.
4.6.2 Model diagnostic or goodness of fit test
Similarly, the value of the deviance for the model estimated in section 6.6.1 was 0 and this value is less than the degree of freedom, hence we say that the model built explains all the variables identified in the model. The plot of fitted values against the residual obtained provides additional evidence that the model is accurate (Figure 3).
Figure 3. Model diagnosis - The plot of residuals against the fitted values, from Zero truncated negative Poisson regression model
Figure 4. Model diagnosis - The plot of residual against the fitted values, check for effect of extreme fitted values
Similarly, from Figure 3, most of the fitted values hover around the mean (value =0), hence the model fitted is a good model and these explicitly capture the structure of the data. As seen from the results, some of the fitted values are extremely away from the mean, but let's see how much influence they have. To see their effect, we need to fit the lines and this is done by using quantile regression and the lines are the 25th (twenty-fifth), 50th, and 75th percentile. So, Figure 4 describes the effects of extreme fitted values.
As we can see from Figure 4, similarly, the spread of fitted values is most concentrated at the lower levels rather than the middle levels. Hence, having a lower effect on the residual signifies that the model is appropriate to capture overdispersion.
The main objective of the study was to develop a statistical method of predicting factors that lead to road accidents in Nigeria. A cross-sectional study design was adopted and secondary data from the National Bureau of Statistics (2020) was used within a sample period of the 1st quarter of 2006 to the 2nd quarter of 2020. The statistical method adopted was the extension of the Poisson regression model such as the zero truncated Poisson regression model to truncate zeros that occurred in the points of the dependent variable (number of road accidents) and a further Poisson regression model was proposed to correct for overdispersion and which is the Zero truncated negative Poisson regression model (ZTNPRM). From the ZTNPRM, the model indicates that human errors contribute to a large proportion of 41.4% (3444/8319) in leading to road accidents. Such human factors are the greatest cause of road accidents and such factors are; the use of phones while driving (2.224,0.0262), dangerous overtaking (1.141,0.02538), wrongfully overtaking (6.001,1.96e-09), dangerous driving (6.886,5.74e-12), road obstruction violation (1.622,0.01048), route violation (2.401,0.0164) and sign light indicator violations (3.253,0.0011) as these variables were statistically significant and positively related in predicting the occurrence of road accidents in Nigeria. Other vehicular factors were also positive and statistically significant and such variables were Tyre burst (7.252,4.09e-13), brake failures (4.703,2.56e-06).
The goodness of fit test was carried out on the proposed model to fit count data used and the result showed that there is a presence of overdispersion, the estimated residual deviance was lower than the corresponding degree of freedoms, hence indicating that the model used deeply explains the structure of the contributing factors in question, and similarly, overdispersion was present and statistically significant, hence the model of Zero truncated Poisson regression model was improved or corrected by Zero truncated negative Poisson regression model. Finally, the study recommends that Nigerian car users strictly follow all rules and regulations associated with safe driving, such as not drinking, not breaking speed limits, not overtaking unnecessarily or incorrectly when such is not needed, etc. All the factors identified by this model that cause road accidents predicted low road accidents as a result. Before starting a trip, vehicle factors can be improved by testing the tire strength, and all brake systems should be fully functional and in good condition.
The authors hereby acknowledge Covenant University Centre for Research, Innovation and Discovery (CUCRID) for their support toward the completion of this research.
Appenidix A
Cumulative of cross-sectional data of factors leading to road accidents against states in Nigeria from time period of 1st quarter 2006 to 2nd quarter 2020
|
State |
RTA |
SPV |
UPWD |
TBT |
MDV |
BFL |
OVL |
DOT |
WOT |
|
Abia |
290 |
140 |
0 |
56 |
0 |
52 |
0 |
0 |
14 |
|
Adamawa |
686 |
462 |
0 |
0 |
0 |
0 |
0 |
0 |
70 |
|
Akwa -Ibom |
224 |
70 |
0 |
0 |
0 |
42 |
0 |
0 |
14 |
|
Anambra |
611 |
280 |
0 |
28 |
14 |
136 |
0 |
0 |
42 |
|
Bauchi |
250 |
98 |
2 |
0 |
3 |
27 |
3 |
3 |
13 |
|
Bayelsa |
240 |
46 |
1 |
0 |
7 |
67 |
6 |
6 |
24 |
|
Benue |
269 |
6 |
3 |
34 |
6 |
24 |
2 |
4 |
16 |
|
Borno |
232 |
57 |
1 |
56 |
3 |
24 |
1 |
2 |
17 |
|
Cross River |
366 |
89 |
1 |
35 |
4 |
52 |
5 |
2 |
21 |
|
Delta |
208 |
34 |
0 |
78 |
6 |
0 |
2 |
1 |
34 |
|
Ebonyi |
154 |
26 |
0 |
15 |
5 |
0 |
1 |
16 |
4 |
|
Edo |
192 |
38 |
0 |
57 |
0 |
0 |
0 |
7 |
34 |
|
Ekiti |
246 |
59 |
0 |
24 |
0 |
34 |
0 |
8 |
45 |
|
Enugu |
172 |
43 |
0 |
25 |
0 |
12 |
0 |
3 |
13 |
|
FCT |
233 |
67 |
0 |
14 |
0 |
10 |
0 |
7 |
16 |
|
Gombe |
176 |
34 |
0 |
17 |
3 |
8 |
0 |
8 |
17 |
|
Imo |
183 |
37 |
0 |
23 |
3 |
4 |
0 |
1 |
18 |
|
Jigawa |
243 |
79 |
2 |
46 |
7 |
6 |
0 |
5 |
21 |
|
Kaduna |
239 |
24 |
4 |
12 |
7 |
34 |
0 |
7 |
45 |
|
Kano |
137 |
11 |
1 |
0 |
4 |
12 |
0 |
10 |
24 |
|
Kastina |
197 |
18 |
1 |
0 |
5 |
1 |
4 |
3 |
37 |
|
Kebbi |
256 |
45 |
1 |
0 |
8 |
44 |
2 |
6 |
43 |
|
Kogi |
250 |
25 |
1 |
0 |
5 |
23 |
5 |
5 |
67 |
|
Kwara |
224 |
28 |
1 |
0 |
3 |
2 |
7 |
3 |
63 |
|
Lagos |
304 |
38 |
14 |
13 |
17 |
41 |
1 |
8 |
61 |
|
Nasarawa |
188 |
39 |
1 |
4 |
4 |
5 |
1 |
6 |
24 |
|
Niger |
143 |
44 |
0 |
7 |
5 |
4 |
0 |
9 |
5 |
|
Ogun |
167 |
28 |
0 |
23 |
7 |
13 |
0 |
2 |
13 |
|
Ondo |
165 |
25 |
1 |
24 |
8 |
21 |
0 |
3 |
17 |
|
Osun |
209 |
56 |
1 |
16 |
0 |
33 |
0 |
0 |
14 |
|
Oyo |
150 |
24 |
1 |
18 |
0 |
24 |
0 |
0 |
12 |
|
Plateau |
141 |
23 |
0 |
0 |
0 |
23 |
0 |
0 |
7 |
|
Rivers |
123 |
27 |
2 |
0 |
4 |
11 |
1 |
2 |
12 |
|
Sokoto |
102 |
15 |
2 |
0 |
6 |
0 |
9 |
4 |
14 |
|
Taraba |
124 |
23 |
1 |
4 |
4 |
5 |
2 |
3 |
21 |
|
Yobe |
92 |
16 |
0 |
2 |
4 |
4 |
4 |
2 |
2 |
|
Zamfara |
133 |
16 |
0 |
3 |
6 |
5 |
6 |
6 |
24 |
|
Total |
8319 |
2190 |
42 |
634 |
158 |
803 |
62 |
152 |
938 |
|
DGD |
BRD |
RTV |
OBS |
SOS |
DAD |
PWR |
FTQ |
SLV |
OTHERS |
|
0 |
0 |
28 |
0 |
0 |
0 |
0 |
0 |
0 |
0 |
|
14 |
0 |
0 |
140 |
0 |
0 |
0 |
0 |
0 |
0 |
|
84 |
14 |
0 |
0 |
0 |
0 |
0 |
0 |
0 |
0 |
|
28 |
56 |
12 |
5 |
2 |
3 |
0 |
1 |
3 |
1 |
|
78 |
12 |
6 |
3 |
1 |
0 |
1 |
0 |
0 |
0 |
|
35 |
37 |
3 |
1 |
1 |
0 |
0 |
0 |
6 |
0 |
|
57 |
48 |
4 |
20 |
1 |
0 |
0 |
2 |
42 |
0 |
|
48 |
16 |
2 |
0 |
0 |
0 |
0 |
3 |
2 |
0 |
|
87 |
18 |
7 |
0 |
9 |
1 |
0 |
3 |
32 |
0 |
|
36 |
12 |
3 |
0 |
0 |
0 |
0 |
2 |
0 |
0 |
|
64 |
19 |
4 |
0 |
0 |
0 |
0 |
0 |
0 |
0 |
|
48 |
6 |
2 |
0 |
0 |
0 |
0 |
0 |
0 |
0 |
|
54 |
17 |
1 |
0 |
0 |
3 |
0 |
0 |
0 |
1 |
|
27 |
22 |
9 |
0 |
0 |
4 |
0 |
2 |
12 |
0 |
|
45 |
20 |
4 |
0 |
0 |
2 |
0 |
5 |
43 |
0 |
|
38 |
34 |
3 |
3 |
3 |
0 |
1 |
7 |
0 |
0 |
|
43 |
47 |
3 |
2 |
2 |
0 |
0 |
0 |
0 |
0 |
|
27 |
43 |
3 |
4 |
0 |
0 |
0 |
0 |
0 |
0 |
|
78 |
12 |
4 |
6 |
5 |
0 |
1 |
0 |
0 |
0 |
|
46 |
15 |
7 |
2 |
3 |
1 |
1 |
0 |
0 |
0 |
|
69 |
23 |
3 |
1 |
4 |
0 |
0 |
2 |
26 |
0 |
|
70 |
10 |
4 |
7 |
2 |
0 |
0 |
0 |
13 |
1 |
|
56 |
33 |
6 |
6 |
4 |
0 |
0 |
0 |
14 |
0 |
|
69 |
37 |
2 |
3 |
3 |
2 |
1 |
0 |
0 |
0 |
|
66 |
18 |
7 |
4 |
2 |
2 |
0 |
0 |
12 |
0 |
|
69 |
25 |
2 |
2 |
1 |
4 |
0 |
0 |
1 |
0 |
|
46 |
16 |
3 |
3 |
1 |
0 |
0 |
0 |
0 |
0 |
|
37 |
39 |
4 |
0 |
0 |
0 |
1 |
0 |
0 |
0 |
|
39 |
24 |
3 |
0 |
0 |
0 |
0 |
0 |
0 |
0 |
|
45 |
37 |
2 |
2 |
0 |
0 |
0 |
0 |
0 |
3 |
|
23 |
36 |
5 |
3 |
0 |
1 |
0 |
3 |
0 |
0 |
|
16 |
46 |
2 |
2 |
3 |
0 |
0 |
4 |
15 |
0 |
|
26 |
24 |
1 |
0 |
2 |
0 |
1 |
2 |
8 |
0 |
|
18 |
22 |
5 |
0 |
2 |
0 |
0 |
2 |
3 |
0 |
|
35 |
12 |
4 |
4 |
2 |
0 |
0 |
2 |
2 |
0 |
|
26 |
8 |
2 |
4 |
6 |
8 |
1 |
0 |
3 |
0 |
|
28 |
22 |
3 |
3 |
2 |
0 |
1 |
1 |
7 |
0 |
|
1675 |
880 |
163 |
230 |
61 |
31 |
9 |
41 |
244 |
6 |
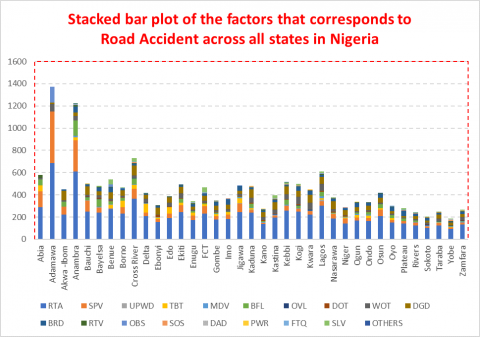
Appenidix B
Distribution of Road accidents, logarithm scaled
[1] Carrillo-Lopez, L.M., Garcia-Galicia, I.A., Tirado-Gallegos, J.M., Sanchez-Vega, R., Huerta-Jimenez, M., Ashokkumar, M., Alarcon-Rojo, A.D. (2021). Recent advances in the application of ultrasound in dairy products: Effect on functional, physical, chemical, microbiological and sensory properties. Ultrasonics Sonochemistry, 73: 105467. https://doi.org/10.1016/j.ultsonch.2021.105467
[2] Ma, T., Peden, A.E., Peden, M., et al. (2021). Out of the silos: Embedding injury prevention into the Sustainable Development Goals. Injury Prevention, 27(2): 166-171. http://dx.doi.org/10.1136/injuryprev-2020-043850
[3] World Health Organization. (2004). World report on road traffic injury prevention: summary. In World Report on Road Traffic Injury Prevention: Summary (pp. ix-52).
[4] Jha, N., Srinivasa, D.K., Roy, G., Jagdish, S., Minocha, R.K. (2004). Epidemiological study of road traffic accident cases: A study from South India. Indian J Community Med, 29(1): 20-24.
[5] CBN. (2000). Central Bank of Nigeria bulletin. Annual Statistical Bulletin - Central Bank of Nigeria https://www.cbn.gov.ng, accessed on 12 June 2022.
[6] Saliu, H.A., Ogunsanya, A.A., Olujide, J.O., Olaniyi, J.O. (2006). Democracy and Development in Nigeria: Economic and Environmental Issues. Concept Publications Limited, Lagos, Nigeria. https://books.google.com.ng/books/about/Democracy_and_Development_in_Nigeria_Eco.html?id=GeAjAQAAIAAJ&redir_esc=y.
[7] CBN. (2010). Central Bank of Nigeria bulletin. Annual Statistical Bulletin - Central Bank of Nigeria https://www.cbn.gov.ng, accessed on 12 June 2022.
[8] Jelalian, E., Alday, S., Spirito, A., Rasile, D., Nobile, C. (2000). Adolescent motor vehicle crashes: The relationship between behavioral factors and self-reported injury. Journal of Adolescent Health, 27(2): 84-93. http://dx.doi.org/10.1016/S1054-139X(00)00098-7
[9] Oginni, F.O. (2008). Causes of Road Traffic Accidents in Developing Countries. Traffic Accidents: Causes and Outcomes, 225. NOVA Science Publishers.
[10] Claret, P.L., Del Castillo, J.L., Moleón, J.J., Cavanillas, A.B., Martín, M.G., Vargas, R.G. (2002). Influence of driver nationality on the risk of causing vehicle collisions in Spain. Journal of Epidemiology & Community Health, 56(5): 394-398. http://dx.doi.org/10.1136/jech.56.5.394
[11] Buliaminu K., Peter K.O., Ayodele S.L. (2012). Modelling fatalities of road accidents in Nigeria. Research in Logistics and Production, 2(3): 259-271.
[12] Haque, M.S. (1999). The fate of sustainable development under neo-liberal regimes in developing countries. International Political Science Review, 20(2): 197-218. http://dx.doi.org/10.1177/0192512199202005
[13] Nantulya, V.M., Reich, M.R. (2002). The neglected epidemic: road traffic injuries in developing countries. BMJ, 324(7346): 1139-1141. http://dx.doi.org/10.1136/bmj.324.7346.1139
[14] Eke, N., Etebu, E.N., Nwosu, S.O. (2000). Road traffic accident mortalities in Port Harcourt, Nigeria. Anil Aggrawal's Internet Journal of Forensic Medicine and Toxicology, 1(2).
[15] Ohakwe, J., Iwueze, I.S., Chikezie, D.C. (2011). Analysis of road traffic accidents in Nigeria: A case study of Obinze/Nekede/Iheagwa Road in Imo State, Southeastern, Nigeria. Asian Journal of Applied Sciences, 4(2): 166-175.
[16] Prayudyanto, M.N., Goeritno, A., Al Ikhsan, S.H., Taqwa, F.M.L. (2022). Designing a model of the early warning system on the road curvature to prevent the traffic accidents. International Journal of Safety and Security Engineering, 12(3): 291-298. https://doi.org/10.18280/ijsse.120303
[17] Odero, W. (1998). Alcohol-related road traffic injuries in Eldoret, Kenya. East African Medical Journal, 75(12): 708-711.
[18] Ezenwa, A.O. (1986). Trends and characteristics of road traffic accidents in Nigeria. Journal of Royal Society of Health, 106(1): 27-29. https://doi.org/10.1177/146642408610600111
[19] Thanni, L.O.A., Kehinde, O.A. (2006). Trauma at a Nigerian teaching hospital: pattern and documentation of presentation. African Health Sciences, 6(2): 104-107.
[20] Adedotun A.F., Olanrewaju, K.O., Abass, I.T., Olumide S.A., Oluwole, A.O., Onuche G.O. (2022). Bayesian spatial analysis of socio-demographic factors influencing smoking, use of hard drugs and its residual geographic variation among teenagers of reproductive age in Nigeria. International Journal of Sustainable Development and Planning, 17(1): 277-288. https://doi.org/10.18280/ijsdp.170128
[21] NBS. (2020). National Bureau of Statistics Report 2020. 2020 - National Bureau of Statistics (nbs.gov.sc), accessed on 12 June 2022.
[22] Bun, E. (2012). Road traffic accidents in Nigeria: A publichealth problem. Afrimedic Journal, 3(2): 34-35.
[23] Sagamiko, T., Mbare, N. (2021). Modelling road traffic accidents counts in tanzania: A poisson regression approach. Tanzania Journal of Science, 47(1): 308-314.
[24] Oluwaseyi, J.A. Gbadamosi, K.T. (2017). Road Traffic Accident situation and vehicular Growth in Nigeria. The International Journal of Transport and Logistic, 17(42): 40-49.