Rishi Raghu | Vijayashree Jayaraman* | Jayashree Jayaraman | Sai Surya Varshith Nukala | Vicente García Díaz
© 2022 IIETA. This article is published by IIETA and is licensed under the CC BY 4.0 license (http://creativecommons.org/licenses/by/4.0/).
OPEN ACCESS
Most chronic diseases and health disorders at early stages are either asymptomatic or have long latency periods, especially among the older age groups. This eventually becomes difficult to handle at later stages and in some cases even becomes the cause of death. Even though cloud-based smart systems have delivered promising results in the field of healthcare monitoring, due to high latency, network congestion, poor user control, etc. smart systems fail to meet the required needs. Especially in old-age homes, where 24/7 service is required, healthcare facilities need robust, prompt, and real-time smart systems. This paper proposes a multi-layered cloud-edge architecture for old-age homes that operates on smart systems to detect anomalies, predict future risks, and process data across the doctor, patient, and the cloud in real-time. The device operates mostly on the edge layers to process patient information using neural networks and send alerts to the end-user based on predictions and anomalies before sending the aggregated data to the cloud. The proposed framework includes smart devices which are facilitated with responsive user interfaces which keep the patients and doctors in complete control of the smart system while maintaining efficient data communication and security. This paper also compares the latency delay between IoT devices and cloud, also between IoT devices and edge devices.
cloud, IoT, edge computing, smart system
The majority of countries are experiencing an increase in the cost of long-term care and health care, as well as a decline in the number of health professionals. Throughout the world, healthcare systems are confronted with persistent challenges that impair the delivery of care pertaining to healthcare [1, 2]. The term "old age" is frequently used to refer to increased demand for social and medical assistance, as well as for housing and residential care, as well as changes in the family structure and communal existence. The existence of comprehensive and accurate Information is critical for determining a person's health status. Seniors, enhancing their health-related quality of life, health in intelligent environments, monitoring systems become a necessity alternative to conventional healthcare [3]. The current proliferation of data and communication technologies, as well as embedded systems, is resulting in the development of a novel technology dubbed the Internet of Things.
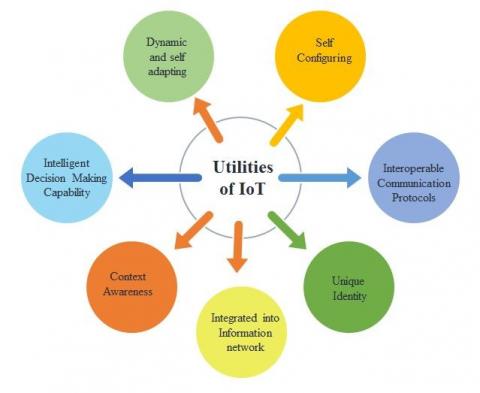
IoT enables communication between users and physical objects, as well as between virtual platforms [4-6]. Numerous domains are utilising the Internet of Things model as the primary data acquisition process in the modern environment. These domains are considered to be a part of the developing digital community [7-9]. Due to the rapid development of IoT-centric systems, several viable studies have been conducted on medicinal and sensing components, as well as smart healthcare. Due to rising healthcare costs and the prevalence of numerous ailments, it is necessary to transition healthcare from a hospital based model to a patient centered one [10-13]. On the basis of disease management and personal well-being, a technique was presented that utilises the autonomous sensing capabilities of IoT devices to forecast the probability of severe disease [14]. The various utilities of IoT are shown in Figure 1.
Figure 1. Utilities of IoT
1.1 Shift from cloud to edge computing
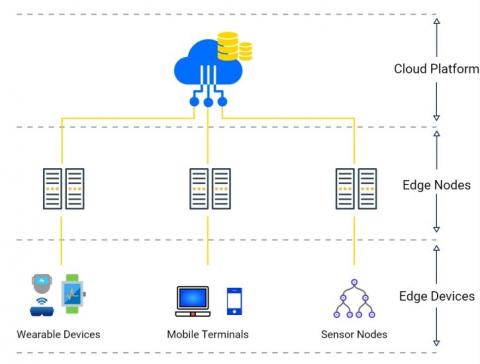
Edge computing is a term that refers to computing as a distributed paradigm. It enables data storage and compute power to be brought closer to the device or data source where they are most needed [15-17]. The cloud does not process data and filters it through distant data centres; rather, the cloud comes to you. This distribution avoids lag and conserves bandwidth [18]. It processes the data close to the data source rather than in a centralised cloud [19-21]. It acts as a bridge between IoT devices and the cloud as shown in Figure 2.
Figure 2. Edge-cloud architecture
The accessibility of edge devices alleviates the computational load on remote data centers. There will be a decrease in latency and an increase in average response time [22]. Edge computing is distinct from cloud computing for two primary reasons: time sensitive and data volume. The speed at which a decision must be made precludes the lag that normally occurs as data is collected by an edge device, transferred unmodified to a central cloud, and then processed before being returned to the edge device for execution. The huge amount of data collected is too large to send to a cloud in its original state.
1.2 Significance of edge computing in the IoT
Edge computing is supposed to act as the strategic brain of the Internet of Things. At the moment, the primary research focus is on determining the role of edge computing in IoT [23]. Edge computing can be used to reduce the total quantity of data transferred to the cloud and the latency.
Data Acquisition: Sensors are edge devices, which collect and analyse streaming data in real time, as well as take immediate actions or process the data. As a result, we can increase productivity and rapidly prevent product defects [24, 25].
Inferential Controls: Any edge device must include inferential controls. They refer to a device's ability to accurately interpret objects in its environment. Additionally, these controls interact with an infrastructure that is managed by another entity [26, 27]. However, bringing inferential capability to edge devices is challenging due to the fact that it is context-dependent.
Data Analysis: Real-time data analysis is enabled by edge computing. Analyzing data at the point of collection can help reduce the latency associated with the generation of information from the collected data [28, 29]. As a result, edge devices can collect and analyse data from nearby devices, enabling decision makers to deliver actionable insights more quickly than ever before. Additionally, because data is analyzed locally, edge devices can help reduce network bandwidth and costs.
Decision Making: After analyzing data locally, edge devices must make critical strategic decisions [30, 31]. In real-time processing, the response time would be high if data is sent to the cloud for processing and decision-making. So the he data needs to be analyzed locally on any edge device.
Enhanced Data Security: When data is transferred to another country for processing, data insecurity increases [32]. In edge computing, data gathering and analysis are carried out locally. There is no extensive routing involved, making it simple to identify any suspicious activity [32]. Implementing necessary actions prior to a security breach becomes simple as well.
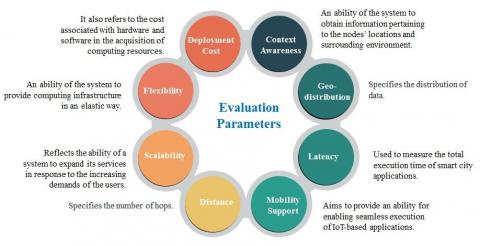
In order to evaluate different computing paradigms, different evaluation parameters were considered [33-35]. Evaluation parameters and their description is shown in Figure 3.
Figure 3. Evaluation parameters
Comparison between cloud and edge computing [36, 37] based on various evaluation parameters is described in Table 1.
Table 1. Comparison between cloud and edge computing
|
Evaluation Parameters |
Cloud Computing |
Edge Computing |
|
Context Awareness |
No |
High |
|
Geo-distribution |
Centralized |
Distributed |
|
Latency |
High |
Low |
|
Mobility Support |
No/limited |
Yes |
|
Distance |
Multi hop |
Single hop |
|
Scalability |
Yes |
Yes |
|
Flexibility |
Yes |
Yes |
|
Deployment Cost |
High |
High |
The rest of the paper is organized as follows: Section 2 summarizes the related work. Section 2 is particularly focused on health monitoring using smart devices. Edge computing for enhanced interactive systems is described Sections 3. Section 4 described the need for edge computing in interactive systems. Section 5 describes the proposed architecture. Section 6 describes about the process flow in the architecture. Section 7 and 8 illustrates the smart watch interface design and cloud dashboard. Result and analysis are given in Section 9.
Recent advances in sensor and wireless technologies have paved the way for the development of for monitoring elderly people. Wan et.al, describes numerous studies have been conducted on daily activity reminder applications for the elderly, dementia, and Alzheimer's patients. Shu et.al explains a system for monitoring sleep quality in real time, as determined by breathing rate, bed position, and heart rate. The generated data is wirelessly communicated to a cloud platform, analysed, and compared to previous periods. A ZigBee-based intelligent home application is being developed to monitor the activity of dementia elderly people [38, 39].
A smart home application devoted to sleep, named "Smart Bedroom," assists healthcare solution designers and developers in defining technology-enabled futuristic healthcare strategies for serving and improving the quality of life of elderly people [40, 41]. Another similar work describes an IoT based pillow for monitoring sleep quality [42, 43]. This fascinating application demonstrates how any object in the home can be made "smart" and used to provide data to the patient in a non-intrusive manner [44].
Our smart watch monitors some basic vitals of our users which are very essential to analyze user’s health in real-time and alert them if there are any abnormalities. There are seven vitals which our smart watch monitors they are temperature, ECG, SpO2 Levels, Blood Pressure, Glucose, Hemoglobin Levels, Red Blood Cells Count. If there are any abnormalities in the above parameters the alerts and data will be seen by the user and also sent to concerned doctor and the nurse who is taking of the user at the old age home
3.1 Temperature monitoring
Temperature monitoring involves the continuous monitoring of human body temperature. Human body regulates its core internal temperature itself which is also called as thermoregulation. Thermoregulation of human body plays a very important role in proper working of enzymes which in turn are the reason for proper metabolisms in the human body. According to medical professional’s body temperature is basic information used to know the patient’s health condition. For example, if user is infected with any diseases like COVID-19, dengue, malaria etc. first and far most abnormality in the body temperature of the user is seen.
In our smart watch we are using skin temperature sensor to know the patient’s body temperature. Resistance Temperature Detectors, Thermocouples, Thermistors, Temperature sensor integrated these are the different types of contact-based temperature sensors which are widely used in the market nowadays:
3.2 Spo2 levels monitoring
Spo2 level is a measure of amount of oxygen in the blood. It is also called as oxygen saturation levels. Many diseases like COVID-19, anemia, heart diseases, pulmonary embolism, asthma etc. affect Spo2 levels of humans. Abnormalities in Spo2 levels may also lead to Hypoxemia, Hypoxia etc. Hence, it’s very essential to measure Spo2 levels of the user.
Our Smart watch uses photo plethysmography (PPG) technique for pulse oximetry where we can know the oxygen levels in the user’s blood along with that we can even see the pulse of the user. PPG sensors emit infrared light using LED which penetrates into the skin and blood vessels and helps to detect volumetric changes in blood. Since, the pulse rate results here are less accurate we are using ECG sensor for heart rhythm and heart rate monitoring. Hence, if there are any abnormalities user, doctor and nurse get notified.
3.3 Electrocardiogram (ECG or EKG) monitoring
We are using Electrical heart rate sensor for ECG which helps us to know the heart rhythm, it’s electrical activity and very accurate heart rate. Along with these we can even see cardiogram in our watch’s display. This sensor uses PPG technique by sending green light and infrared light, and measures the amount of light absorbed by the blood. ECG sensor measures electrical signals in the user’s blood in order to measure heart rate and helps us to know the timing and strength of the heart rate. According to medicine there are great advantages in monitoring heart rate of a patient. Because many diseases like arrhythmias, Aorta disease and Marfan syndrome, Coronary artery diseases etc. affect the heart rate. We can even observe heart rate abnormalities in people who are affected by COVID-19. ECG also helps if the user had met with any accidents like road accidents or may be accidents in washrooms like getting slipped and fell on the floor. So, ECG sensor in our smart watch monitors user’s heart rate continuously and alerts user, and also concerned nurse and doctor.
3.4 Blood pressure monitoring
Blood pressure is the pressure of blood against the walls of our arteries. There are two types of blood pressure Systolic blood pressure and Diastolic blood pressure. Systolic blood pressure is pressure of blood exerted on the walls of arteries when the heart contracts and pumps blood into the arteries. Diastolic Blood pressure is pressure of blood exerted on the walls of arteries in between the heart beats. Abnormalities in blood pressure may lead to vomiting, dizziness, hypertension and sometimes this may also lead to some dangerous kidney problems. We use blood pressure monitoring sensors in our smart watch to know the systolic and diastolic blood pressures, and if there are any abnormalities notifications will be given to user, and concerned doctor and nurse.
3.5 Glucose monitoring
Nowadays technology has been improving a lot and non-invasive methods were introduced to monitor glucose levels in our blood. We use molecular spectroscopy to know the glucose levels in the blood. Monitoring glucose levels of the users is very important because abnormalities in the glucose may lead to high or low sugar levels, high sugar levels may lead to diabetes. Sometimes High sugar levels may also damage blood vessels and nerves that control our heart. Hence, blood glucose levels monitoring is required so that if there are any abnormalities necessary steps would be taken like if blood sugar levels are high proper diet should be maintained to bring it normal levels. People who are taking medication for diabetes sometimes uses insulin, at some point their blood sugar gets very low patient may lose consciousness at that point our smart may be a life saver by alerting the concerned help and the doctor.
3.6 Haemoglobin levels monitoring
Haemoglobin level is the amount of Oxygen carrying protein molecules present in red blood cells. Abnormal haemoglobin levels indicate many health conditions like Polycythaemia, emphysema, kidney tumours, Dehydration, Hypoxia etc. In our smart watch we are using the sensor that works on Occlusion spectroscopy to know the haemoglobin levels in the blood.
3.7 Red blood cells count monitoring
Red blood cell count lets us know the count of red blood cell present in our body. Its units are millions per cubic millimetre. Abnormalities in Red blood cells (RBCs) may lead to symptoms such as fatigue, shortness of breath, joint pain weakness, increased heart rate etc. We are using photo plethysmography technique to monitor the RBC count. If there are any abnormalities our smart watch gives alerts to the user, nurse and concerned doctor.
IoT acts as a network that connects physical devices, sensors, automobiles, electronic appliances in one closed circle embedded with software technologies, IoT devices usually collect and exchange data, but sometimes go even beyond the local network to include inter-layer communications and networking. Such as communicating between cloud and IoT devices, IoT gathers data and shares it with the cloud where all the data is processed and available for accessibility. However, in highly complex interactive systems such as health monitoring where the patient and doctor simultaneously access data and communicate with each other. Due to latency and privacy issues as discussed earlier, simply having a cloud-IoT interface would not be sufficient to handle such an enhanced system.
Edge computing overcomes this, bringing the processing directly at the source enables users to directly communicate with the IoT device to get real-time results. In our proposed work many individual IoT devices would be used simultaneously on the edge layer to gather, analyze, and process data based on user inputs. This leads to building a huge edge network where patients and doctors at the old age homes interact with the devices and each other without involving the cloud. Managing a healthcare system at an old age home involves a greater probability of emergencies, which is why the system needs to be extremely prompt in handling requests and communicating with layers. All the monitored data is pre-processed so that concise and summarised reports of the patient can be sent to the cloud. Once all the data is aggregated and filtered for the cloud, it enables users to interact with the cloud using edge layers.
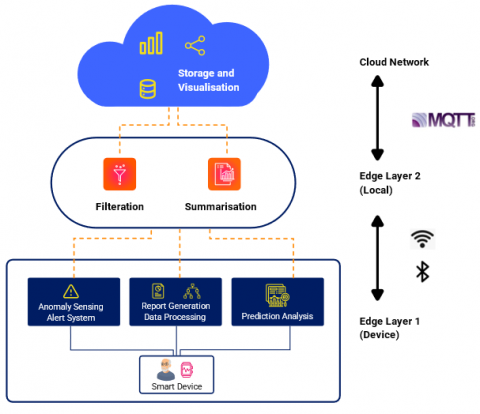
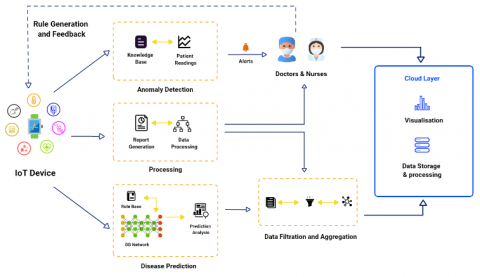
Our goal is to create an architecture in which data is processed seamlessly at the source and factors such as low latency and compromised security is not an issue when users are operating with the IoT devices. Proposed architecture is shown in Figure 4.
Figure 4. Proposed architecture
The proposed architecture comprises primarily of 3 layers: Edge layer1, Edge layer2 and cloud network.
Edge Layer 1
The edge layer 1 is the building layer of our architecture; it involves all the necessary processing done on the IoT device along with the IoT device (Smart-watch). The smart watch is here acts as the IoT device since it consists of various sensors which are responsible for gathering all the necessary data from the individual who’s wearing it. All the data gathered is processed and analyzed on this edge layer directly on the smart watch. All the sensors work together for 3 main purposes: Anomaly sensing, data processing, and prediction. Based on the rules and severity, anomalies are detected and respective alerts are sent to the doctor or nurse assigned to that individual. Necessary feedback from the doctor is sent back directly to the patient. The data is analyzed and used for disease prediction, based on which the smart watch gives out suggestions to the patient. Here to predict the disease and give out suggestions we use a Deep Belief Network (DBN). The structure of DBN includes 2 layers with the visible layer and the hidden layer; the nodes between the layers are fully connected, but the nodes within the same layer are not. DBN can select the network depth to improve the prediction analysis ability of various diseases associated with the model. A report of all the data is sent to the doctor or nurse for further evaluation the communication protocols used to transfer data from edge layer 1 to the doctors are Z-Wave, Bluetooth, Lora, Siemens S7.
Edge Layer 2
The Edge layer works on a local network where data comes from the IoT device using Bluetooth, Wi-Fi. This layer is responsible for filtering and aggregating the incoming data and preparing it to be sent to the cloud. Data is temporarily stored on this layer, with the help of clustering algorithms this aggregated data is sent to the cloud layer for further analyzing and visualization. The edge layer 2 acts as an interface between the first layer and the cloud.
Cloud Network
The processed data from both the edge layers are then sent to the cloud platform. Here all the data in the cloud platform gets analyzed using neural network algorithms and is stored for other users to access at any point in time. Finally, doctors can receive a detailed report of all the people in the old age home, all the predictions and analyzed data is presented to the doctor in various graphical representations. This is done via various data visualization techniques from which patients and doctors can both get an overview of the health.
The proposed architecture uses different protocols at each layer. We use Bluetooth LE and LoRa protocol to communicate between the edge layers (Edge layer 1 and Edge Layer 2). For sending the summarized and filtered date to the cloud we use the MQTT protocol.
The process flow of our architecture consists of various blocks which communicate with each other to build an efficient and enhanced health care monitoring system for old age homes. The major blocks in the process flow are shown in Figure 5.
IoT Device (Smart watch): The smart watch is at the heart of the entire system and is a major part of the Edge layer 1(device). It not only acts as an IoT device to gather all the patient data but also computes and communicates data with the various layers of our architecture. In the light of Covid-19, all our sensors present in the smart watch gather medical data of the patients non-invasively which makes the entire diagnosis contactless, thus making it safer. It comprises of 8 different sensors which gather necessary information about the patient (temperature, glucose levels, SPO2 levels, Heart Rate, RBC count, haemoglobin count, etc.). These parameters work with each other in 3 different module stages: Anomaly detection, data processing, and disease prediction. The watch is also responsible for communicating data across the layers. It works with different protocols to reach out to the various layers.
Anomaly Detection: Anomaly detection is the process of detecting and signalling unexpected patterns or trends in the health of a patient. Each patient has a smart watch, which is periodically diagnosing the health based on various parameters. If there is an unexpected turn in the trend of the observations the watch defines that as an anomaly. It does this using a stored knowledge base (observations and readings of previous patients with similar conditions). When there is an anomaly detected in the patient's readings the watch sends an alert both to the doctor and the patient. Using a Neural Network also recommends suggestions of how to normalize the readings and how to maintain and restore health. This knowledge base can be modified by the doctors and nurses, enabling each device to give the best suggestion respective to their user. In case the severity is not high enough, and no alerts are generated the patient can manually send in alerts to the doctor.
Data Processing: Once all the data and readings are gathered, they are processed in the smart watch to generate periodic reports and make predictions based on the readings. The reports and alerts generated are directly sent to the doctor from edge layer 1. This processed data is also used for the second edge layer for further aggregation and filtration. Since all the data is directly processed on the edge layer, the entire process is extremely quick and seamless. In case of an emergency, the doctors and nurses won’t have to wait for the data to reach the cloud and can receive all the data while it is still being processed on the edge layer.
Figure 5. Process flow
Disease Prediction: This module is responsible for analysing all the captured and processed data to predict any possible diseases that might be indicated via the readings of the patient. The doctors or nurses can define a rule base from which the probability of a disease can be calculated. In our proposed architecture, this rule base works closely with a Deep Belief Network (DBN) to predict future risks. With DBN all the variables are stored in unsupervised networks. The data on these networks are trained with a specified rule base given by the doctor to predict the probability of that disease particularly occurring.
The idea is to prevent the disease in its latent stage before it gets severe. As soon as the DBN gives out a prediction or detects something abnormal, it gives out initial suggestions of how to start preventing the disease and at the same time, mentions it in the processed report which is intern sent to the doctor. Doctors can define a rule base once the data is available on the cloud or can even suggest medical assistance to that patient.
Data Filtration and Aggregation: After all these processes are finished on edge layer 1, data is transferred to edge layer 2 where data is aggregated and filtered out for storing in the cloud services. A summary of all the reports generated from layer 1 is divided into categories stored in clusters and sent to the cloud layer.
Cloud Network: The cloud layer comprises of neural networks, all the data from the edge layer 2 layer is sent and further processed here for future storage. Since the major processing is done on the edge nodes, only the summarised reports of the patients are sent to the cloud, thereby having a low latency rate. Data visualization techniques are used on the cloud layer to visualize all the summarised data in the form of charts and graphs. This makes it easier for doctors to go through the patients. Based on the aggregated results, doctors can define rules and assign them to a particular patient on the cloud dashboard.
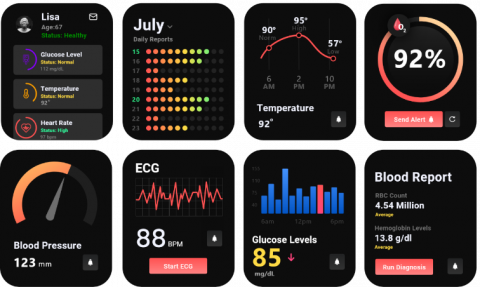
The interface of our proposed smart watch for healthcare systems and how patient records are viewed and operated on the watch is shown in Figure 6.
Figure 6. Smart watch interface design of data analysis and patient records
The first screen is the dashboard of the smart watch, where the user can check the status of their health along with a list of parameters on which it was calculated. Each of the screens represents the readings of the various sensors present in the smart watch. Vibrant data visualization techniques are used to give the user a better understanding of their health such as Calendar wise reports, progress bars, graphical representation, etc. The interface was designed with keeping elderly people at priority; manual alert system gives out an alert to the respective doctor regarding that reading. Smart watch interface design for anomaly detection, prediction analysis, and alerts is shown in Figure 7.
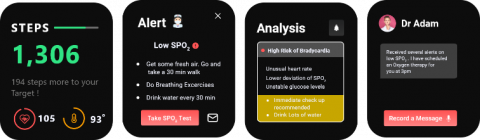
Figure 7. Smart watch interface design for anomaly detection, prediction analysis, and alerts
Based on the patient records, doctors and nurses can set a rule base for the patient. According to the defined rule base the watch will give out daily reminders, progress status and suggestions to meet the conditions of the rule base. On anomaly detection the user gets an alert on their watch regarding the anomaly as well as tips to regulate the reading, the user is also given a choice to run required tests at any point of day. Based on the results of the diagnosis the watch will predict the risk of having a particular disease and suggest necessary remedies to prevent the disease form occurring. Also the alerts and the reports would be sent to the patient’s respective doctor/nurse. Since this would take place directly on the edge layer all of the requests and processing happens as the user is interacting with device with minimal latency. If the user wishes he/she can directly communicate with a doctor via the smart watch.
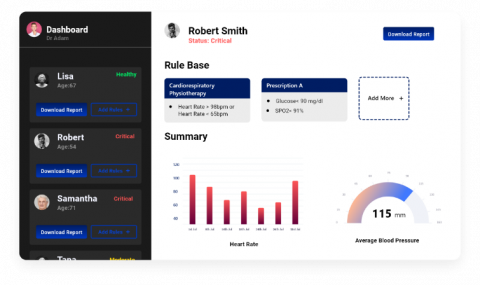
The dashboard interface is directly connected to the cloud. All the aggregated and filtered data from the edge layer 2 is sent to the cloud which is accessible through the dashboard shown in Figure 8.
Figure 8. Cloud dashboard interface
It’s extremely important for doctors to have access to this page. Here the doctor can get view of all the patients under him and can check their records and progress. Aggregated data is shown in the form of graphical representations and reports which can be downloaded by the doctor. Apart from this the nurse/doctor can choose to define rules for a particular patient and assign prescriptions which will automatically be fed in the smart watch.
Since all the processing of data is done on the smart watch, all patient-specific rules generated by the doctors and nurses are directly sent on the watch, based on which the watch sends necessary alerts and reports to the edge and cloud layers. The tests were made on 2 parameters: (i) ECG and (ii) SPO2 levels. As mentioned above, ECG and SPO2 levels were calculated using photo plethysmography (PPG), by passing infrared rays through the wrist, and on basis of how much light the blood absorbs, the values were calculated. For SPO2 levels normal values range from 95 – 99% whereas for ECG the normal values range from 60 – 100 bpm. Any reading above the normal range is defined as an anomaly. Consequently, an alert is sent to the doctor regarding the anomaly.
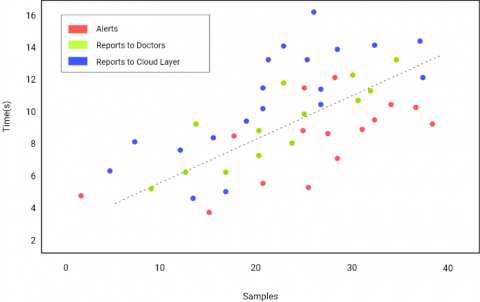
All the alerts are sent on the edge layer, which is why the latency is extremely low (25 - 30 ms). We tested the mechanism with large sample data and with heavier loads, which resulted in an average of 6 - 7 seconds for all the data to be transmitted on the edge layer. After all the tests are complete, reports are generated regarding the health of the patient. Due to heavier loads, this takes up an extra 1 – 2 seconds for transmission. The filtered and aggregated data which is supposed to be sent to the cloud has the most latency among all. The Figure 9 below shows the comparison of all the 3 types based on ECG and SPO2.
Figure 9. Graph depicting latency period of alerts and reports for ECG and SPO2 readings
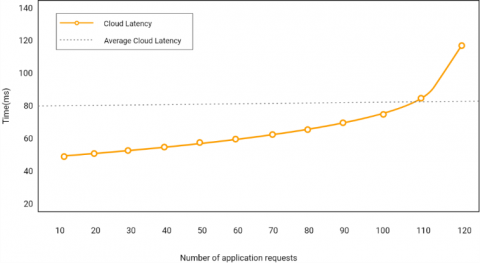
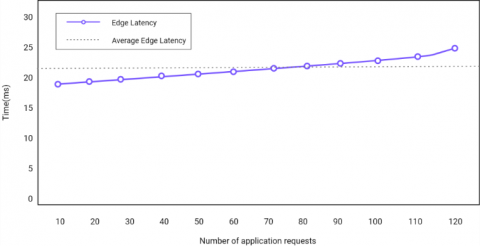
Comparing the results among cloud and edge layers brought promising outcomes. We had to test the latency IoT-Cloud communication versus Edge-Cloud communication. Using protocols like were MQTT, AMQP, CoAP, WebSocket, etc. delivered the best results. On the other hand, for communicating within the edge layers, the best results were given by Wi-Fi, Bluetooth, Zigbee, etc. To test out the communication latency, application requests were sent from each layer and respective round trip time (RTT) was calculated. It was noticed that as the frequency of application requests were increased so did the latency time for data transmission to the cloud layer. The average time was 80 ms and a sharp increase was noticed after more than 100 application requests were made. Whereas, while calculating for edge layers a steady latency was maintained with a gradual increase in latency as the requests increased. The average latency was a little over 20 ms which shows a drastic difference between transmission delay of cloud and edge layers as shown in Figures 10 and 11.
Figure 10. Graph depicting latency period between IoT-cloud layers
Figure 11. Graph depicting latency period between IoT-edge layers
Even though cloud-based smart systems have delivered promising results in the field of healthcare monitoring, due to high latency, network congestion, poor user control, etc. smart systems fail to meet the required needs. In order to overcome this issue this paper proposes a multi-layered cloud-edge architecture for old-age homes that operates on smart systems to detect anomalies, predict future risks, and process data across the doctor, patient, and the cloud in real-time. The proposed framework includes smart devices which are facilitated with responsive user interfaces which keep the patients and doctors in complete control of the smart system while maintaining efficient data communication and security. This paper also compares the latency delay between IoT devices and cloud, also between IoT devices and edge devices.
[1] Stavropoulos, T.G., Papastergiou, A., Mpaltadoros, L., Nikolopoulos, S., Kompatsiaris, I. (2020). IoT wearable sensors and devices in elderly care: A literature review. Sensors, 20(10): 2826. https://doi.org/10.3390/s20102826
[2] Basanta, H., Huang, Y.P., Lee, T.T. (2016). Intuitive IoT-based H2U healthcare system for elderly people. In 2016 IEEE 13th International Conference on Networking, Sensing, and Control (ICNSC), pp. 1-6. https://doi.org/10.1109/ICNSC.2016.7479018
[3] Das, R., Tuna, A., Demirel, S., Yurdakul, M.K. (2017). A survey on the internet of things solutions for the elderly and disabled: Applications, prospects, and challenges. International Journal of Computer Networks and Applications, 4(3): 1-9. https://doi.org/10.22247/ijcna/2017/49023
[4] Sokullu, R., Akkaş, M.A., Demir, E. (2020). IoT supported smart home for the elderly. Internet of Things, 11: 100239. https://doi.org/10.1016/j.iot.2020.100239
[5] Majumder, S., Aghayi, E., Noferesti, M., Memarzadeh-Tehran, H., Mondal, T., Pang, Z., Deen, M.J. (2017). Smart homes for elderly healthcare—Recent advances and research challenges. Sensors, 17(11): 2496. https://doi.org/10.3390/s17112496
[6] Azimi, I., Rahmani, A.M., Liljeberg, P., Tenhunen, H. (2017). Internet of things for remote elderly monitoring: A study from user-centered perspective. Journal of Ambient Intelligence and Humanized Computing, 8(2): 273-289. https://doi.org/10.1007/s12652-016-0387-y
[7] Satyanarayanan, M., Simoens, P., Xiao, Y., Pillai, P., Chen, Z., Ha, K., Amos, B. (2015). Edge analytics in the internet of things. IEEE Pervasive Computing, 14(2): 24-31. https://doi.org/10.1109/MPRV.2015.32
[8] Taleb, T., Dutta, S., Ksentini, A., Iqbal, M., Flinck, H. (2017). Mobile edge computing potential in making cities smarter. IEEE Communications Magazine, 55(3): 38-43. https://doi.org/10.1109/MCOM.2017.1600249CM
[9] Satyanarayanan, M. (2017). The emergence of edge computing. Computer, 50(1): 30-39. https://doi.org/10.1109/MC.2017.9
[10] Shu, M., Tang, M., Yang, M., Wei, N. (2017, July). The vital signs real-time monitoring system based on Internet of things. In 2017 4th International Conference on Information Science and Control Engineering (ICISCE), pp. 747-751. https://doi.org/10.1109/ICISCE.2017.160
[11] Wan, J., Gu, X., Chen, L., Wang, J. (2017). Internet of things for ambient assisted living: Challenges and future opportunities. In 2017 International conference on cyber-enabled distributed computing and knowledge discovery (CyberC), pp. 354-357. https://doi.org/10.1109/CyberC.2017.83
[12] de Morais, W.O., Wickström, N. (2013). A "Smart Bedroom" as an active database system. In 2013 9th International Conference on Intelligent Environments, pp. 250-253. https://doi.org/10.1109/IE.2013.29
[13] Al-Fuqaha, A., Guizani, M., Mohammadi, M., Aledhari, M., Ayyash, M. (2015). Internet of things: A survey on enabling technologies, protocols, and applications. IEEE Communications Surveys & Tutorials, 17(4): 2347-2376. https://doi.org/10.1109/COMST.2015.2444095
[14] Aloi, G., Caliciuri, G., Fortino, G., Gravina, R., Pace, P., Russo, W., Savaglio, C. (2017). Enabling IoT interoperability through opportunistic smartphone-based mobile gateways. Journal of Network and Computer Applications, 81: 74-84. https://doi.org/10.1016/j.jnca.2016.10.013
[15] Wagner, F., Basran, J., Dal Bello-Haas, V. (2012). A review of monitoring technology for use with older adults. Journal of Geriatric Physical Therapy, 35(1): 28-34. https://doi.org/10.1519/JPT.0b013e318224aa23
[16] Klaib, A.F., Alsrehin, N.O., Melhem, W.Y., Bashtawi, H.O. (2019). IoT smart home using eye tracking and voice interfaces for elderly and special needs people. J. Commun., 14(7): 614-621. https://doi.org/10.12720/jcm.14.7.614-621
[17] Lentzas, A., Vrakas, D. (2020). Non-intrusive human activity recognition and abnormal behavior detection on elderly people: A review. Artificial Intelligence Review, 53(3): 1975-2021. https://doi.org/10.1007/s10462-019-09724-5
[18] Sood, S.K., Mahajan, I. (2017). Wearable IoT sensor based healthcare system for identifying and controlling chikungunya virus. Computers in Industry, 91: 33-44. https://doi.org/10.1016/j.compind.2017.05.006
[19] Baig, M.M., Afifi, S., GholamHosseini, H., Mirza, F. (2019). A systematic review of wearable sensors and IoT-based monitoring applications for older adults–a focus on ageing population and independent living. Journal of Medical Systems, 43(8): 1-11. https://doi.org/10.1007/s10916-019-1365-7
[20] Ahmed, E., Ahmed, A., Yaqoob, I., Shuja, J., Gani, A., Imran, M., Shoaib, M. (2017). Bringing computation closer toward the user network: Is edge computing the solution? IEEE Communications Magazine, 55(11): 138-144. https://doi.org/10.1109/MCOM.2017.1700120
[21] Sun, X., Ansari, N. (2016). EdgeIoT: Mobile edge computing for the Internet of Things. IEEE Communications Magazine, 54(12): 22-29. https://doi.org/10.1109/MCOM.2016.1600492CM
[22] Cimarolli, V.R., Boerner, K., Brennan-Ing, M., Reinhardt, J.P., Horowitz, A. (2012). Challenges faced by older adults with vision loss: A qualitative study with implications for rehabilitation. Clinical Rehabilitation, 26(8): 748-757. https://doi.org/10.1177/0269215511429162
[23] Liu, C.H., Tu, J.F. (2020). Development of an IoT-based health promotion system for seniors. Sustainability, 12(21): 8946. https://doi.org/10.3390/su12218946
[24] Titi, S., Ben Elhadj, H., Chaari Fourati, L. (2020). A fuzzy-ontology based diabetes monitoring system using internet of things. In International Conference on Smart Homes and Health Telematics, pp. 287-295. https://doi.org/10.1007/978-3-030-51517-1_25
[25] Pal, D., Funilkul, S., Charoenkitkarn, N., Kanthamanon, P. (2018). Internet-of-things and smart homes for elderly healthcare: An end user perspective. IEEE Access, 6: 10483-10496. https://doi.org/10.1109/ACCESS.2018.2808472
[26] Jørgensen, T.S.H., Hansen, A.H., Sahlberg, M., Gislason, G.H., Torp-Pedersen, C., Andersson, C., Holm, E. (2015). Nationwide time trends and risk factors for in‐hospital falls‐related major injuries. International Journal of Clinical Practice, 69(6): 703-709. https://doi.org/10.1111/ijcp.12624
[27] Chandra, I., Sivakumar, N., Gokulnath, C.B., Parthasarathy, P. (2019). IoT based fall detection and ambient assisted system for the elderly. Cluster Computing, 22(1): 2517-2525. https://doi.org/10.1007/s10586-018-2329-2
[28] Onasanya, A., Elshakankiri, M. (2021). Smart integrated IoT healthcare system for cancer care. Wireless Networks, 27(6): 4297-4312. https://doi.org/10.1007/s11276-018-01932-1
[29] Farahani, B., Firouzi, F., Chang, V., Badaroglu, M., Constant, N., Mankodiya, K. (2018). Towards fog-driven IoT eHealth: Promises and challenges of IoT in medicine and healthcare. Future Generation Computer Systems, 78: 659-676. https://doi.org/10.1016/j.future.2017.04.036
[30] Kong, X., Meng, Z., Nojiri, N., Iwahori, Y., Meng, L., Tomiyama, H. (2019). A HOG-SVM based fall detection IoT system for elderly persons using deep sensor. Procedia Computer Science, 147: 276-282. https://doi.org/10.1016/j.procs.2019.01.264
[31] Yacchirema, D., de Puga, J.S., Palau, C., Esteve, M. (2018). Fall detection system for elderly people using IoT and big data. Procedia Computer Science, 130: 603-610. https://doi.org/10.1016/j.procs.2018.04.110
[32] Guo, H., Ren, J., Zhang, D., Zhang, Y., Hu, J. (2018). A scalable and manageable IoT architecture based on transparent computing. Journal of Parallel and Distributed Computing, 118: 5-13. https://doi.org/10.1016/j.jpdc.2017.07.003
[33] Yacchirema, D., de Puga, J.S., Palau, C., Esteve, M. (2019). Fall detection system for elderly people using IoT and ensemble machine learning algorithm. Personal and Ubiquitous Computing, 23(5): 801-817. https://doi.org/10.1007/s00779-018-01196-8
[34] Hu, B.D.C., Fahmi, H., Yuhao, L., Kiong, C.C., Harun, A. (2018). Internet of Things (IOT) monitoring system for elderly. In 2018 International Conference on Intelligent and Advanced System (ICIAS), pp. 1-6. https://doi.org/10.1109/ICIAS.2018.8540567
[35] Huang, X., Yu, R., Kang, J., He, Y., Zhang, Y. (2017). Exploring mobile edge computing for 5G-enabled software defined vehicular networks. IEEE Wireless Communications, 24(6): 55-63. https://doi.org/10.1109/MWC.2017.1600387
[36] Wang, Z., Yang, Z., Dong, T. (2017). A review of wearable technologies for elderly care that can accurately track indoor position, recognize physical activities and monitor vital signs in real time. Sensors, 17(2): 341. https://doi.org/10.3390/s17020341
[37] Mainetti, L., Patrono, L., Rametta, P. (2016). Capturing behavioral changes of elderly people through unobtruisive sensing technologies. In 2016 24th International Conference on Software, Telecommunications and Computer Networks (SoftCOM), pp. 1-3. https://doi.org/10.1109/SOFTCOM.2016.7772126
[38] Mighali, V., Patrono, L., Stefanizzi, M.L., Rodrigues, J.J., Solic, P. (2017). A smart remote elderly monitoring system based on IoT technologies. In 2017 Ninth International Conference on Ubiquitous and Future Networks (ICUFN), pp. 43-48. https://doi.org/10.1109/ICUFN.2017.7993745
[39] Pan, J., McElhannon, J. (2017). Future edge cloud and edge computing for internet of things applications. IEEE Internet of Things Journal, 5(1): 439-449. https://doi.org/10.1109/JIOT.2017.2767608
[40] Sodhro, A.H., Luo, Z., Sangaiah, A.K., Baik, S.W. (2019). Mobile edge computing based QoS optimization in medical healthcare applications. International Journal of Information Management, 45: 308-318. https://doi.org/10.1016/j.ijinfomgt.2018.08.004
[41] Tun, S.Y.Y., Madanian, S., Mirza, F. (2021). Internet of things (IoT) applications for elderly care: A reflective review. Aging Clinical and Experimental Research, 33(4): 855-867. https://doi.org/10.1007/s40520-020-01545-9
[42] Mainetti, L., Mighali, V., Patrono, L., Rametta, P., Stefanizzi, M.L. (2017). An IoT-aware system for elderly monitoring. In 2017 IEEE 3rd International Forum on Research and Technologies for Society and Industry (RTSI), pp. 1-5. https://doi.org/10.1109/RTSI.2017.8065906
[43] Patel, A., Shah, J. (2021). Smart ecosystem to facilitate the elderly in ambient assisted living. In Proceedings of International Conference on Recent Trends in Machine Learning, IoT, Smart Cities and Applications, pp. 501-510. https://doi.org/10.1007/978-981-15-7234-0_46
[44] Markakis, E.K., Politis, I., Lykourgiotis, A., Rebahi, Y., Mastorakis, G., Mavromoustakis, C.X., Pallis, E. (2017). Efficient next generation emergency communications over multi-access edge computing. IEEE Communications Magazine, 55(11): 92-97. https://doi.org/10.1109/MCOM.2017.1700345