Jiankun Gong* | Zhihao Lin | Shunheng Hua
© 2022 IIETA. This article is published by IIETA and is licensed under the CC BY 4.0 license (http://creativecommons.org/licenses/by/4.0/).
OPEN ACCESS
This paper aims to disclose the influence of different ambient pressures over the smoke flow and smoke ventilation in the shaft tunnel. For this purpose, numerical simulations were carried out on the shaft tunnel, using Fire Dynamics Simulator (FDS), a computational fluid dynamics (CFD) software package. The results show that: Under the same fire power, the smoke of tunnel fire spread faster and faster, with the falling ambient pressure. The longitudinal temperature curves of tunnel fire have basically the same features, at different ambient pressures. With the increase of ambient pressure, the longitudinal smoke temperature on the roof of the shaft tunnel gradually declines. The declining rate is positively correlated with the proximity to the fire source. Compared with that in small power fire, the roof temperature difference between low pressure and normal pressure is large in large power fire. The CO concentration in the shaft falls with the rise of ambient pressure. The smoke ventilation efficiency is better in the low-pressure environment, which facilitates the ventilation of fire smoke. The increase of fire power enhances the horizontal inertial force of smoke, and reduces the probability of plug holing. In addition, the ambient pressure has a small effect on the shaft smoke ventilation in small power fire.
ambient pressure, numerical simulation, shaft tunnel fire, shaft smoke ventilation
As urbanization picks up speed in China, more and more metro and highway tunnels are constructed to ease traffic congestion and resource shortages in urban areas. The boom of urban tunnel construction brings convenience to our lives and transportation, while posing great challenges to fire safety. The tunnels are often narrow, long, and relatively closed. Once a fire occurs, there would be a huge loss of life and property. Smoke and toxic gases, as the deadliest factors of fire, are responsible for 85% of the casualties in the fire [1, 2]. Natural smoke ventilation is widely favored by designers, because of its low cost in construction, operation, and maintenance phases. Therefore, the natural smoke ventilation via shaft becomes a popular option in tunnel construction.
In recent years, the research on the smoke movement features and smoke control of fire mainly focuses on the plains [3-7], i.e., considers the normal pressure environment. However, relatively few scholars have discussed the fire under low ambient pressure comprehensively [8-10]. Each year, new tunnels are completed in high-altitude regions, which feature low pressure and low oxygen content. Tunnel fire in these high-altitude tunnels would be even harder to prevent and put out. Therefore, it is of practical significance to study the flow features of the smoke in tunnel fire in different low-pressure environments.
This paper carries out numerical simulations of tunnel fire on Fire Dynamics Simulator (FDS), a computational fluid dynamics (CFD) software package. The combustion rate and temperature field distribution of shaft tunnel fire were tested under different pressures. On this basis, the authors discussed the influence of different ambient pressures on the smoke movement features and smoke control effect of tunnel fire. The research results provide a reference for the construction, fire prevention, and smoke control of high-altitude tunnels in low-pressure environments.
2.1 Model construction
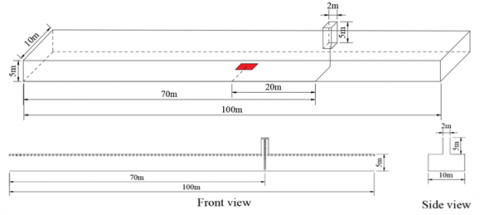
The tunnel fire was simulated by FDS. A single bidirectional tunnel was modeled: the x-direction length, y-direction width, and z-direction height were set to 100m, 10m, and 5m, respectively. The shaft was deployed at 20m downstream the fire source. Figure 1 shows the structure of the tunnel.
Figure 1. Tunnel structure
2.2 Parameter setting
The fire source is located on the longitudinal centerline of the tunnel. The length and width of the fire source were set to 4m and 2m, respectively. It is assumed that the fire source is a superfast unsteady t2 fire of n-heptane. Since most vehicles in urban tunnels are cars or buses, the fire power was set to 5, 10, and 20MW in turn. The shaft is of the size 2m×2m×5m. The two ends of the tunnel and the upper end of the shaft were configured as “open”, indicating that the tunnel and shaft are connected to the external environment. The ambient temperature was set to 20℃, the tunnel material was defined as “concrete”, and the operation time was set to 600s.
2.3 Measuring points and working conditions
At 0.1m below the centerline of tunnel roof, a series of thermocouples were deployed longitudinally to measure smoke temperature, with an interval of 1m. In the vertical direction, a string of smoke layer measuring points were arranged with an interval of 0.5m. In the shaft, temperature measuring points were deployed with an interval of 0.25m, and CO concentration measuring points were deployed with an interval of 0.5m. In addition, a plane of measurement was arranged at the outlet of the shaft to measure the mass flow of gas (Figure 1). To explore the combustion features and smoke motion features at different ambient temperatures, simulations were carried out with five working conditions, namely, 60kPa, 70kPa, 80kPa, 90kPa, and 101kPa. As shown in Table 1, a total of 15 different simulation conditions were configured.
Table 1. Simulation conditions
|
Serial number |
Fire source power (MW) |
Ambient pressure (kPa) |
|
1-5 |
5 |
|
|
6-10 |
10 |
60/70/80/90/101 |
|
11-15 |
20 |
|
2.4 Grid sensitivity
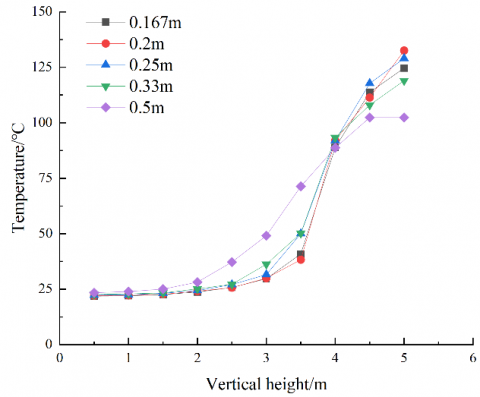
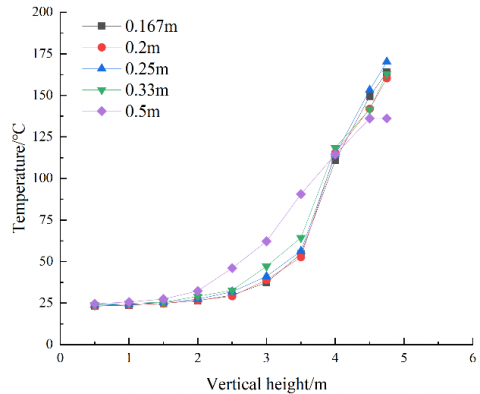
Prior to numerical simulation, it is necessary to analyze grid independence. The smaller the grids, the longer the calculation time. This section mainly discusses the smoke motion features and smoke ventilation effects in shaft tunnel under different ambient pressures. Taking the smallest fire source power of 5MW for example, the characteristic length of the fire source was calculated at two ambient pressures: 60 and 101kPa. Then, the grid size must fall between 0.1m and 0.6m. To rationalize the grid size, five grid sizes were simulated, including 0.167m, 0.2m, 0.25m, 0.33m, and 0.5m. Then, the vertical temperature changes were observed at different grid sizes. As shown in Figure 2, under both ambient pressures, the temperature range narrowed with the growing size of grids. The difference of temperature range between the two ambient pressures was very small, when the grid size was smaller than 0.2m. Therefore, the grid size was set to 0.2m in our numerical simulation.
(b) Ambient pressure of 60kPa
Figure 2. Vertical temperature distribution at different grid sizes
3.1 Smoke diffusion
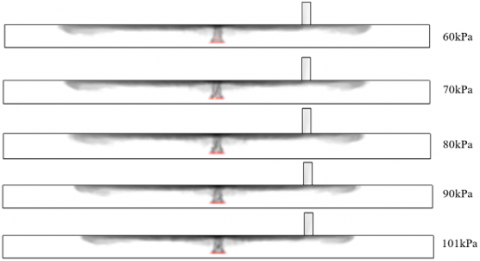
The development of tunnel fire involves multiple factors. The smoke diffusion in the tunnel generally consists of four stages [11-13]: In the first stage, the smoke is generated; After entraining the surrounding air, the smoke starts rising freely until reaching the roof, forming a plume. In the second stage, the smoke collides with the roof, and starts diffusing. In the third stage, the radial diffusion changes into longitudinal diffusion. In the fourth stage, one-dimensional (1D) horizontal motion is formed. The last stage is called the 1D horizontal diffusion stage, the longest stage of smoke diffusion. Only the last stage is considered in this research. To compare the smoke diffusion of tunnel fire at different ambient pressures, the smoke distributions at different ambient pressures were compared with the tunnel fire power of 20MW (Figure 3).
Figure 3. Smoke diffusion situation
Table 2. Diffusion variation at different ambient pressures
|
Serial number |
Ambient pressure (kPa) |
Time of arrival at the left opening (s) |
Time of arrival at the right opening (s) |
Backflow distance (m) |
|
1 |
60 |
91.5 |
97.6 |
38.25 |
|
2 |
70 |
95.0 |
100.0 |
36.65 |
|
3 |
80 |
97.0 |
102.7 |
35.68 |
|
4 |
90 |
99.4 |
104.5 |
34.68 |
|
5 |
101 |
101.7 |
107.1 |
33.30 |
Figure 3 shows the diffusion of fire smoke in the tunnel within the first 75s. It can be observed that, at different ambient pressures, the smoke spread through the tunnel shaft, and further diffused to the downstream. Within the same period, the lower the ambient pressure, the further the smoke diffused. Thus, the smoke diffuses faster in a low-pressure environment, than in a high-pressure environment.
At this time, the fresh air supply rate to the fire source increased with the falling ambient pressure. The reason is that the air in the low-pressure environment has a low oxygen content. When the fire source power remains the same, more air needs to be replenished to meet the oxygen demand of the fire. Hence, the lower-layer air flows to the fire source more rapidly in the low-pressure environment, than in a high-pressure environment.
In the area near the fire source, the smoke layer was relatively thin. With the longitudinal diffusion of the smoke, the smoke layer became thick in the area far from the fire source, a clear sign of smoke settlement. This may be explained as follows: During the longitudinal diffusion of smoke, the hot smoke continuous to exchange heat with the roof and side walls, and entrain the fresh air in the surroundings, causing the temperature to drop. The ensuing reduction of temperature difference, and weakening of thermal buoyancy results in settlement.
In the low-pressure environment, the fast smoke diffusion leaves a very short time for people to evacuate, posing a serious challenge to fire prevention and control. Therefore, the smoke response should be accelerated to cope with tunnel fire in a low-pressure environment.
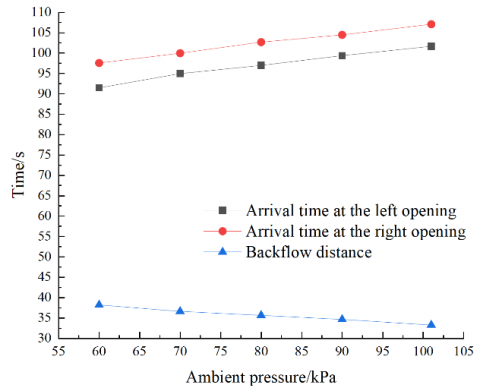
Table 2 shows the time of arrival of smoke at the left and right openings of the tunnel under different ambient pressures, and the backflow distance of the smoke to the upstream within 75s. The data in the table were plotted as shown in Figure 4.
Figure 4. Smoke diffusion changes at different ambient pressures
It can be observed from Figure 4 that, in the case of fire, the time of arrival of smoke at the two openings of the tunnel delayed with the growing ambient temperature. In addition, it took 7% more time for the fire smoke to reach the right opening of the tunnel than that to reach the left opening of the tunnel. This is because the shaft is on the right side of the fire source. When the smoke of the tunnel fire propagates to the shaft, a huge amount of smoke will be discharged from the shaft due to the stack effect. The diffusion speed is thus slowed down.
It can also be found from Figure 4 that, with the growth of ambient temperature, the backflow distance of fire smoke in the tunnel gradually reduced. Under the same heat release rate of the fire source, the backflow distance of the smoke at the ambient pressure of 60kPa was 5m longer than that of the smoke at the normal pressure. Thus, the smoke diffuses faster in a low-pressure environment than in a normal pressure environment.
3.2 Longitudinal temperature distribution
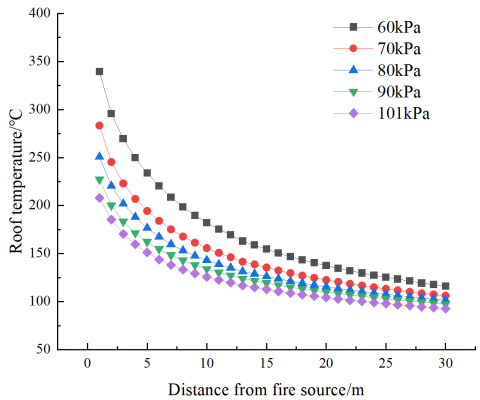
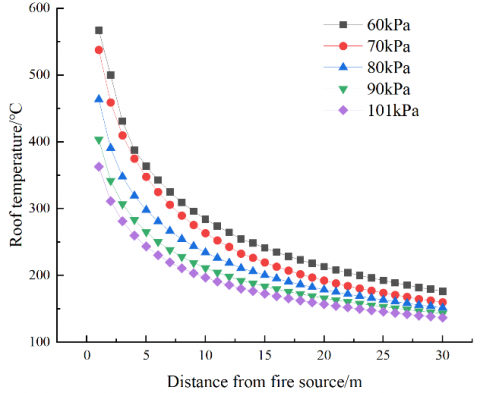
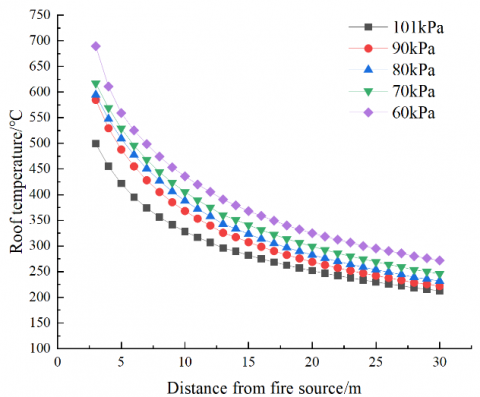
Under the action of thermal buoyancy, the smoke gradually propagates to the roof in the case of tunnel fire. Once it hits the roof, the smoke start spreading longitudinally. Thus, the variation of roof temperature can reflect the smoke diffusion, to a certain extent. Figure 5 shows the longitudinal smoke temperature distributions at different ambient pressures and fire source sizes.
It can be seen from Figure 5, when the fire source size remained the same, the roof temperature was relatively high in the low-pressure environment at the same distance. With the rise of ambient temperature, the smoke temperature on the roof gradually fell; The temperature under the roof gradually reduced with the growing distance from the fire source, and eventually tended to be stable.
The longitudinal temperature curves of the low-pressure environment shared basically the same features with those of the normal pressure environment: the temperature continued to decline with the growing distance from the fire source. The longitudinal temperature on the roof attenuated faster in the area near to fire source than in the area far from the fire source. The peak temperature in the latter area was significantly lower than the area close to the fire source. This phenomenon can be explained as follows:
In the area close to the fire source, the smoke temperature differs significantly from the ambient temperature. In this case, heat convection and radiation are quite strong. The two effects gradually weaken as the distance to the fire source grows. During the diffusion along the tunnel, the high-temperature gas continues to exchange heat with the roof and side walls, while absorbing fresh air from the surroundings. Therefore, the temperature becomes lower with the growing distance from the fire source. This is consistent with the law of smoke temperature rise on the roof at high altitudes, which was discovered by Yan et al. through experiments [6].
(a) 5MW
(b) 10MW
(c) 20MW
Figure 5. Tunnel roof temperature distributions at different ambient pressures
At the same ambient pressure, the higher the fire source power, the higher the smoke temperature on the roof of the tunnel. The reason is that the larger the fire source, the greater the heat radiation, and the more the air being combusted. Thus, the smoke is heated to a higher temperature by a larger fire source. The roof temperatures varied significantly between ambient pressures. When the fire source power was 5MW, and the ambient pressure was 60kPa, the smoke temperature with a specific distance from the fire source was 130℃ different from that in the normal pressure environment. When the fire source power was 20MW, and the ambient pressure was 60kPa, that difference was about 200℃. Therefore, ambient pressure is a major impactor of the longitudinal smoke temperature on the roof of tunnel. The fire protection range should be increased for low-pressure tunnels.
During tunnel fire, the tunnel roof would be damaged by excessively high temperature, reducing the overall carrying capacity of the tunnel. Figure 6 shows the variation of peak roof temperature at different ambient pressures. It can be observed that, during tunnel fire, the peak temperature on tunnel roof decreased with the growing ambient pressure. Under the normal pressure environment, the peak temperature was around 500℃. When the ambient pressure was 60kPa, the peak temperature was close to 700℃. There is a 200℃ difference between the two peak pressures. The reason is as follows:
In the low-pressure environment, the air has a low density and a low oxygen content. To support the combustion, the tip of the flame needs to get close to the tunnel roof. Thus, the contact widens between oxygen and the fire source, which enlarges the radiation range. As a result, compared with the normal pressure environment, the low-pressure environment has a relatively high peak temperature on the tunnel roof. For tunnel fires at different ambient pressures, the smoke temperature near the fire source increases with the decline of ambient pressure, at the same fire scale. Thus, it is more challenging to prevent, control, and rescue fires in the low-pressure environment.
As shown in Figure 6, there is a linear relationship between ambient pressure and peak temperature. The relationship can be fitted by least squares (LS) method: $y=4.0552 x+271.88$.
$\mathrm{R}^{2}=0.9171$ indicates a high goodness-of-fit.
Figure 6. Peak temperature distributions on tunnel roof at different ambient pressures
3.3 Vertical temperature distribution
Normally, people can be evacuated safety when the temperature is below 60℃, for the characteristic body height of 2m. This subsection explores the vertical temperature distributions at different distances from the fire source in the tunnel, under different ambient temperatures. Figures 7(a)-(c) show the vertical temperature distributions at 15m upstream the fire source, right below the shaft, and 15m downstream the shaft.
(a) Vertical temperature at 15m upstream the fire source
(b) Vertical temperature right below the shaft
(c) Vertical temperature 15m downstream the shaft
Figure 7. Vertical temperature distributions at different distances from the fire source
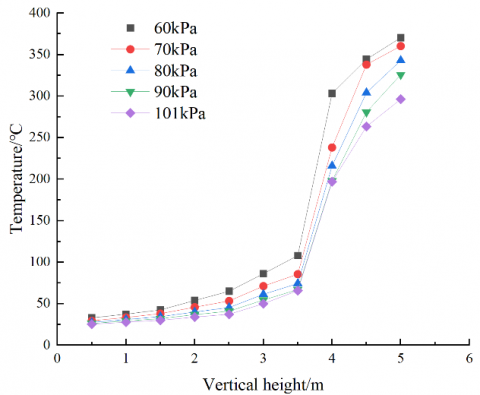
As shown in Figure 7(a), the vertical temperature in the tunnel generally increased with the height. The temperature in the low-pressure environment was mostly higher than that in the normal pressure environment. The roof temperature peaked at 370℃ in the low-pressure environment, 106℃ higher than the peak roof temperature in the normal pressure environment. Therefore, when the fire scale is fixed, the low-pressure environment damages the roof structure more significantly than the normal pressure environment. More attention should be paid to prevent tunnel fire in the low-pressure environment than in the normal pressure environment. When the height exceeds 3.5m, the smoke temperature soared quickly, indicating that the height is as tall as the smoke layer.
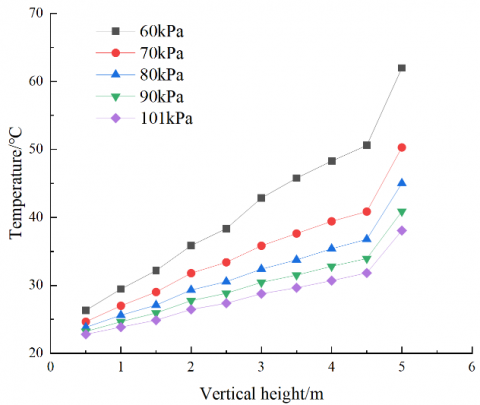
Figure 7(b) reports the vertical temperature distribution right below the shaft. It can be seen that the temperature was below 70℃ at any ambient pressure, far lower than the temperature at any other position in the tunnel. The main reason is that, once the fire smoke reaches below the shaft, a huge amount of smoke is sucked into the shaft and discharged to the outside, under the stack effect. The overall temperature is therefore reduced.
As shown in Figure 7(c), the vertical temperature in the downstream of the shaft was generally lower than that in the upstream of the fire source. This is partly attributable to the stack effect of the shaft. Another reason for the falling temperature is that the surrounding air is continuously entrained by the hot diffusing smoke, which exchanges heat with the side walls and roof of the tunnel.
Overall, the temperature at the height of 2m was below the standard temperature (60℃) for safe evacuation, whether the fire smoke spread to 15m upstream the fire source, right below the shaft, or 15m downstream the shaft. Therefore, shaft tunnel can increase smoke discharge, reduce smoke temperature in the tunnel, and facilitate the safe evacuation of people, in both low-pressure or normal pressure environment.
3.4 Relationship between mass flow and CO concentration
Figure 8 shows the mass flow of the gas flowing out of the shaft at different ambient pressures, under different heat release rates. Similar mass flow trends were observed in the gases discharged from the shaft, in the presence of different fire sources: the mass flow always increased with the ambient pressure. As the fire source grew larger, the mass flow from the shaft gradually increased. The mass flow curve became steeper at the fire source power of 20MW. This means, with the rise of ambient pressure, the shaft discharges more smoke at this fire source power, i.e., the shaft boasts stronger smoke ventilation ability
Figure 8. Mass flows of the gas discharged by the shaft at different fire source powers and ambient pressures
The reason for the above phenomenon is that the smoke volume increases with the fire source power. With a high fire source power, the smoke produces a huge horizontal inertial. In this case, the stack effect can overcome the horizontal inertial of lots of smoke. Thus, the smoke witnesses a decline in the entraining effect of fresh air. As a result, more smoke spreads from the roof into the shaft, increasing the smoke discharge of the shaft.
Under the same fire scale, the mass flow rate at a low pressure was 40% lower than that under normal pressure. The relatively small smoke mass flow is probably the result of the fact that the air density varies with ambient pressure. In a low-pressure environment, the air is relatively thin, the entraining speed is slow, and the smoke volume entraining the air is low.
Figure 9. CO concentrations in the shaft at different ambient pressures
Under the effect of plug holing, the mass flow discharged by the shaft may entrain the fresh air. The smoke ventilation ability of the shaft is directly reflected by CO, which rarely exists in the air. Thus, CO was chosen as the measure of the smoke ventilation ability of the shaft [14]. Figure 9 shows the CO concentrations (volume fraction) discharged by the shaft at different ambient pressures. It can be seen that the CO concertation in the shaft declined with the rising ambient pressure. The CO concentration in the shaft at the fire source power of 20MW was higher than that in any other working condition. In this case, the large smoke volume emitted by the shaft testifies the good ventilation effect of the shaft.
When the heat release rate decreased, the variation of CO concentration slowed down with the growth of the ambient pressure. The insignificant change of CO concentration suggests that the ambient pressure has a weak effect on the smoke discharge ability of the shaft, when the fire is of a small power. This provides a reference for the tunnel construction and fire prevention in areas with different ambient pressures.
(1) When the fire source power remains the same, the tunnel fire smoke propagates faster and faster, with the falling ambient pressure. In the low-pressure environment, the smoke spreads quickly, which leaves a short time for evacuation. This brings a huge challenge to fire prevention and control.
(2) When the fire scale remains the same, the longitudinal temperature curves of tunnel fire have basically the same features, at different ambient pressures. With the increase of ambient pressure, the longitudinal smoke temperature on the roof of the shaft tunnel gradually declines. The declining rate is positively correlated with the proximity to the fire source. Compared with that in small power fire, the roof temperature difference between low pressure and normal pressure is large in large power fire.
(3) Under different fire scales, the smoke ventilation efficiency of the shaft always increases first and then declines. The mass flow rate at a low pressure is 40% lower than that at normal pressure. The CO concentration in the shaft falls with the rise of ambient pressure. The smoke ventilation efficiency is better in the low-pressure environment, which facilitates the ventilation of fire smoke. The increase of fire power enhances the horizontal inertial force of smoke, and reduces the probability of plug holing. In addition, the ambient pressure has a small effect on the shaft smoke ventilation in small power fire.
[1] Yao, Y., Zhang, S., Shi, L., Cheng, X. (2019). Effects of shaft inclination angle on the capacity of smoke exhaust under tunnel fire. Indoor and Built Environment, 28(1): 77-87. https://doi.org/10.1177%2F1420326X17734906
[2] Zhang, L., Yan, Z.Z., Li, Z.H., Wang, X.M., Han, X.F., Jiang, J.C. (2018). Study on the effect of the jet speed of air curtain on smoke control in tunnel. Procedia Engineering, 211: 1026-1033. https://doi.org/10.1016/j.proeng.2017.12.106
[3] Zhang, N., Jin, M. (2013). Numerical simulation and experimental study on characteristics of fire in high-altitude tunnels. Information Technology Journal, 12(13): 2489-2496. https://doi.org/10.3923/itj.2013.2489.2496
[4] Zarzecki, M., Quintiere, J. G., Lyon, R.E., Rossmann, T., Diez, F.J. (2013). The effect of pressure and oxygen concentration on the combustion of PMMA. Combustion and Flame, 160(8): 1519-1530. https://doi.org/10.1016/j.combustflame.2013.02.019
[5] Wang, Y. (2019). Study of combustion characteristics and smoke flow control method of highway tunnel in very high altitude area. Southwest Jiaotong University.
[6] Yan, Z.G., Guo, Q.H., Zhu, H.H. (2017). Full-scale experiments on fire characteristics of road tunnel at high altitude. Tunnelling and Underground Space Technology, 66: 134-146. https://doi.org/10.1016/j.tust.2017.04.007
[7] Wang, J., Pan, Y., Lu, S., Lu, K., Chen, W. (2017). CO concentration decay profile and ceiling jet entrainment in aircraft cargo compartment fires at reduced pressures. Applied Thermal Engineering, 110: 772-778. https://doi.org/10.1016/j.applthermaleng.2016.08.213
[8] Ji, J., Guo, F., Gao, Z., Zhu, J. (2018). Effects of ambient pressure on transport characteristics of thermal-driven smoke flow in a tunnel. International Journal of Thermal Sciences, 125: 210-217. https://doi.org/10.1016/j.ijthermalsci.2017.11.027
[9] Ji, J., Guo, F., Gao, Z., Zhu, J., Sun, J. (2017). Numerical investigation on the effect of ambient pressure on smoke movement and temperature distribution in tunnel fires. Applied Thermal Engineering, 118: 663-669. https://doi.org/10.1016/j.applthermaleng.2017.03.026
[10] McGrattan, K., Hostikka, S., McDermott, R., Floyd, J., Weinschenk, C., Overholt, K. (2013). Fire dynamics simulator user’s guide. NIST Special Publication, 1019. http://dx.doi.org/10.6028/NIST.SP.1019
[11] Tian, Y. (2021). Numerical simulation of fire smoke and temperature field in high altitude tunnel. Fire Science and Technology, 40(2): 201-203.
[12] Jiang, X., Liu, M., Wang, J., Li, K. (2016). Study on air entrainment coefficient of one-dimensional horizontal movement stage of tunnel fire smoke in top central exhaust. Tunnelling and Underground Space Technology, 60: 1-9. https://doi.org/10.1016/j.tust.2016.07.010
[13] Ji, J., Fan, C.G., Zhong, W., Shen, X.B., Sun, J.H. (2012). Experimental investigation on influence of different transverse fire locations on maximum smoke temperature under the tunnel ceiling. International Journal of Heat and Mass Transfer, 55(17-18): 4817-4826. https://doi.org/10.1016/j.ijheatmasstransfer.2012.04.052
[14] Gao, Z.H. (2016). Studies on characteristics of confined fire plumes and mechanism of natural smoke exhaust by shaft in tunnel fires. University of Science and Technology of China.