Majeed Mattar Ramal* | Uday Hatem Abdulhameed | Arkan Dhari Jalal
© 2021 IIETA. This article is published by IIETA and is licensed under the CC BY 4.0 license (http://creativecommons.org/licenses/by/4.0/).
OPEN ACCESS
The main target of this research is to assess the risk exposure into specified trace elements (TEs) in taps drinking water of Ramadi city, western Iraq. Non-carcinogenic risks (Hazardous Index) for adults and children were estimated, and carcinogenic risks (CR) were determined. Results obtained in this research indicate that the non-carcinogenic risks (NCR) analysis of (TEs) for adults and children were the most hazardous quotient (HQ) of all (TEs) values, which were less than 1, except for (As). The hazardous index (HI) of (TEs) values was more than 1, which means that there could be a potential risk to human health. Based on USEPA (2015) the safe value for cancer risk (CR) exposed by a TE is less than 1.00E-06. Assessment of (CR) analysis of (TEs) for adults and children revealed that (CR) of (TEs) values were fell within the E-03 to E-06 range. The total average (CR) was 3.19E-03 per capita; The total average CR was extremely high. The current concentrations of TEs in taps drinking water could cause health and environmental issues that must be addressed. Water with high (TEs) concentrations should be handled and managed before it can be distributed to consumers.
water quality, tap water, trace elements, risk assessment
Freshwater is estimated to account for less than 3% of the world's water resources, and only 1% of this is suitable for human consumption [1]. Globally, according to the United Nations World Water Development Report, in 2017 about 29% of people in different countries have not yet got safe drinking water, in the last decades, and more than 55% of people have not safely sanitation [2].
The deterioration of water quality, as well as the rise in the number of water-related diseases, were behind of necessitates the creation of a national water quality management strategic plan aimed at improving coordination and cooperation among various stakeholder groups, as well as the implementation of monitoring standards and the providing information of water quality data. To get safe drinking water, drinking water must not have harmful contaminants, such as trace elements (TEs), toxic organic substances, bacteria and viruses [3].
Trace elements with precise concentrations abound in the natural world. Human actions such as mineral extraction, refining, and manufacturing, which have increased the economy and civilization, have greatly led to more trace elements entering the air, water, and land, leads to major environmental contamination [4]. Recently, the (TEs) were considered the major origin of environmental pollution problems. Disposal of wastewater with high (TEs) contents into the environment could be harmful to ecosystems and pose impacts to people health due to refractory characteristics of bioaccumulation. Even though that, the (TEs) are essential for life operations, they were only required at the trace quantities. Critical trace elements existing with high levels in drinking water led to a negative health effect, especially, chromium, cadmium, arsenic elements that have substantial biological toxicity and are harmful to human health [5-7]. For instance, Cadmium essentially collects in the human hepatic system and kidneys, disturbing estrogen secretion, and it is also carcinogenic [8, 9].
In addition, Chromium has the strongest biological toxicity among the trace elements (TEs) so that it can cause skin cancer for people. Copper is a much needed (TEs) for the human being body; however, it is also harmful to the kidney, liver, brain and digestive system with excessive concentrations (more than required levels) [10, 11]. Zinc is also one of the (TEs) that can cause severe problems to the digestive system, blood system and neurological system, while lack of selenium can expedite the body’s aging stage, leading to diabetes, cancer, cardiovascular disease and rising other diseases [7, 12].
Therefore, globally, drinking water quality has become a great concern to the people, especially in heavily polluted rural areas. In the current study, pollution characteristics, source, and health risk assessment (HRA) of (TEs) that existed in drinking tap water (DTW) for different areas in the Ramadi city, Iraq, were investigated.
The drinking water can be mainly polluted by the (TEs) coming from domestic and industrial activities, in addition to the fatigue of the distribution network and the home network as well as inappropriate wastes disposal [13, 14].
The main source of (TEs) existed in the tap water is the corrosion of domestic piping systems. If there is contact between water with the metal coating, the corrosion usually happens over time, releasing the (TEs) into the water.
Many factors, including pipe material and pipe's internal protective lining, could highly affect the corrosion of pipe [7]. The water quality monitoring data obtained from the health facilities in this area can be also used to analyze the health concerns [15].
Water used for drinking and agricultural purposes in Iraq is poor quality, failing to meet both Iraqi National and World Health Organization Standards. The Biochemical Oxygen Demand (BOD) in water was 36.2 mg/L in 2010, more than three times the national limit of 10 mg/L, suggesting an alarming increase in water pollution. Nearly 60% of children Iraqis do not have access to clean potable water, and less than 50% of all schools in the country have basic water, putting children's health, nutrition, cognitive development, and future livelihoods at danger. People who drink dirty water will be at a higher risk of developing water-related illnesses. Many cases were caused by the drinking of water from inadequate sources [16].
The lack of information and researches about water quality and (HRA), in 2019, Iraq reported total of (140621) deaths, which is about (3.594E-03) deaths. Anbar province (study area) has (3704) deaths which are about (2.47E-03). According to the Iraqi Health ministry, data cancer disease forms the second-highest rate of deaths in Iraq which represents 9.33% in 2019. In addition, the total tumors of children were (1715) cases, which about (11.12 E-04) [17].
In China, it was found that non-carcinogenic health hazards are greater in the dry season than in the rainy season for both adults and children. During the dry and rainy seasons, the water quality indicators evaluated in the risk analysis contribute to the total non-carcinogenic risk at various levels. The average non-carcinogenic risk values of chlorinated water and terminal tap water were F> As > NO3-N > Cr6+ in the summer months, and F> NO3-N > Cr6+ > As in the wet season [15]. Although numerous studies have been conducted to analyze the health risks of (TEs) in diverse sources of water, the influence of age and the content of all (TEs) in (DTW) have been overlooked. As a result, a study was done in Zahedan city, Iran to assess the (TEs) such as (As, Cr, B, Mn, Cu, Fe, Al, Se, Cd, Ni, Zn, Pb, and Hg) in the (DTW) and to determine their non-carcinogenic and carcinogenic effects based on the guidelines [3].
In Algeria, the concentration of some TEs was investigated in the surface water of Chott Merouane city to assess the possible risks of (TEs) to humans. The Hazard Quotient (HQ) and Hazard index (HI) for both adults and children through the oral route were less than one, but the HI for kids was larger than one (1.36), showing an inadequate risk of non-carcinogenic impacts on children's health. The Carcinogenic Risk (CR) was reported to be within the tolerable cancer risk range of 106–104 set by the USEPA [18]. Moreover, it was stated that both non-carcinogenic and carcinogenic risks could be substantially attributed to the oral pathway with minor adverse health risks, suggesting important conservation, mitigations, and management measures must be carried out to enhance the water quality of this water resources area [18].
In the north of China, a (HRA) in the Luan River was carried out; (CR) and (HQs) were assessed separately. The results showed that both the (CR) and HQs of Ni and Cr are larger than the acceptable guideline values [19].
Table 1 presents the popular (TEs) observed in piped drinking water, as well as their sources, WHO recommendations, and possible health hazards [20-24].
The fatality rate in Iraq has risen, as has the total number of deaths caused by malignant neoplasms (2017, 2018, and 2019) were (2738, 21766, and 22737), respectively [17].
This study goals to assess the (HRA) due to exposure to trace elements (TEs) in taps potable water pumped by the Large Ramadi drinking water treatment plant in Ramadi city, Anbar province, western of Iraq. Non-carcinogenic risk (Hazardous Index, HI) and carcinogenic risk (CR) of TEs were developed to assess the quality and risk of taps supplied water. Thirty-six locations in Ramadi were collected for a total sum of 216 taps water samples, and trace elements were then investigated.
Table 1. Sources, risks and criteria of common TEs in water
|
Heavy Metal |
Main sources |
Health risks |
Guideline(mg/L) |
|
Lead (Pb) |
Plumbing and Fittings |
Neurotoxic impacts, Possibly carcinogenic |
0.01 |
|
Nickel (Ni) |
Naturally Occuring Plumbing and Fittings |
Allergic contact dermatitis, possibly carcinogenic |
0.07 |
|
Iron (Fe) |
Plumbing and Fittings |
Taste and appearance above guideline concentration |
1-3 |
|
Chromium (Cr) |
Naturally Occuring |
Cr+6 (Human Carcinogen) |
0.05 |
|
Arsenic (As) |
Naturally Occuring |
Carcinogenic |
0.01 |
|
Cadmium (Cd) |
Plumbing and Fitting, Industrial |
Possibility Carcinogenic |
0.003 |
|
Barium (Ba) |
Naturally Occuring |
Hypertension |
1.3 |
|
Antimony |
Naturally Occuring |
Possibility Carcinogenic |
0.02 |
|
Manganese (Mn) |
Naturally Occuring |
Possibility neurological impact |
0.4 |
|
Mercury (Hg) (Inorganic) |
Industrial |
Hemorrhagic gastritis and colitis. kidney injury. carcinogenic |
0.006 |
2.1 Study area
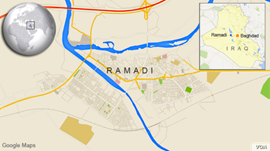
Ramadi City (RC), which is the center of Anbar province, is located in western Iraqi desert. The geographical position of RC is shown in the Figure 1. RC is a moderately urbanized city with a population of about 270,000 people, with several minor and two large industries (glass and Ceramic factories). The study area is around (6605) hectares [25, 26].
Many challenges and concerns face the RC's drinking fresh water, such as an outdated and damaged water distribution system, a current supply shortage, high consumption, and population growth. As a result, this study was conducted to assess the health risk due to contact with trace elements in potable water in the tap. This potable water is provided by the Main Ramadi Water Treatment Plant in Ramadi city.
Figure 1. Geographical location of Ramadi city
2.2 Ramadi water supply
The raw water supplied for the RC mainly comes from the Euphrates River. The Large Ramadi drinking water treatment project (LRDWTP) provides drinkable water to RC using traditional treatment processes (sedimentation, filtration, and chlorination). The (LRDWTP) supplies Ramadi areas with potable water at a rate of roughly 0.25 million m3/day. The drinking water was divided into the Ramadi piping system, which made up of old iron feeder lines (diameter > 600 mm), PVC main pipes (100-150 mm diameter), and HDPE consumer connections [26].
2.3 Sampling
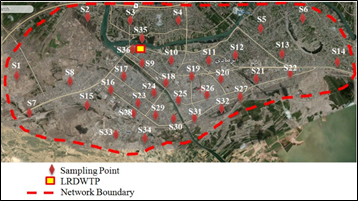
From December 2020 through June 2021, a sampling period was conducted. A total of 36 sites were recommended to completely cover the research region, based on the water distribution infrastructure, demographic density, and population dispersion. Measurements were taken bimonthly. 216 tests of tap water were collected during the research period of the investigation. The study area is around (6605) hectares. Geographic information systems (GIS) technology (ARC GIS.V 10.33) in research mapping and determination of water samples by using (GPS). The study area boundary and sampling station shown in (Figure 2). Sampling points were selected to covers all the Ramadi City (RC). Two samples were collected from each sampling station, then kept in a clean vessel of polyethylene, Polyethylene vessel of 1 Liter volume were used for collection samples.
Figure 2. Study area boundary and sampling stations
Vessels cleaned with nitric acid in a ratio of 1:1 for one day, then washed with deionized water. pH values of the samples should be lowered to less than 2, therefore, high quality nitric acid poured to samples to reduce the of absorbability of trace elements in sampling vessels in accordance with [27]. After acidification, samples were then put in the cooling (incubator) at 4℃. The As, Cd, Cr, Ni, Pb, and Fe element concentrations were measured and analyzed using the Atomic Absorption Spectrophotometer instrument (AAS), (Phoinex-986), and it was calibrated by a certified standard solution. The AAS, A standard reagents was used to verify the device calibration status after every 10 examined measurements. If the standard deviation readings were greater than ten percent, the instrument must be recalibrated.
2.4 Assessment of human health risk (HHRA)
Risk assessment (RA) is the process of evaluating the likelihood of accident occurrence or the likelihood of a harmful health impact on humans or other animals exposed to environmental risks [28].
TEs have been found as being a substantial challenge and danger to human. TEs may enter the body through a variety of routes, including cutaneous, ingestion, and inhalation, oral ingestion is the most common and major route [29].
Generally, when humans are exposed to low chemical doses, the exposure intake rate has a linear relation with human (CR). However, when a high intake results in a higher (CR), there is an exponential relation between the exposure dose rate and human (CR). The average chronic daily intake (ACDIi) by ingestion route may be estimated using the equation below [30-33].
ACDIi=CW×IR×ED×EFBW×AT (1)
where,
ACDIi: average chronic daily dose intake by ingestion, in mg/kg/day unit.
BW: weight of body, in kg unit.
EF: exposure frequency, in days/year unit.
IR: ingestion rate, in L/day unit.
ED: exposure duration, in years unit.
Cw: average concentration of trace metals in water, in mg/L unit.
AT: average time (days).
Table 2 shows the key exposure parameters of the risk assessment analyses.
Both the carcinogenic (CR) and non-carcinogenic risks (NCR) are typically identified based on the risk assessment guidance recommendations of the USEPA. Non-carcinogenic risk were calculated through hazard quotient value (HQ), which reflects possible non-carcinogenic risks, applying Eq. (2) [30, 34].
Hazard Quotient (HQi)=ACDIiRfDi (2)
where,
ACDIi is the average chronic daily dose intake, in mg/kg/day unit and The RfD is the oral reference dose of metallic compound in a specific condition (mg/kg/day); these parameters are taken from the US EPA's integrated risk information system [33, 34].
The index of hazard (HI), represents the sum of the HQs coming from all relevant pathways. HI was established to quantify the overall possible non-carcinogenic hazards provided by more than one route. If the HI less than or equal one, there may be a risk of non-carcinogenic impacts, while if HI more than 1 there may be a potential risk on human health or more research is required [34, 35].
Hazard Index (HI)=∑nI=1HQi (3)
where, RfD is derived from the risk-based concentration table. [34, 36].
To assess the carcinogenic risks (CR), the following equations were used.
Cancer Risk (CRi)=ACDDi×CSF (4)
where, CSF is cancer slop factor (mg/ kg/ day) and CR denotes the cancer development likelihood induced by exposure to various types of carcinogenic chemicals over the period of an average population's lifetime.
Table 3 shows the quantities of oral slope factors unit risks for the three pollutants examined in this study.
When numerous TEs are taken into account, the total (CR) is used.; This quantity is computed by summing the CR of the carcinogenic substances under consideration. Total CR is calculated as follows [30]:
Total (CR) =∑nI=1CRi (5)
Depending on the USEPA's recommendations, the permissible or reasonable (CR) range is 10-6 to 10-4. Considerably, CR levels less than 10-6 reflect that the (CR) is assessed insignificant; Though, according to the most international organizations of regulatory, including the World Health Organization (WHO). CR is considered unacceptable for CR values greater than 10-4. Some researchers express CR based on the significant risk classification approach, in which the CR is categorized into 7 categories according to the Delphi method as shown in (Table 4), CR categorization gives better clarity and intelligible when assess the data [37].
Table 2. The key exposure parameters of the risk assessment analyses [30]
|
Exposure parameters |
Symbols |
Units |
Non Carcinogenic |
Carcinogenic |
|
|
Adult |
Children |
Adults and Children |
|||
|
Water Concentration |
C |
mg/L |
|
|
|
|
Frequency of Exposure |
EF |
days/year |
365 |
365 |
365 |
|
Duration of Exposure |
ED |
years |
30 |
6 |
70 |
|
Average Time |
AT |
days |
ED×EF |
ED×EF |
ED×EF |
|
Weight of Body |
BW |
kg |
70 |
15 |
70 |
|
Rate of Ingestion |
IR |
L/day |
2 |
1 |
2 |
Table 3. The quantities of oral slope factors unit risks for the three pollutants applied in this study
|
Exposure parameters |
Cd |
Pb |
Cr |
As |
Ni |
Fe |
|
Oral RFD (mg/kg/day)a |
5.00E-04 |
3.50E-03 |
3.00E-03 |
3.00E-04 |
2.00E-02 |
7.00E-01 |
|
Oral CSF (mg/kg/day) |
0.38b |
0.0085b |
0.5b |
1.5b |
1.7 c |
0 a |
a: [30], b:[38], c: [39]
Table 4. Cancer risk (CR) classes according to the Delphi method [37]
|
Class |
Impact |
Value |
Response |
|
Class I |
Extremely low risk |
<E-06 |
Completely accept |
|
Class II |
Low risk |
E-06, E-05 |
Ignore the risk |
|
Class III |
Low-medium risk |
E-05,5E-05 |
Do not care about the risk |
|
Class IV |
Medium risk |
5E-05, E-4 |
Care about the risk |
|
Class V |
Medium-high risk |
E-04,5E-04 |
Concerned of risk and ready to invest, |
|
Class VI |
High risk |
5E-04, E-03 |
Give importance to the risk and propose, suitable measures to mitigate it. |
|
Class VII |
Extremely high risk |
risk >E-03 |
Refuse the risk, find a method to manage it. |
2.4.1 Data preparation and analysis
The Excel software was applied for Data calculation. The descriptive statistics, including maximum, mean, standard deviation and coefficient of variation, Cluster analysis, and principal component analysis were used to assess metal source apportionment. SPSS V.24 software (IBM, USA) was used. This study also performed spatial analysis based on the numerous measured TEs and computed (CR) and non-carcinogenic risk (hazard index, HI) of TEs monitoring of each site and developed a set of maps about TEs, CR and HI using ArcGIS from Environmental Systems Research Institute (ESRI). Therefore, Geographic Information System (GIS) software application research in (HRA) has gained increasing interest and application [40].
3.1 Concentration of trace elements
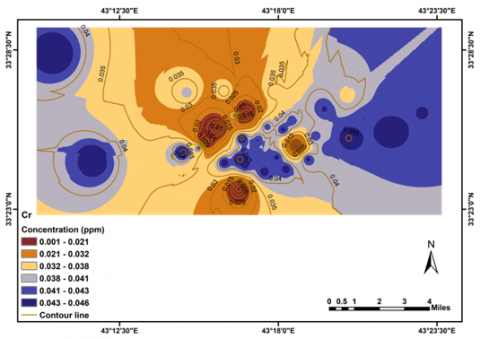
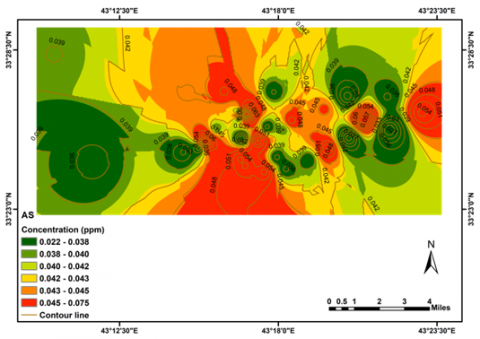
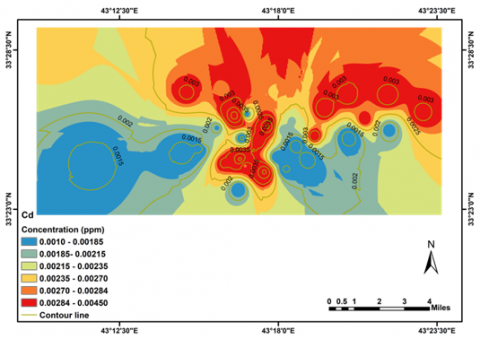
Table 5 provides the descriptive statistics of the average concentration of TEs. ArcGIS tool was applied in this study to model the spatially average concentration of TEs, as shown in the Figures 3-8. The results of the average TEs concentration showed that the percentage of monitored sites that exceed the desirable and recommended drinking water guidelines varied from one metal to another. Table 3 shows the results of (TEs) measurements obtained in water samples collected from the research region. In decreasing order, the average levels of tested metals were As > Cr > Fe > Pb > Cd > Ni. Data in Tables 5 shows that the (TEs) levels in (DTW) samples collected from the research area are following the decreasing order, Fe> As > Cr > Pb > Ni > Cd.
The results of the average Pb and As measurements showed that (100%) of monitored sites exceeded the united states environmental protection agency (USEPA), the World Health Organization (WHO), and Iraqi local standards (IQS) of drinking water criteria, respectively [24, 41].
The average Ni measurements showed that (72.3%, 0.0%, and 0.0%) of monitored sites exceeded the drinking water criteria, according to the (WHO), (IQS) and (USEPA) criteria respectively [24, 41, 42].
The average Fe and Cr measurements showed that (100%) of monitored sites comply with the drinking water, according to the (WHO), (USEPA) and (IQS) criteria [24, 41, 42].
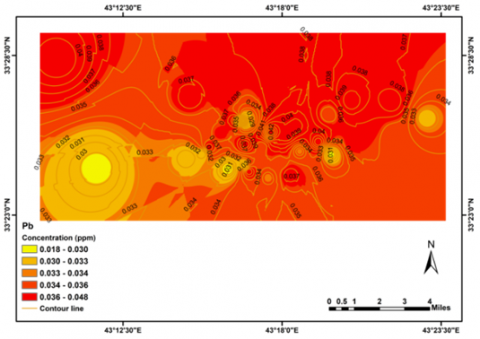
Figure 3. Average concentrations of Pb
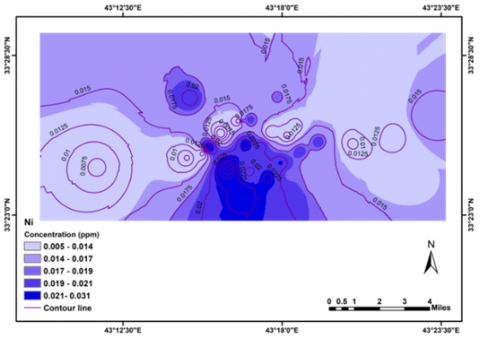
Figure 4. Average concentrations of Ni
Figure 5. Average concentrations of Fe
Figure 6. Average concentrations of Cr
Figure 7. Average concentrations of As
Figure 8. Average concentrations of Cd
The average Cd measurements showed that the percentage of monitored sites that comply with the drinking water guidelines were (100%, 61.2%, and 61.2%), according to the (WHO), (USEPA) and (IQS) respectively [24, 41, 42].
The results of Pb and As showed that all sites exceeded the (WHO), (USEPA) and (IQS) potable water criteria. The results of Ni show that stations (S2, S16, S18, S23, S24, S25, S26, S28, S30, and S34) were more than the USEPA and IQS drinking water guidelines, while Ni concentrations were within WHO guidelines in all stations.
The Fe and Cr concentrations were within WHO, USEPA, and IQS drinking water guidelines in all stations. The Cd measurements show that stations, including S2, S5, S6, S9, S10, S12, S14, S18, S20, S23, S26, S28, S30, and S36 exceeded the WHO drinking water guideline, while Cd concentrations were within USEPA and IQS guidelines in all stations. The descriptive statistic (minimum, maximum, average, and standard deviation) results regarding Pb were (0.019, 0.047, 0.0359, and 0.0052), respectively. The total average Pb concentration at all stations was more than the drinking water guidelines. The descriptive statistic (minimum, maximum, average, and standard deviation) results of Ni were (0.0050, 0.0310, 0.0166, and 0.0064), respectively. The total average Ni concentrations at all stations were within USEPA and IQS drinking water guidelines, but more than the WHO guideline. The descriptive statistic (minimum, maximum, average, and standard deviation) results of Fe were (0.0240, 0.0794, 0.0613, and 0.0138), respectively. The total average Fe concentration at all stations was within the drinking water guidelines. The descriptive statistic (minimum, maximum, average, and standard deviation) results of Cr were (0.0011, 0.0045, 0.0025, and 0.001), respectively. The total average Cr concentration at all stations was within the drinking water guidelines.
The descriptive statistic (minimum, maximum, average, and standard deviation) results of As were (0.0224, 0.0748, 0.0436, and 0.0123), respectively. The total average As concentration at all stations exceeded the drinking water guidelines. The descriptive statistic (minimum, maximum, average, and standard deviation) results of Cd were (0.0100, 0.0450, 0.0244, and 0.0102), respectively, the total average Cd concentration at all stations was within the drinking water guidelines.
The results of the average Pb and As measurements showed that (100%) of monitored sites exceeded the drinking water guidelines, according to the united states environmental protection agency (USEPA), the World Health Organization (WHO), and (IQS) for potable water uses guidelines [24, 41, 42].
Based on the comparative of the (WHO), (USEPA) and Iraqi standards drinking water criteria and the average measurements of the TEs, the (DTW) was polluted by Pb, Ni, As, and Cd.
Table 5 shows the descriptive statistics for (TEs) levels (mg/l) in comparison to the recommendations.
Table 5. Descriptive statistics of (TEs) measurements (mg/l) in comparison with criteria
|
TEs |
.Min |
.Max |
Average TEs (Conc. ±S.D) . |
Drinking a |
Drinking b |
Drinking c |
|
Pb |
0.0190 |
0.0470 |
0.0359 ± 0.0052 |
0.010 |
0.015 |
0.01 |
|
Ni |
0.0050 |
0.0310 |
0.0166 ± 0.0064 |
0.070 |
0.02 |
0.02 |
|
Fe |
0.0240 |
0.0794 |
0.0613 ± 0.0138 |
0.3 |
0.3 |
0.1 |
|
Cr |
0.0011 |
0.0045 |
0.0025 ± 0.001 |
0.050 |
0.10 |
0.05 |
|
As |
0.0224 |
0.0748 |
0.0436 ± 0.0123 |
0.01 |
0.01 |
0.01 |
|
Cd |
0.0100 |
0.0450 |
0.0244 ± 0.0102 |
0.003 |
0.005 |
0.005 |
(a): [24]; (b): [42]; (c): [41]
Table 6. Non carcinogenic risk (HQ) and (HI) of TEs for adults
|
|
Non Carcinogenic HQ Adult |
|
|||||
|
Stations |
Pb |
Ni |
Fe |
Cr |
As |
Cd |
HI |
|
S1 |
3.35E-01 |
2.43E-02 |
2.90E-03 |
4.29E-01 |
3.70E+00 |
1.43E-01 |
4.64E+00 |
|
S2 |
3.10E-01 |
3.00E-02 |
2.83E-03 |
3.73E-01 |
4.30E+00 |
1.77E-01 |
5.20E+00 |
|
S3 |
3.02E-01 |
2.14E-02 |
3.05E-03 |
3.54E-01 |
4.62E+00 |
1.60E-01 |
5.46E+00 |
|
S4 |
3.10E-01 |
2.57E-02 |
2.35E-03 |
3.44E-01 |
3.40E+00 |
1.54E-01 |
4.24E+00 |
|
S5 |
3.27E-01 |
1.86E-02 |
3.19E-03 |
3.50E-01 |
2.75E+00 |
1.83E-01 |
3.63E+00 |
|
S6 |
3.18E-01 |
2.00E-02 |
2.98E-03 |
3.96E-01 |
3.39E+00 |
1.83E-01 |
4.31E+00 |
|
S7 |
2.37E-01 |
1.00E-02 |
1.87E-03 |
4.24E-01 |
3.30E+00 |
6.86E-02 |
4.04E+00 |
|
S8 |
2.53E-01 |
1.29E-02 |
1.95E-03 |
4.06E-01 |
2.97E+00 |
7.43E-02 |
3.72E+00 |
|
S9 |
3.84E-01 |
1.14E-02 |
2.95E-03 |
4.16E-01 |
4.34E+00 |
2.57E-01 |
5.41E+00 |
|
S10 |
3.67E-01 |
1.43E-02 |
3.05E-03 |
4.04E-01 |
3.35E+00 |
2.34E-01 |
4.37E+00 |
|
S11 |
3.35E-01 |
1.57E-02 |
3.24E-03 |
4.06E-01 |
4.68E+00 |
1.20E-01 |
5.56E+00 |
|
S12 |
2.86E-01 |
2.00E-02 |
3.15E-03 |
4.11E-01 |
4.36E+00 |
1.89E-01 |
5.27E+00 |
|
S13 |
3.02E-01 |
2.00E-02 |
3.11E-03 |
4.10E-01 |
6.27E+00 |
1.71E-01 |
7.17E+00 |
|
S14 |
2.61E-01 |
2.43E-02 |
3.07E-03 |
4.10E-01 |
5.21E+00 |
1.77E-01 |
6.09E+00 |
|
S15 |
2.53E-01 |
1.00E-02 |
2.22E-03 |
4.39E-01 |
3.09E+00 |
5.71E-02 |
3.85E+00 |
|
S16 |
3.10E-01 |
3.86E-02 |
2.90E-03 |
3.52E-02 |
6.26E+00 |
1.20E-01 |
6.76E+00 |
|
S17 |
3.02E-01 |
7.14E-03 |
1.46E-03 |
2.38E-02 |
3.70E+00 |
1.03E-01 |
4.13E+00 |
|
S18 |
2.86E-01 |
3.00E-02 |
2.17E-03 |
4.10E-01 |
5.47E+00 |
1.94E-01 |
6.39E+00 |
|
S19 |
3.35E-01 |
1.29E-02 |
1.99E-03 |
4.16E-01 |
3.69E+00 |
1.14E-01 |
4.57E+00 |
|
S20 |
3.43E-01 |
2.86E-02 |
2.91E-03 |
4.06E-01 |
4.35E+00 |
1.94E-01 |
5.33E+00 |
|
S21 |
3.02E-01 |
1.29E-02 |
1.73E-03 |
4.31E-01 |
2.46E+00 |
6.29E-02 |
3.27E+00 |
|
S22 |
2.86E-01 |
1.57E-02 |
2.13E-03 |
4.27E-01 |
2.33E+00 |
9.71E-02 |
3.16E+00 |
|
S23 |
2.53E-01 |
3.00E-02 |
2.78E-03 |
4.40E-01 |
5.23E+00 |
2.34E-01 |
6.19E+00 |
|
S24 |
3.27E-01 |
3.43E-02 |
1.74E-03 |
4.36E-01 |
2.65E+00 |
8.00E-02 |
3.53E+00 |
|
S25 |
2.86E-01 |
3.14E-02 |
1.67E-03 |
4.13E-01 |
3.34E+00 |
8.57E-02 |
4.16E+00 |
|
S26 |
3.02E-01 |
4.14E-02 |
2.33E-03 |
4.01E-01 |
5.19E+00 |
1.94E-01 |
6.13E+00 |
|
S27 |
2.37E-01 |
2.14E-02 |
2.51E-03 |
4.02E-01 |
5.15E+00 |
1.20E-01 |
5.93E+00 |
|
S28 |
2.29E-01 |
4.43E-02 |
2.82E-03 |
4.22E-01 |
4.50E+00 |
1.77E-01 |
5.37E+00 |
|
S29 |
3.18E-01 |
2.71E-02 |
3.07E-03 |
4.17E-01 |
5.21E+00 |
1.60E-01 |
6.13E+00 |
|
S30 |
2.69E-01 |
3.29E-02 |
2.95E-03 |
4.19E-01 |
5.25E+00 |
2.34E-01 |
6.21E+00 |
|
S31 |
3.10E-01 |
2.57E-02 |
2.17E-03 |
4.18E-01 |
3.36E+00 |
8.00E-02 |
4.20E+00 |
|
S32 |
2.94E-01 |
2.14E-02 |
2.63E-03 |
4.14E-01 |
3.44E+00 |
6.29E-02 |
4.23E+00 |
|
S33 |
2.69E-01 |
2.86E-02 |
2.28E-03 |
2.38E-02 |
4.08E+00 |
6.29E-02 |
4.46E+00 |
|
S34 |
2.86E-01 |
3.43E-02 |
2.70E-03 |
2.57E-02 |
4.77E+00 |
8.57E-02 |
5.21E+00 |
|
S35 |
2.69E-01 |
2.86E-02 |
2.23E-03 |
3.71E-02 |
7.12E+00 |
8.57E-02 |
7.55E+00 |
|
S36 |
1.55E-01 |
2.63E-02 |
9.80E-04 |
1.05E-02 |
2.13E+00 |
2.17E-01 |
2.54E+00 |
|
Min. |
1.55E-01 |
7.14E-03 |
9.80E-04 |
1.05E-02 |
2.13E+00 |
5.71E-02 |
2.54E+00 |
|
Max. |
3.84E-01 |
4.43E-02 |
3.24E-03 |
4.40E-01 |
7.12E+00 |
2.57E-01 |
7.55E+00 |
|
Avg. |
2.93E-01 |
2.37E-02 |
2.50E-03 |
3.44E-01 |
4.15E+00 |
1.42E-01 |
4.96E+00 |
|
S.D |
4.21E-02 |
9.12E-03 |
5.62E-04 |
1.44E-01 |
1.17E+00 |
5.83E-02 |
1.18E+00 |
Table 7. Non carcinogenic risk (HQ) and (HI) of TEs for children
|
|
Non Carcinogenic HQ Child |
|
|||||
|
Stations |
Pb |
Ni |
Fe |
Cr |
As |
Cd |
HI |
|
S1 |
7.81E-01 |
5.67E-02 |
6.77E-03 |
1.00E+00 |
8.64E+00 |
3.33E-01 |
10.82271 |
|
S2 |
7.24E-01 |
7.00E-02 |
6.61E-03 |
8.71E-01 |
1.00E+01 |
4.13E-01 |
12.12991 |
|
S3 |
7.05E-01 |
5.00E-02 |
7.11E-03 |
8.27E-01 |
1.08E+01 |
3.73E-01 |
12.74028 |
|
S4 |
7.24E-01 |
6.00E-02 |
5.49E-03 |
8.02E-01 |
7.93E+00 |
3.60E-01 |
9.885345 |
|
S5 |
7.62E-01 |
4.33E-02 |
7.45E-03 |
8.18E-01 |
6.42E+00 |
4.27E-01 |
8.479776 |
|
S6 |
7.43E-01 |
4.67E-02 |
6.96E-03 |
9.24E-01 |
7.91E+00 |
4.27E-01 |
10.05921 |
|
S7 |
5.52E-01 |
2.33E-02 |
4.36E-03 |
9.89E-01 |
7.69E+00 |
1.60E-01 |
9.418325 |
|
S8 |
5.91E-01 |
3.00E-02 |
4.54E-03 |
9.47E-01 |
6.93E+00 |
1.73E-01 |
8.678786 |
|
S9 |
8.95E-01 |
2.67E-02 |
6.89E-03 |
9.71E-01 |
1.01E+01 |
6.00E-01 |
12.63387 |
|
S10 |
8.57E-01 |
3.33E-02 |
7.12E-03 |
9.42E-01 |
7.82E+00 |
5.47E-01 |
10.20921 |
|
S11 |
7.81E-01 |
3.67E-02 |
7.56E-03 |
9.47E-01 |
1.09E+01 |
2.80E-01 |
12.96361 |
|
S12 |
6.67E-01 |
4.67E-02 |
7.35E-03 |
9.60E-01 |
1.02E+01 |
4.40E-01 |
12.29908 |
|
S13 |
7.05E-01 |
4.67E-02 |
7.27E-03 |
9.56E-01 |
1.46E+01 |
4.00E-01 |
16.73731 |
|
S14 |
6.10E-01 |
5.67E-02 |
7.16E-03 |
9.58E-01 |
1.22E+01 |
4.13E-01 |
14.20073 |
|
S15 |
5.91E-01 |
2.33E-02 |
5.19E-03 |
1.02E+00 |
7.20E+00 |
1.33E-01 |
8.977227 |
|
S16 |
7.24E-01 |
9.00E-02 |
6.76E-03 |
8.22E-02 |
1.46E+01 |
2.80E-01 |
15.78358 |
|
S17 |
7.05E-01 |
1.67E-02 |
3.40E-03 |
5.56E-02 |
8.62E+00 |
2.40E-01 |
9.643088 |
|
S18 |
6.67E-01 |
7.00E-02 |
5.07E-03 |
9.58E-01 |
1.28E+01 |
4.53E-01 |
14.90915 |
|
S19 |
7.81E-01 |
3.00E-02 |
4.64E-03 |
9.71E-01 |
8.60E+00 |
2.67E-01 |
10.6539 |
|
S20 |
8.00E-01 |
6.67E-02 |
6.79E-03 |
9.47E-01 |
1.02E+01 |
4.53E-01 |
12.42963 |
|
S21 |
7.05E-01 |
3.00E-02 |
4.04E-03 |
1.01E+00 |
5.73E+00 |
1.47E-01 |
7.625848 |
|
S22 |
6.67E-01 |
3.67E-02 |
4.96E-03 |
9.96E-01 |
5.44E+00 |
2.27E-01 |
7.375331 |
|
S23 |
5.91E-01 |
7.00E-02 |
6.49E-03 |
1.03E+00 |
1.22E+01 |
5.47E-01 |
14.44102 |
|
S24 |
7.62E-01 |
8.00E-02 |
4.05E-03 |
1.02E+00 |
6.18E+00 |
1.87E-01 |
8.228586 |
|
S25 |
6.67E-01 |
7.33E-02 |
3.89E-03 |
9.64E-01 |
7.80E+00 |
2.00E-01 |
9.708816 |
|
S26 |
7.05E-01 |
9.67E-02 |
5.43E-03 |
9.36E-01 |
1.21E+01 |
4.53E-01 |
14.30757 |
|
S27 |
5.52E-01 |
5.00E-02 |
5.85E-03 |
9.38E-01 |
1.20E+01 |
2.80E-01 |
13.84892 |
|
S28 |
5.33E-01 |
1.03E-01 |
6.57E-03 |
9.84E-01 |
1.05E+01 |
4.13E-01 |
12.53053 |
|
S29 |
7.43E-01 |
6.33E-02 |
7.15E-03 |
9.73E-01 |
1.22E+01 |
3.73E-01 |
14.31628 |
|
S30 |
6.29E-01 |
7.67E-02 |
6.88E-03 |
9.78E-01 |
1.22E+01 |
5.47E-01 |
14.48173 |
|
S31 |
7.24E-01 |
6.00E-02 |
5.07E-03 |
9.76E-01 |
7.84E+00 |
1.87E-01 |
9.796033 |
|
S32 |
6.86E-01 |
5.00E-02 |
6.14E-03 |
9.67E-01 |
8.02E+00 |
1.47E-01 |
9.877907 |
|
S33 |
6.29E-01 |
6.67E-02 |
5.32E-03 |
5.56E-02 |
9.51E+00 |
1.47E-01 |
10.41441 |
|
S34 |
6.67E-01 |
8.00E-02 |
6.31E-03 |
6.00E-02 |
1.11E+01 |
2.00E-01 |
12.14691 |
|
S35 |
6.29E-01 |
6.67E-02 |
5.21E-03 |
8.67E-02 |
1.66E+01 |
2.00E-01 |
17.61022 |
|
S36 |
3.62E-01 |
6.13E-02 |
2.29E-03 |
2.44E-02 |
4.98E+00 |
5.07E-01 |
5.934709 |
|
Min. |
3.62E-01 |
1.67E-02 |
2.29E-03 |
2.44E-02 |
4.98E+00 |
1.33E-01 |
5.934709 |
|
Max. |
8.95E-01 |
1.03E-01 |
7.56E-03 |
1.03E+00 |
1.66E+01 |
6.00E-01 |
17.61022 |
|
Avg. |
6.84E-01 |
5.52E-02 |
5.84E-03 |
8.04E-01 |
9.68E+00 |
3.31E-01 |
11.56388 |
|
S.D |
9.82E-02 |
2.13E-02 |
1.31E-03 |
3.36E-01 |
2.73E+00 |
1.36E-01 |
2.746053 |
The findings revealed that the tap water was unfit for human consumption. The aging and degraded network might be responsible for the pollution.
This pollution could be highly attributed to discharging untreated wastewater from many activities (residential, medical, industrial), into the Euphrates River, where Ramadi city is located. In fact, Ramadi city has no wastewater treatment plant, so agricultural drainage, illegal disposal of garbage, and solid waste into Euphrates River banks, where some solid waste including damaged cars and metals due to military operation has increased this pollution.
3.2 Health risk of trace elements
3.2.1 Non carcinogenic risk
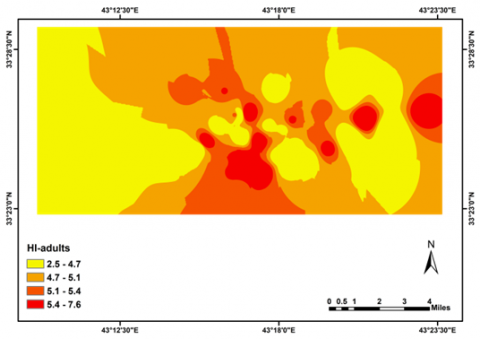
Many researchers, however, realize that estimating health risks related to trace elements based on (TEs) measurements is insufficient and it must be evaluated using other indices [43]. In this study, determined the Cancer Risk and hazard quotient (HQ) were used to determine the (NCR) as (HI) and (CR) of trace elements. Table 6, Figure 9, and Figure 10 summarize the predicted non-carcinogenic risk HQ of trace elements for adults who use tap water in RC. According to Table 6, most HQ trace element values were less than 1 except (As), which is more than 1. HQ of trace element values were in order of As (4.15) > Cr (0.344) > Pb (0.293) > Cd (0.142) > Ni (0.0237) > Fe (0.0025), but (HI) more than (1) due to the high value of (HI) of As, which represents the major (NCR) contributor of adults [25, 34]. The results show that HQ of As values for adults represent the major (NCR) contributor. According to the data of Table 7, Figure 9, and Figure 10, there could be a potential risk on adults' health, so monitoring and management programs are required [44].
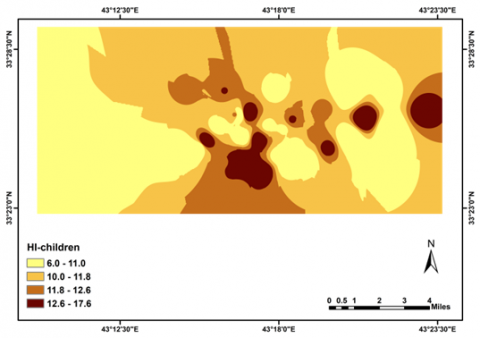
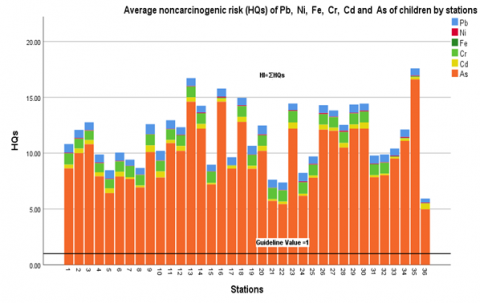
Table 7, Figure 11 and Figure 12 summarize the predicted non carcinogenic risk (HQ) of trace elements for children. According to Table 7, most HQ trace element values were less than one except (As), which is more than 1. The average HQ trace element values were in order of As (9.68) > Cr (0.803) > Pb (0.683) > Cd (0.331) > Ni (0.055) > Fe (0.0058), but HI more than 1, indicating potential risk on human health [34, 35]. The results of Table 7 also show that HQ of As values for children represent the major (NCR) contributor.
The high concentrations, (NCR) and (CR) values of As for both adults and teenagers in taps drinking water of RC are probably generated from anthropogenic activities at the study area, including mainly fossil combustion and application of arsenic-containing fertilizers and pesticides for agricultural purposes natural origins (soil and rocks weathering) [45].
Tables 6 and 7 and Figures 9-12 also demonstrate that children's HI values are roughly twice as high as HI values for adults.
The high (HI) of As represents an extremely high risk to children's health which required strict monitoring and management program are required [44].
Figure 9. Average non-carcinogenic risk (NCR, HQs) and Hazardous Index (HI) of TEs for adults
Figure 10. Average non-carcinogenic risk (NCR, HQs) and Hazardous Index (HI) of TEs for adults
Figure 11. Average non-carcinogenic risk (NCR, HQs) and Hazardous Index (HI) of TEs for children
Figure 12. Average Non-carcinogenic risk (NCR, HQs) and Hazardous Index (HI) of TEs for children
Figure 13. Average carcinogenic risk (CRi) and total carcinogenic risk (CR) of TEs for adults and children
Figure 14. Average carcinogenic risk (CRi) and total carcinogenic risk (CR) of TEs for adults and children
3.2.2 Carcinogenic risk
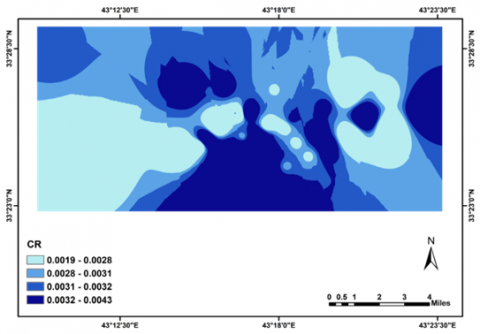
The safe value for (CR) exposed by a (TEs) is 1.00E-06, which means the presence of one cancer case every 1,000,000 people [44]. Table 8, Figures 13 and 14 display the estimated carcinogenic risk CR values of Cd, Cr, As, Ni, and Pb elements in the section study area regarding adults and children. The estimated CR falls within the E-03 to E-06 range. The average CR of trace elements is listed in declining order as follows: AS (1.84E-03)> Ni (7.89E-04) > Cr (5.03E-04) > Cd (2.66E-05)> Pb (8.60E-06). The total average carcinogenic risk was calculated to be 3.19E-03 per capita. As result, the likelihood of developing cancer cases is one in a thousand. Depending on the Classes presented in Table 4, the carcinogenic risk of As is classified as Class VII (extremely high risk), which requires refusing the risk and finding a method to manage it. The carcinogenic risk of Ni and Cr were classified as Class VI (high risk), which require giving importance to the risk and proposing suitable measures to mitigate it. The carcinogenic risk of Cd is classified as Class III (low-medium risk), which does not require care about the risk. The carcinogenic risk of Pb is classified as Class II (low risk), which does not need any care about the risk. The carcinogenic risk of Cd and Pb were ranged within the recommended acceptable range (E-04-E-06), while As, Cr, and Ni were not complying with the recommended by [44], safe value for (CR). The total average CR was Class VII (extremely high risk), which require Refuse the risk and finding a method to manage it [44].
Table 8. Carcinogenic risk (CR) and (Total CR) for adults and children
|
|
Carcinogenic Risk (CR) |
|
||||
|
Stations |
Pb |
Cr |
As |
Cd |
Ni |
Total Risk |
|
S1 |
9.96E-06 |
6.43E-04 |
1.67E-03 |
2.71E-05 |
8.26E-04 |
3.17E-03 |
|
S2 |
9.23E-06 |
5.60E-04 |
1.94E-03 |
3.37E-05 |
1.02E-03 |
3.56E-03 |
|
S3 |
8.99E-06 |
5.31E-04 |
2.08E-03 |
3.04E-05 |
7.29E-04 |
3.38E-03 |
|
S4 |
9.23E-06 |
5.16E-04 |
1.53E-03 |
2.93E-05 |
8.74E-04 |
2.96E-03 |
|
S5 |
9.71E-06 |
5.26E-04 |
1.24E-03 |
3.47E-05 |
6.31E-04 |
2.44E-03 |
|
S6 |
9.47E-06 |
5.94E-04 |
1.53E-03 |
3.47E-05 |
6.80E-04 |
2.84E-03 |
|
S7 |
7.04E-06 |
6.36E-04 |
1.48E-03 |
1.30E-05 |
3.40E-04 |
2.48E-03 |
|
S8 |
7.53E-06 |
6.09E-04 |
1.34E-03 |
1.41E-05 |
4.37E-04 |
2.40E-03 |
|
S9 |
1.14E-05 |
6.24E-04 |
1.95E-03 |
4.89E-05 |
3.89E-04 |
3.03E-03 |
|
S10 |
1.09E-05 |
6.06E-04 |
1.51E-03 |
4.45E-05 |
4.86E-04 |
2.66E-03 |
|
S11 |
9.96E-06 |
6.09E-04 |
2.10E-03 |
2.28E-05 |
5.34E-04 |
3.28E-03 |
|
S12 |
8.50E-06 |
6.17E-04 |
1.96E-03 |
3.58E-05 |
6.80E-04 |
3.30E-03 |
|
S13 |
8.99E-06 |
6.14E-04 |
2.82E-03 |
3.26E-05 |
6.80E-04 |
4.16E-03 |
|
S14 |
7.77E-06 |
6.16E-04 |
2.34E-03 |
3.37E-05 |
8.26E-04 |
3.83E-03 |
|
S15 |
7.53E-06 |
6.59E-04 |
1.39E-03 |
1.09E-05 |
3.40E-04 |
2.41E-03 |
|
S16 |
9.23E-06 |
5.29E-05 |
2.82E-03 |
2.28E-05 |
1.31E-03 |
4.21E-03 |
|
S17 |
8.99E-06 |
3.57E-05 |
1.66E-03 |
1.95E-05 |
2.43E-04 |
1.97E-03 |
|
S18 |
8.50E-06 |
6.16E-04 |
2.46E-03 |
3.69E-05 |
1.02E-03 |
4.14E-03 |
|
S19 |
9.96E-06 |
6.24E-04 |
1.66E-03 |
2.17E-05 |
4.37E-04 |
2.75E-03 |
|
S20 |
1.02E-05 |
6.09E-04 |
1.96E-03 |
3.69E-05 |
9.71E-04 |
3.59E-03 |
|
S21 |
8.99E-06 |
6.47E-04 |
1.11E-03 |
1.19E-05 |
4.37E-04 |
2.21E-03 |
|
S22 |
8.50E-06 |
6.40E-04 |
1.05E-03 |
1.85E-05 |
5.34E-04 |
2.25E-03 |
|
S23 |
7.53E-06 |
6.60E-04 |
2.35E-03 |
4.45E-05 |
1.02E-03 |
4.08E-03 |
|
S24 |
9.71E-06 |
6.54E-04 |
1.19E-03 |
1.52E-05 |
1.17E-03 |
3.04E-03 |
|
S25 |
8.50E-06 |
6.20E-04 |
1.50E-03 |
1.63E-05 |
1.07E-03 |
3.22E-03 |
|
S26 |
8.99E-06 |
6.01E-04 |
2.34E-03 |
3.69E-05 |
1.41E-03 |
4.39E-03 |
|
S27 |
7.04E-06 |
6.03E-04 |
2.32E-03 |
2.28E-05 |
7.29E-04 |
3.68E-03 |
|
S28 |
6.80E-06 |
6.33E-04 |
2.02E-03 |
3.37E-05 |
1.51E-03 |
4.20E-03 |
|
S29 |
9.47E-06 |
6.26E-04 |
2.34E-03 |
3.04E-05 |
9.23E-04 |
3.93E-03 |
|
S30 |
8.01E-06 |
6.29E-04 |
2.36E-03 |
4.45E-05 |
1.12E-03 |
4.16E-03 |
|
S31 |
9.23E-06 |
6.27E-04 |
1.51E-03 |
1.52E-05 |
8.74E-04 |
3.04E-03 |
|
S32 |
8.74E-06 |
6.21E-04 |
1.55E-03 |
1.19E-05 |
7.29E-04 |
2.92E-03 |
|
S33 |
8.01E-06 |
3.57E-05 |
1.83E-03 |
1.19E-05 |
9.71E-04 |
2.86E-03 |
|
S34 |
8.50E-06 |
3.86E-05 |
2.15E-03 |
1.63E-05 |
1.17E-03 |
3.38E-03 |
|
S35 |
8.01E-06 |
5.57E-05 |
3.21E-03 |
1.63E-05 |
9.71E-04 |
4.26E-03 |
|
S36 |
4.61E-06 |
1.57E-05 |
9.60E-04 |
4.13E-05 |
8.94E-04 |
1.92E-03 |
|
Min. |
4.61E-06 |
1.57E-05 |
9.60E-04 |
1.09E-05 |
2.43E-04 |
1.92E-03 |
|
Max. |
1.14E-05 |
6.60E-04 |
3.21E-03 |
4.89E-05 |
1.51E-03 |
4.39E-03 |
|
Avg. |
8.60E-06 |
5.03E-04 |
1.84E-03 |
2.66E-05 |
7.89E-04 |
3.19E-03 |
|
S.D |
1.40E-06 |
2.28E-04 |
5.39E-04 |
1.12E-05 |
3.19E-04 |
7.28E-04 |
In this research, the possible health risks of (DTW) in Ramadi city were assessed. As, Cd, Cr, Ni, Pb and Fe concentrations met standards of drinking water. These concentrations were under allowed levels of the maximum values recommended by the WHO, USEPA and IQS guidelines.
The results regarding Pb and As show that all stations were exceed the allowed levels compared with the (WHO), (USEPA) and (IQS) drinking water guidelines. The results of Ni also show that stations (S2, S16, S18, S23, S24, S25, S26, S28, S30 and S34) were more than the USEPA and IQS drinking water guidelines, while Ni concentrations were within WHO guidelines in all stations.
The Fe and Cr concentrations were complying with WHO, USEPA and IQS drinking water guidelines in all stations. The Cd measurements show that stations (S2, S5, S6, S9, S10, S12, S14, S18, S20, S23, S26, S28, S30, and S36) have exceeded the WHO drinking water guideline, while Cd concentrations were within USEPA and IQS guidelines in all stations. Most HQ values of (TEs) were less than 1 except (As), which is more than 1. The HQ values of trace elements were followed the descending order of As (4.15) > Cr (0.344) > Pb (0.293) > Cd (0.142) > Ni (0.0237) > Fe (0.0025). However, HI was more than 1 so that it could be a potential risk on the human beings' health.
The risk of carcinogenic related to As is classified as Class VII (extremely high risk), which require to refuse the risk and find a method to manage it. The carcinogenic risk of Ni and Cr were classified as Class VI (high risk), which need to pay attention to the risk and propose suitable measures to mitigate it. The carcinogenic risk of Cd is classified as Class III (low-medium risk), which do not require care about the risk. on the other hand, the carcinogenic risk of Pb is classified as Class II (low risk), which do not need any care about the risk. The carcinogenic risk of Cd and Pb were ranged within the recommended acceptable levels (E-04-E-06), while As, Cr and Ni were not complied with those recommended by USEPA [44], safe value for (CR). The total average CR was Class VII (extremely high risk), which requires to refuse the risk and find a method to manage it. Significantly, there was CR in (DTW) of Ramadi city so that local governments should be concerned about. Our recommendations to decrease levels of pollution in RC's taps drinking water sources include,
1) Establishment wastewater treatment plants according to environmental and geographical requirements and prevent any discharge of wastewater and solid waste disposal in water resources.
2) Replacement the old network and implementation new network.
3) Building an effective program to monitor and manage water resources.
4) Efficiency enhancement of the current drinking water treatment projects.
[1] Saleh, H.N., Panahande, M., Yousefi, M., Asghari, F.B., Conti, G.O., Talaee, E., Mohammadi, A.A. (2019). Carcinogenic and non-carcinogenic risk assessment of heavy metals in groundwater wells in Neyshabur Plain, Iran. Biological Trace Element Research, 190(1): 251-261. https://doi.org/10.1007/s12011-018-1516-6
[2] United Nations Educational, Scientific and Cultural Organization (UNESCO). (2021). ''The United Nations World Water Development Report 2021 – VALUING WATER Facts and Figures'' UNESCO World Water Assessment Program. https://unesdoc.unesco.org/ark:/48223/pf0000375751/PDF/375751eng.pdf.multi.
[3] Dashtizadeh, M., Kamani, H., Ashrafi, S.D., Panahi, A.H., Mahvi, A.H., Balarak, D., Hoseini, M., Ansari, H., Bazrafshan, E., Parsafar, F. (2019). Human health risk assessment of trace elements in drinking tap water in Zahedan city, Iran. Journal of Environmental Health Science and Engineering, 17(2): 1163-1169. https://doi.org/10.1007/s40201-019-00430-6
[4] Turdi, M., Yang, L. (2016). Trace elements contamination and human health risk assessment in drinking water from the agricultural and pastoral areas of Bay County, Xinjiang, China. International Journal of Environmental Research and Public Health, 13(10): 938. https://doi.org/10.3390/ijerph13100938
[5] Juan, X.S. (2012). Pollution assessment and control countermeasures of surface drinking water source in Laoshan District of Qingdao. Master's Thesis, Ocean University of China, Qingdao, China.
[6] Gao, B., Li, Q., Zhou, H.D., Gao, J.J., Zou, X.W., Huang, Y. (2014). Application of ICP-MS in the health risk assessment of heavy metals for drinking water sources in reservoirs. Spectroscopy and Spectral Analysis, 34(5): 1398-1402. https://doi.org/10.3964/j.issn.1000-0593(2014)05-1398-05
[7] Ab Razak, N.H., Praveena, S.M., Aris, A.Z., Hashim, Z. (2015). Drinking water studies: A review on heavy metal, application of biomarker and health risk assessment (a special focus in Malaysia). Journal of Epidemiology and Global Health, 5(4): 297-310. https://doi.org/10.1016/j.jegh.2015.04.003
[8] da Araújo, C.F.S., Lopes, M.V., Vasquez, M.R., Porcino, T.S., Ribeiro, A.S.V., Rodrigues, J.L.G., do Prado Oliveira, S.S., Menezes-Filho, J.A. (2016). Cadmium and lead in seafood from the Aratu Bay, Brazil and the human health risk assessment. Environmental Monitoring and Assessment, 188(4): 259. https://doi.org/10.1007/s10661-016-5262-y
[9] Zhu, P., Liang, X., Wang, P., et al. (2016). Assessment of dietary cadmium exposure: A cross-sectional study in rural areas of south China. Food Control, 62: 284-290. https://doi.org/10.1016/j.foodcont.2015.10.046
[10] Kumar, M., Rahman, M.M., Ramanathan, A., Naidu, R. (2016). Arsenic and other elements in drinking water and dietary components from the middle Gangetic plain of Bihar, India: Health risk index. Science of The Total Environment, 539: 125-134. https://doi.org/10.1016/j.scitotenv.2015.08.039
[11] Xie, Z., Zhang, H., Zhao, X., Du, Z., Xiang, L., Wang, W. (2016). Assessment of heavy metal contamination and wetland management in a newly created coastal natural reserve, China. Journal of Coastal Research, 318: 374-386. https://doi.org/10.2112/jcoastres-d-14-00222.1
[12] Azizullah, A., Khattak, M.N.K., Richter, P., Häder, D.P. (2011). Water pollution in Pakistan and its impact on public health - A review. Environment International, 37(2): 479-497. https://doi.org/10.1016/j.envint.2010
[13] Alimoradi, J., Naghipour, D., Kamani, H., Asgari, G., Naimi-Joubani, M., Ashrafi, S.D. (2018). Data on corrosive water in the sources and distribution network of drinking water in north of Iran. Data in Brief, 17: 105-118. https://doi.org/10.1016/j.dib.2017.12.057
[14] Farokhneshat, F., Rahmani, A.R., Samadi, M.T., Soltanian, A.R. (2016). Non-carcinogenic risk assessment of heavy metal of lead, chro-mium and zinc in drinking water supplies of Hamadan in winter 2015. Avicenna Journal of Clinical Medicine, 23(1): 25-33.
[15] Ji, Y., Wu, J., Wang, Y., Elumalai, V., Subramani, T. (2020). Seasonal variation of drinking water quality and human health risk assessment in Hancheng City of Guanzhong Plain, China. Exposure and Health, 12(3): 469-485. https://doi.org/10.1007/s12403-020-00357-6
[16] UNICEF, MENA report. (2021). Running dry: The impact of water scarcity on children in the Middle East and North Africa’. https://www.unicef.org/mena/press-releases/running-dry-unprecedented-scale-and-impact-water-scarcity-middle-east-and-north.
[17] Iraqi Ministry Planning, Central Statistical Organization (2019). Environmental statistics for Iraq, health indicators report.
[18] Benhaddya, M.L. (2020). Human health risk assessment of heavy metals from surface water of Chott Merouane, Algeria. International Journal of Environmental Analytical Chemistry. https://doi.org/10.1080/03067319.2020.1751145
[19] Liu, Y., Ma, R. (2020). Human health risk assessment of heavy metals in groundwater in the Luan river catchment within the north China Plain. Geofluids, 2020: 8391793. https://doi.org/10.1155/2020/8391793
[20] Al-Hussaini, S.N.H., Al-Obaidy, A.H.M.J., Al-Mashhady, A.A.M. (2018). Environmental assessment of heavy metal pollution of Diyala River within Baghdad City. Applied Water Science, 8(3): 87. https://doi.org/10.1007/s13201-018-0707-9
[21] Salah, E., Turki, A., Noori, S. (2013). Heavy metals concentration in urban soils of Fallujah City, Iraq. Journal of Environment and Earth Science, 3(11): 100-112. https://doi.org/10.4236/jep.2015.611112
[22] Hassoon, H.A. (2018). Heavy metals contamination assessment for some imported and local vegetables. Iraqi Journal of Agricultural Sciences, 49(5): 794-802. https://doi.org/10.36103/ijas.v49i5.39
[23] Ahmed, S.S., Hasan, M.A. (2019). Determination of headetermination of some heavy metals in three fish species from duhok city markets in Kurdistan of Iraq. Science Journal of University of Zakho, 7(4): 152-157. https://doi.org/10.25271/sjuoz.2019.7.4.621
[24] WHO Library Cataloguing-in-Publication Data, Geneva. WHO (World Health Organization). (2017). Guidelines for Drinking- Water Quality: Fourth Edition Incorporating First Addendum. WHO Library Cataloguing-in-Publication Data. World Health Organization, Geneva, Switzerland. Available from: https://apps.who.int/iris/bitstream/handle/10665/254637/9789241549950-eng.pdf?sequence=1.
[25] Ahmed, N.A., Mahmood, T.S. (2020). Change in land-uses of Ramadi city and its influence on public transportation sustainability. IOP Conference Series: Materials Science and Engineering, 881: 012175. https://doi.org/10.1088/1757-899x/881/1/012175
[26] Ramal, M.M., Jalal, A.D., Abdulhameed, U.H. (2021). Heavy metal assessment in taps drinking water of Ramadi city using water quality Indices, Anbar Province, Iraq. International Journal of Sustainable Development and Planning, 16(7): 1349-1357. https://doi.org/10.18280/ijsdp.160715
[27] APHA. (2012). Standard Methods for the Examination of Water and Wastewater, 22nd edn. American Public Health Association, Washington, DC.
[28] Mirzabeygi, M., Abbasnia, A., Yunesian, M., Nodehi, R.N., Yousefi, N., Hadi, M., Mahvi, A.H. (2017). Heavy metal contamination and health risk assessment in drinking water of Sistan and Baluchistan, Southeastern Iran. Human and Ecological Risk Assessment: An International Journal, 23(8): 1893-1905. https://doi.org/10.1080/10807039.2017.1322895
[29] Zhang, Y., Chu, C., Li, T., Xu, S., Liu, L., Ju, M. (2017). A water quality management strategy for regionally protected water through health risk assessment and spatial distribution of heavy metal pollution in 3 marine reserves. Science of the Total Environment, 599: 721-731. https://doi.org/10.1016/j.scitotenv.2017.04.232
[30] Environmental Protection Agency EPA. (1989). Risk Assessment Guidance for Superfund, vol. I. Part A: Human Health Evaluation Manual; 1989. https://www.epa.gov/sites/production/files/2015- 09/documents/rags_a.pdf.
[31] Li, F., Qiu, Z., Zhang, J., Liu, C., Cai, Y., Xiao, M. (2017). Spatial distribution and fuzzy health risk assessment of trace elements in surface water from Honghu Lake. International Journal of Environmental Research and Public Health, 14(9): 1011. https://doi.org/10.3390/ijerph14091011
[32] Dummee, V., Kruatrachue, M., Trinachartvanit, W., Tanhan, P., Pokethitiyook, P., Damrongphol, P. (2012). Bioaccumulation of heavy metals in water, sediments, aquatic plant and histopathological effects on the golden apple snail in Beung Boraphet reservoir, Thailand. Ecotoxicology and Environmental Safety, 86: 204-212. https://doi.org/10.1016/j.ecoenv.2012.09.018
[33] Wang, N., Wang, A., Kong, L., He, M. (2018). Calculation and application of Sb toxicity coefficient for potential ecological risk assessment. Science of the Total Environment, 610: 167-174. https://doi.org/10.1016/j.scitotenv.2017.07.268
[34] Huang, X., He, L., Li, J., Yang, F., Tan, H. (2015). Different choices of drinking water source and different health risks in a rural population living near a lead/zinc mine in Chenzhou City, southern China. International Journal of Environmental Research and Public Health, 12(11): 14364-14381. https://doi.org/10.3390/ijerph121114364
[35] USEPA. (2010). United States Environmental Protection Agency, Integrated Risk Information System (IRIS), Washington, DC, USA.
[36] US EPA. (2004). Risk assessment guidance for superfund. Volume I: Human Health Evaluation Manual (Part E, Supplemental Guidance for Dermal Risk Assessment) Washington, DC. https://www.epa.gov/risk/risk-assessment-guidance-superfundrags- part-e.
[37] Kamani, H., Mahvi, A.H., Seyedsalehi, M., Jaafari, J., Hoseini, M., Safari, G.H., Dalvand, A., Aslani, H., Mirzaei, N., Ashrafi, S.D. (2017). Contamination and ecological risk assessment of heavy metals in street dust of Tehran, Iran. International Journal of Environmental Science and Technology, 14(12): 2675-2682. https://doi.org/10.1007/s13762-017-1327-x
[38] Nkpaa, K.W., Patrick-Iwuanyanwu, K.C., Wegwu, M.O., Essien, E.B. (2016). Health risk assessment of hazardous metals for population via consumption of seafood from Ogoniland, Rivers State, Nigeria; a case study of Kaa, B-Dere, and Bodo City. Environmental Monitoring and Assessment, 188(1): 188. https://doi.org/10.1007/s10661-015-5006-4
[39] Adimalla, N. (2020). Heavy metals contamination in urban surface soils of Medak province, India, and its risk assessment and spatial distribution. Environmental Geochemistry and Health, 42(1): 59-75. https://doi.org/10.1007/s10653-019-00270-1
[40] Mao, X.L., Liu, Y.S. (2003). Research progress on environmental risk assessment home and abroad. Scientific Journal of Application Foundation and Engineering, 11(3): 266-273.
[41] Council of Ministers Central Agency for Meteorology and Quality Control. (2001). Iraqi Drinking water Standards No.417/2001, IQS 417/2001.
[42] USEPA. (2018). United States Environmental Protection Agency. Drinking Water Standards and Health Advisories (DWSHA), Washington, DC, USA https://www.epa.gov/sites/default/files/2018-03/documents/dwtable2018.pdf.
[43] Ibrahim, N. (2015). Health risk assessment of heavy metals and their source apportionment in drinking water of Zulfi District, North-West of Riyadh Region. Pinnacle Environmental and Earth Sciences, 2(3): 879-884.
[44] USEPA (2015). United States Environmental Protection Agency. Risk Based Screening Table-Generic, Summary Table, Washington, DC, USA.
[45] Ungureanu, G., Santos, S., Boaventura, R., Botelho, C. (2015). Arsenic and antimony in water and wastewater: overview of removal techniques with special reference to latest advances in adsorption. Journal of Environmental Management, 151: 326-342. https://doi.org/10.1016/j.jenvman.2014.12.051