Shrikant Kokate* | Manna Sheela Rani Chetty
© 2021 IIETA. This article is published by IIETA and is licensed under the CC BY 4.0 license (http://creativecommons.org/licenses/by/4.0/).
OPEN ACCESS
In banking sector credit score plays a very important factor. It is important to find which customer is valid and which is not valid for loan. Now to classify customer’s credit score is used. Based on this credit score of customers the bank will decide whether to approve loan or not. In banks there are major failures due to credit risks. We can automate this by using various Machine learning algorithms to identify loan defaulters. To classify and predict the customers here various Machine learning techniques like gradient boosting, random forest and Feature Selection technique along with Decision Tree are used. Using these algorithms we accurately classify valid and invalid customers for loan. Designed model can classify their customers into good and bad applicants and train the model for getting the better accuracy of the customer data.
credit risk, loan defaulters, machine learning, decision tree, ensemble learning, gradient boosting, voting classifier
Exponential development in computational capacity and its power has resulted in to the generation of large databases. Data mining technique is known as a Knowledge Discovery from large amount of Data. It is technique of auto-extraction of different data patterns from large amounts of knowledge data. The KDD process consists of certain steps like data cleaning, integration, selection, transformation, mining, and knowledge representation. Data mining is the process of KDD in databases in which is used to extract useful patterns, to extract these useful patterns we use intelligent techniques.
In loan lending system credit score loan of borrower’s credit worthiness is one of the most important issues to be addressed in the commercial banks. As all assets are not equally magnitude in the sanction loans there is possibility of recovery analysis of loan based on risk assessment [1]. To reduce illegal activities in banking industry and to avoid the potential risk credit scoring model is used. There are different types of credit risk like credit spread risk which occurs due to variation in interest rates, concentration risk occurs due to high exposure to any industry, default risk is occurred due to borrower unable to repay the loan amount. Here, default risk in credit transactions is identified as risk which loans customers will unable to repay fail to achieve their repay commitments. Risk management is process to identify, evaluate and prioritize of risks subsequently by financial application of assets to reduce, track and identify the probability or effect of inappropriate incidents or to gain the cognizance of opportunities [2, 3].
Risk in credits can have different sources. Risk identification and its measurement can help the bank entities to control the financial losses in future the definition of 'risk' has changed over years. In the beginning, it was only pure risk. Subsequent to globalization, it led to financial engineering and brought in financial instruments which looked very attractive but were opaque [4, 5]. There four different methods to identify the credit risk [6]. First method is financial statement analysis method, this method identifies the potential risk and analyse the financial budget to forecast the financial situation. Second method is flow graph analysis which is used to investigate each stage of the transaction or operation to identify the risk. The third method is field investigation, in this method investigator conduct the filed survey to identify the root cause of the risk and track the flow. The fourth method statistical analysis method, here in this method the prediction of the future potential risk is identified based on existing risks. Risk cannot be removed completely to the 100%, so need to take the efforts reduce the credit risk by assessment of the loan defaulter’s risks [7, 8]. In the commercial banks success and failure are based on their risks. If the credits are not repaid properly from borrowers, then the bank will loosen its own credit. So, a bank's own operating gain is connected to risks in credits. Score of credit operations is divided into two group applicants and behavioral scoring. Behavioral scoring is used to get the classification of present bank customers as per their historical payment data and bank information, whereas Customer score is used to classified the applicant into defaulter or non-defaulter groups through decision tree classifier [9].
Decision tree, Logistic Regression, Random Forest is compared in this paper to identify loan defaulters. Recursive Features with Cross-Validation and PCA has been used for dimensional reduction analysis. Different metrics to measure the performance such as accuracy, AUC score, F1 score, recall and precision referred to evaluate designed model in this paper. Out of all models from Decision tree, Logistic Regression, Random Forest the combination of algorithms cross validation based method of recursive feature elimination is proved as good results to identify loan defaulters but the this technique ignore the noise and variance which is removed in proposed system using ensemble method [10, 11].
In real time loan borrowing scenario, the probability of “loan default” and “non-default” samples is highly imbalanced in nature. Hence, this paper proposed ensemble learning with a pre-assessment phase for the imbalanced data of commercial banks. The structure can learn on its own and adjust the dataset structure spontaneously through the “data shunt”, which can simplify the complex structure and accuracy improvement in the model and minimize the parameters to accomplish the goal by minimizing operational costs and non performing debit rates of the banks [12].
Prediction of credit loan defaulters is highly challenging task for the commercial banks due to highly increasing demands and borrow of the loans. It requires significant amount of data, system capability and skills to build the unbiased model for prediction. Having good loan status is considered as one important quality parameter in the loan borrowing process. It does not reflect immediately within process, but it is the initial phase of the loan borrowing. The status of loan is referred as one of the metric to generate credit score prediction model. The credit score prediction model gives accurate results of credit borrowed by the customers and its repayments. This model is used to find defaulters and non-defaulter customers [13, 14]. In peer lending is an emerging option as micro or small finance now days in commercial banks. However, this lending possesses has probability of failed because of poor knowledge of loan customers’ credit worthiness. In addition to this, asymmetric information of the customer, the unsecure type of loan borrowers and non-strict actions and procedures of the bank increase the risk in credits in the associate lending. Paper highlights on neural network based credit score model. The classification is based on associate loan customers grouped into defaulter and non-defaulter group [15].
Banks has the huge stake to give the credit loan to its clients. To compensation the credit acquired from the investor bank, bank applies the premium done by the principle lenders. Credit risk is a notable field in financial risk management. Many credit risk identification methods are utilized for the assess credit risk of the credit dataset [16, 17].
Data Mining is a process of extraction of concealed information from huge size of data. The computing complexity of algorithms used in data mining increased quickly due to quantity of features present in dataset increments. Physical world dataset of credit score has gathered enormous amounts of data about customers and their payment and financial transactions. Feature selection methods are utilized based on very high magnitude data to minimize the magnitude by eliminating unnecessary and excess features to boost the predictive accuracy of data mining algorithms [18, 19].
This paper presents a support vector machine based classification model to analyze the capability of undertakings paying debt, minimize the risk advanced loans. Initially this paper presents the important concept of support vector machines which set up classification model, based on classical data [20].
Decision making is achieved by predictive methodologies created by different machine learning methods. This paper examines the usage logistic regression tool based on probabilistic and predictive approach to desired problem of loan approval prediction [21, 22].
The classification performance of different models highlighted in this paper: logistic regression (LR), case-based reasoning (CBR), neural network (NN), radial basis function neural network (RBFNN) outspread premise work neural organization (RBFNN), three decision trees (DTs), support vector machine (SVM). Here model is built and tested with classification accuracy on data given by germen financial institution [23]. Data Mining is a very prominent field of information mining that intends to take out valuable information from large size of complex dataset. Here model is built and prototype is developed for a similar dataset available UCI archive. The model is classification model based on decision tree that utilizes the functions accessible in the R repository. Prior to model building, the data is prepossessed, reduced and prepared to give appropriate prediction. The model is then used on test dataset and generates test results to predict accuracy of the model built [24].
This paper includes study of prediction algorithms and suggests a method called meta-learning, that helps in selecting an appropriate algorithm by using data characteristics such as simple data characteristics, information theoretic data characteristics and statistical data characteristics. Meta-learning provides the assistance to train and optimises the other machine learning models. It has two training processes. Model is trained after few steps of base model have been carried out [25, 26].
Achieving good credit scores are useful for clients from multiple points of view and it provides the opportunity to banks to study bank customers and provides the credit loans to customers as per procedures. Paper mentioned that data mining procedures are helpful to classify and predict the client's credit score bad or good to reduce the upcoming risks credits to customers who did not repay loan. Paper uses historical dataset of a bank for predictive modeling as general models, the banks then utilizes them for good result of their general credit score model [27, 28].
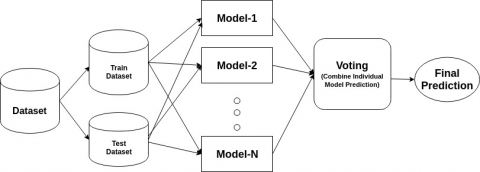
The proposed model (Figure 1) focuses on predicting loan defaulters takes the data from the dataset with it attributes as labeled observations. The data set is split into two sections training dataset and testing dataset. The model is trained using gradient boosting based voting classifier as explained in the paper. The cross-fold validation technique is used split the data into train-test split. Test set data is then used for prediction and classification of loan defaulters. The decision tree represents the status of loan defaulter. Further the classification input is given to gradient boosting and voting classifier based ensemble learning for improves the accuracy of the model. On given dataset, pre-processing will be applied and new pre-processed data set is used further to build the model.
Figure 1. Proposed methodology
4.1 Dataset
The standard dataset is referred from the UCI machine learning repository group (https://archive.ics.uci.edu). This dataset is dataset of loan defaulters. It has total 13 different attributes mentioned as follows.
4.2 Data pre-processing
For example:
mean_loan=df['LoanAmount'].mean()
df["LoanAmount"].fillna(mean_loan, in
place=True)
For example:
|
Property_Area |
(Label Encoding) |
|
Urban |
2 |
|
Semiurban |
1 |
|
Rural |
0 |
5.1 Decision tree
The decision tree is a graphical representation of roots (choices) with their leaves (results) in the form of a tree. The event in the graph is nothing but a node and the edges are decision rules. The name ‘Decision Tree’ tells us that it builds a tree structure and learns the tree structure through the built model. Decision tree is just like a flowchart and it consists of logical decisions. Further the logical decisions split into branches that indicate choices. The combination of decisions is denoted by leaf nodes which are the termination point of decision tree. A decision tree is tree with one root node, and multiple number of internal and leaf nodes. Every leaf node represents a class level attribute. Each internal node in a decision tree is divide into multiple child nodes based on the number of distinct child nodes to obtain the classification rules.
Steps to follow in Decision Tree:
Step 1: Identify the class level attribute by analyzing the dataset.
Step 2: Classification based on train and test dataset.
Step 3: Decision tree can build based on training dataset.
Step 4: Build tree again after the tree pruning process.
Step 5: Derive the classification based on pruned tree.
Step 6: Generate the rules and output based on input test data.
5.2 Gradient boosting
In any machine learning technique if try to analyses target variable value, the main reason in variation in predicted and actual values are variance, noise and bias. Ensemble learning help to minimize the factors like noise, variance, and bias except noise (irreducible error). An ensemble learning is a group of predictor values that is the mean of all predictors. The mean of all predictor values gives a final prediction value. We use Ensemble learning in which many predictor values try to predict same target variable value. These many predictor values having better performance than a single predictor value to predict the target variable. Ensemble techniques are classified as boosting and bagging techniques. In boosting technique the consequent predictors learn from the mistakes of the preceding predictors. Thus, the observations have an unequal probability of appearing in consequent models and ones with the superlative error appear the max. The predictors are chosen from different models like classifiers, decision trees etc. The predictors are chosen from different models as new predictor values learn from past mistakes done by preceding predictor values, this takes less iterations to reach to close actual predictors. But, choosing stopping criteria is very important here as it edge to over fitting of data. Gradient boosting algorithm is a technique for regression and classification problems. This technique produces model of weak predicted values for ensemble learning usually decision trees. Boosting defines the loss function and minimizes it.
5.3 Voting classifier
The intention of voting classifier algorithm is to merge concept based multiple machine learning techniques and the it applies a highest weighted vote or average of predicted probabilities referred as a soft vote to predict the dataset class labels. Voting classifier is very beneficial for group of equivalent performing models to stabilize each individual weaknesses mentioned in algorithm [29].
Algorithm – 1) Training of voting records on various multiple machine learning classifiers like random forest decision tree and gradient boosting Classifiers [30].
2) Based on classification samples count the majority vote.
3) Majority vote is used to control over-fitting and improve the predictive accuracy.
To stabilize the distribution of class labels special technique is applied over sampling technique called SMOTE - Synthetic Minority Oversampling Technique on imbalanced dataset. The best method for over sampling is Synthetic over sampling, in which new synthetic samples are generated [31, 32].
6.1 Best feature selection
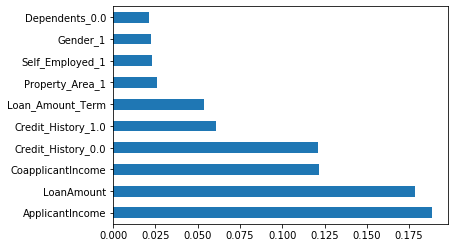
Feature Selection is the technique where we select best features from our dataset. Irrelevant can make model learn based on non-relevant features and also reduce the accuracy of the models. There are various methods for feature selection we use Feature Importance method which gives score of each feature where the feature having highest score is more important towards our predicted variable. Here in Figure 2 (below) ApplicantIncome, LoanAmount, CoapplicantIncome, CreditHistory and Loan_Amount_Term are more important towards Loan_Status that is output variable. The features here explain about the occurrence of the attribute using feature importance method the features are selected based on the value of occurrence here, attribute having feature value 0.050 and above are considered for the dataset. This is useful technique to remove the non-relevant attribute which further enhance the accuracy of the model.
Figure 2. Feature importance method
6.2 Confusion matrix
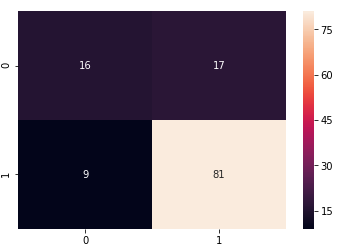
Confusion Matrix is an error matrix which shows the performance of classification model. Correct and incorrect predictions are summarized by using confusion matrix with their count.
Figure 3. Confusion Matrix for y_Test and X_Pred Values
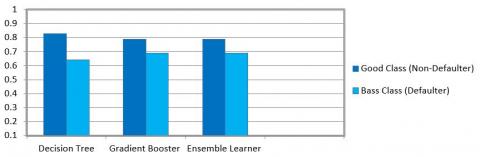
The precision is the proportion of correctly classified true positive value (TP) to the ratio of sum of true positive value (TP) and false positive value (FP) as mentioned in Figure 3 and Table 1. For No (Bad) class it gives precision as 0.64 and for Yes (good) class it gives precision as 0.83 for decision tree algorithm. Similarly for gradient boosting and ensemble learner for No (Bad) class it gives precision as 0.69 and for Yes (good) class it gives precision as 0.79. The result is shown in Figure 4 mentioned below.
Table 1. Prediction term and values
|
Prediction Terms |
Value |
|
True Positive (TP) |
16 |
|
False Negative (FN) |
17 |
|
True Negative (TN) |
81 |
|
False Positive (FP) |
09 |
6.3 Classification report
The recall is the proportion of correctly classified true positive (TP) value to the ratio of sum of true positive value (TP) and false negative value (FN). For No (Bad) class it gives recall as 0.48 and for Yes (good) class it gives recall as 0.90 for decision tree algorithm. Similarly for gradient boosting and ensemble learner No (Bad) class it gives recall as 0.50 and for Yes (good) class it gives precision as 0.89. The result is shown in Figure 5 mentioned below.
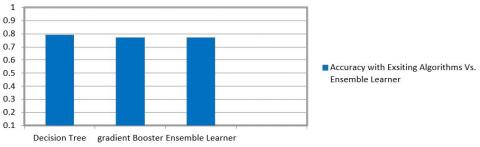
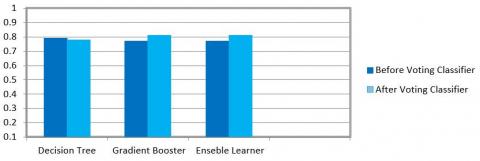
The accuracy is the percentage of accurate predictions for the test data. It is the ratio of number of correct predictions by the total predictions as mentioned in Table 2. The accuracy of decision tree is 0.79 whereas the accuracy of gradient booster and ensemble learner is 0.77. The result is shown in Figure 6 mentioned below. The ensemble learner will merge the multiple classifier together here decision tree and gradient booster will trained as ensemble learner. Voting classifier algorithm is applied to merge decision tree and gradient booster machine learning techniques and the it applies a highest weighted vote or average of predicted probabilities referred as a soft vote to predict the dataset class labels. The accuracy of the predicted model of decision tree after applying voting classifier is 0.78 whereas the accuracy of gradient and ensemble learner is 0.81. The model works significantly well after the voting classifier. The result is shown in Figure 7 mentioned below.
Performance Metrics:
Precision = TP/TP+FP (1)
Recall = TP/TP+FN (2)
Accuracy = TP+TN/TP+FP+FN+TN (3)
where, TP – True Positive, FP – False Positive, TN – True Negative, FN – False Negative.
Table 2. Classification report
|
Classifiers Vs. Metrics |
Decision Tree |
Gradient Booster |
Ensemble Learning |
|
Precision (N) |
0.64 |
0.69 |
0.69 |
|
Precision (Y) |
0.83 |
0.79 |
0.79 |
|
Recall (N) |
0.48 |
0.50 |
0.50 |
|
Recall (Y) |
0.90 |
0.89 |
0.89 |
|
Accuracy |
0.79 |
0.77 |
0.77 |
|
Accuracy (After Voting Classifier) |
0.78 |
0.81 |
0.81 |
Figure 4. Performance metrics: With precision
Figure 5. Performance metrics: With recall
Figure 6. Performance metrics: With accuracy
Figure 7. Performance metrics: Accuracy before and after voting classifier
6.4 ROC curve
The measurement of the performance is a very important task in Machine learning. In classification problems we can measure on an AUC and ROC curve. AUC and ROC curve is used to check the performance of multi-classification problem. To check classification model’s performance AUC and ROC curve is an important metrics. AUC is nothing but Area under the Receiver Operating Characteristics. If value of AUC is higher the model is better at prediction of 0’s as 0’s and 1‘s as 1’s. ROC curve represents TPR against FPR. The trained model which is near to 1 is known to be excellent model, which means it has a very good measurement of separability. AUC near to zero means a poor model, which means it has worst measure of separability. When AUC is 0.5 means there is no class separation capacity whatsoever. The (TPR) True Positive Rate is the ratio of correctly classified (TP) True Positive examples to the ratio of sum of (TP) true Positive and (FN) False Negative. The False Positive Rate (FPR) is the ratio of incorrectly classified (FP) False Positive examples to the ratio of sum of (TN) True Negative and (FP) False Positive. The ROC curve in Figure 8 concludes that the model works excellent and shows the great performance of classification models all thresholds.
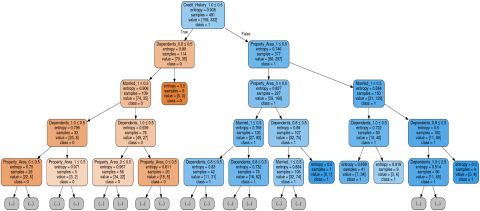
6.5 Shaping final decision tree
A decision tree is having similar structure like tree which includes possible answers for subject depend on particular requirements. As its name suggests it began with one choice or root, which one point divides into its different leaves or branches until the point that a choice or forecast is made, shaping a final tree [21].
In Figure 9 below Decision Tree is represented as a root node because it has highest entropy that is 0.908 which is nothing but measure of disorder for samples from dataset. The “Credit_History” node has two more branches (Dependents_0.8 & Property_Area_1). Leaf node represents decision which is applicant is applicable or not for loan. Further branches are classified into status, income, loan amount co-applicant income and its history. Tree is built using above features and algorithm traverse each point and goes across the decision tree taking left or right node features.
Figure 8. ROC curve
This paper explained about credit score model is designed to predict and analyses the loan applicant whether the respective applicant is loan defaulter or non-defaulter or good or bad applicant in banking terms. The credit score model based on the credit history predicts the status of the loan. In this model various classifiers such as Decision Tree are compared with voting classifier based Gradient Boosting learner model. The decision tree algorithm in this model gives an accuracy of 80%. Further Gradient Boosting with voting classifier algorithm is trained and used to enhance the accuracy of the model. The ensemble learner will merge the multiple classifiers together here decision tree and gradient booster will be trained as ensemble learner. Voting classifier algorithm is applied to merge decision tree and gradient booster machine learning techniques and it applies a highest weighted vote or average of predicted probabilities referred as a soft vote to predict the dataset class labels. This model can be used in generalized commercial applications of banks that provide the loan and analyze the loan defaulter’s data to avoid the bankruptcy in future years. As this model can classify their customers into good and bad applicants and train the model for getting the better accuracy of the customer data.
Figure 9. Shaping the final decision tree
[1] Subramanyam, K.S.L.N.S., Murthy, A.V.N. (2019). Financial frauds of financial performance of banking industry. International Journal of Innovative Technology and Exploring Engineering, 8(12): 4578-4584.
[2] Abhigna, R.S., Sandeep, V., Krishna, B.C. (2019). Analysis of risk management though qualitative approach. International Journal of Innovative Technology and Exploring Engineering, 8(6): 128-132.
[3] Jency, X.F., Sumathi, V.P., Sri, J.S. (2018). An exploratory data analysis for loan prediction based on nature of the clients. International Journal of Recent Technology and Engineering (IJRTE), 7(4): 17-23.
[4] Shree Jyoti, D., Srinivasa Rao, D. (2019). Financial risk quantification of Indian agro-commodities using value at risk. International Journal of Engineering and Advanced Technology, 8(6): 5138-5144.
[5] Hariharan, B.R., Shailaja, V.N., Patel, K.V. (2017). A Study of Disclosures on Risk Management of Insurance Companies inn India. Indian Journal of Finance, 11(1): 29-43.
[6] Rudra Kumar, M., Kumar Gunjan, V. (2020). Review of machine learning models for credit scoring analysis. Ing. Solidar, 16(1): 1-16. https://doi.org/10.16925/2357-6014.2020.01.11
[7] Nagamalleswari, D., Nagalakshmi, J., Karthik, G., Harthitha, P. (2018). A Study of risk assessment techniques in information systems. International Journal of Engineering and Technology (UAE), 7(Sp.18): 473-482. https://doi.org/10.14419/ijet.v7i1.1.9711
[8] Hamid, A.J., Ahmed, T.M. (2016). Developing prediction model of loan risk in banks using data mining. Machine Learning and Applications: An International Journal (MLAIJ), 3(1): 1-9. https://doi.org/10.5121/mlaij.2016.3101
[9] Madane, N., Nanda, S. (2019) Loan prediction analysis using decision tree. Journal of the Gujarat Research Society 21: 214-221.
[10] Shoumo, S.Z.H., Dhruba, M.I.M., Hossain, S., Ghani, N.H., Arif, H., Islam, S. (2019). Application of machine learning in credit risk assessment: A prelude to smart banking. In TENCON 2019-2019 IEEE Region 10 Conference (TENCON), pp. 2023-2028. https://doi.org/10.1109/TENCON.2019.8929527
[11] Ahmed, M.I., Rajaleximi, P.R. (2019). An empirical study on credit scoring and credit scorecard for financial institutions. International Journal of Advanced Research in Computer Engineering & Technology (IJARCET), 8(7): 275-279.
[12] Morina, F., Özen, E. (2020). Does the commercial bank's loans affect economic growth? Empirical evidence for the real sector economy in Kosovo (2005-2018). International Journal of Sustainable Development and Planning, 15(8): 1205-1222. https://doi.org/10.18280/ijsdp.150807
[13] Arutjothi, G., Senthamarai, C. (2017). Prediction of loan status in commercial bank using machine learning classifier. In 2017 International Conference on Intelligent Sustainable Systems (ICISS), pp. 416-419. https://doi.org/10.1109/ISS1.2017.8389442
[14] Babu, R., Satish, A.R. (2013). Improved of k-nearest neighbour techniques in credit scoring. International Journal for Development of Computer Science & Technology, 1(2): 1-4.
[15] Byanjankar, A., Heikkilä, M., Mezei, J. (2015). Predicting credit risk in peer-to-peer lending: A neural network approach. In 2015 IEEE Symposium Series on Computational Intelligence, pp. 719-725. https://doi.org/10.1109/SSCI.2015.109
[16] Pandey, T.N., Jagadev, A.K., Mohapatra, S.K., Dehuri, S. (2017). Credit risk analysis using machine learning classifiers. In 2017 International Conference on Energy, Communication, Data Analytics and Soft Computing (ICECDS), pp. 1850-1854. https://doi.org/10.1109/ICECDS.2017.8389769
[17] Dai, Z., Zheng, Y., Li, A., Qian, G. (2021). The application of machine learning in bank credit rating prediction and risk assessment. 2021 IEEE 2nd International Conference on Big Data, Artificial Intelligence and Internet of Things Engineering (ICBAIE), pp. 986-989. https://doi.org/10.1109/ICBAIE52039.2021.9389901
[18] Ramya, R.S., Kumaresan, S. (2015). Analysis of feature selection techniques in credit risk assessment. In 2015 International Conference on Advanced Computing and Communication Systems, pp. 1-6. https://doi.org/10.1109/ICACCS.2015.7324139
[19] Vojtek, M., Koèenda, E. (2006). Credit-scoring methods. Czech Journal of Economics and Finance (Finance a uver), 56(3-4): 152-167.
[20] Ma, Y., Liu, H. (2010). Research of SVM applying in the risk of bank's loan to enterprises. In 2010 2nd International Conference on Information Engineering and Computer Science, pp. 1-5. https://doi.org/10.1109/ICIECS.2010.5678225
[21] Vaidya, A. (2017). Predictive and probabilistic approach using logistic regression: Application to prediction of loan approval. In 2017 8th International Conference on Computing, Communication and Networking Technologies (ICCCNT), pp. 1-6. https://doi.org/10.1109/ICCCNT.2017.8203946
[22] Zhu, L., Qiu, D., Ergu, D., Ying, C., Liu, K. (2019). A study on predicting loan default based on the random forest algorithm. Procedia Computer Science, 162: 503-513. https://doi.org/10.1016/j.procs.2019.12.017
[23] Zurada, J. (2010). Could decision trees improve the classification accuracy and interpretability of loan granting decisions. In 2010 43rd Hawaii International Conference on System Sciences, pp. 1-9. https://doi.org/10.1109/HICSS.2010.124
[24] Sudhamathy, G., Venkateswaran, C.J. (2016). Analytics using R for predicting credit defaulters. In 2016 IEEE International Conference on Advances in Computer Applications (ICACA), pp. 66-71. https://doi.org/10.1109/ICACA.2016.7887925
[25] Anila, M., Pradeepini, G. (2017). Study of prediction algorithms for selecting appropriate classifier in machine learning. Journal of Advanced Research in Dynamical and Control Systems, 9: 257-268.
[26] Supriya, P., Pavani, M., Saisushma, N., Kumari, N.V., Vikas, K. (2019). Loan prediction by using machine learning models. International Journal of Engineering and Techniques, 5(22): 144-148.
[27] Gahlaut, A., Singh, P.K. (2017). Prediction analysis of risky credit using data mining classification models. In 2017 8th International Conference on Computing, Communication and Networking Technologies (ICCCNT), pp. 1-7. https://doi.org/10.1109/ICCCNT.2017.8203982
[28] Alshouiliy, K., AlGhamdi, A., Agrawal, D.P. (2020). AzureML based analysis and prediction loan borrowers creditworthy. 2020 3rd International Conference on Information and Computer Technologies (ICICT), pp. 302-306. https://doi.org/10.1109/ICICT50521.2020.00053
[29] Sajana, T., Narasingarao, M.R. (2006). An ensemble framework for classification of malaria disease. ARN Journal of Engineering and Applied Sciences, 13(9): 3299-3307.
[30] Ghatasheh, N. (2014). Business analytics using random forest trees for credit risk prediction: A comparison study. International Journal of Advanced Science and Technology, 72(2014): 19-30. https://doi.org/10.14257/ijast.2014.72.02
[31] Sajana, T., Narasingarao, M.R. (2017). Ensemble framework for classification of imbalanced malaria disease data. Journal of Advanced Research in Dynamical and Control Systems, 9(18): 473-482.
[32] Malathi, J. (2019). A comparative performance analysis of different machine learning techniques. In Journal of Physics: Conference Series, 1228(1): 012035. https://doi.org/10.1088/1742-6596/1228/1/012035