Claudio Guidotti* | Damiano Ricci
© 2021 IIETA. This article is published by IIETA and is licensed under the CC BY 4.0 license (http://creativecommons.org/licenses/by/4.0/).
OPEN ACCESS
Ongoing developments in threats to security and public order demand a thorough analysis of the approaches currently used to avoid and resolve crisis situations, in particular when they relate to non-conventional CBRNe incidents. The ability to respond rapidly and efficiently to an unexpected situation requires an extensive knowledge of the CBRNe threats and the display of management resources to overcome the emergency phases. A CBRN advisor must have the ability to determine the consequences of a CBRN situation in any given context, in order to suggest the most favorable paths to emerge from the crisis to the decisional leader/manager. In this report we thoroughly explored, from the CBRN awareness point of view, a successful response to the emergency management of the Regional Forensic Police Centre of Firenze, using a range of instruments often related solely to the private business dimension, such as "Lean thinking approach" or the SWOT analysis, in order to exit the crisis phase mitigating the expected damages. Whit this research the two authors confirmed that correct management of a CBRN emergency cannot be entrusted to good will alone, but requires careful planning, in-depth knowledge of the crisis and managerial organization of events and resources.
assessing a CBRN scenario, management of CBRN crisis, managerial tools, SWOT matrix, Lean Thinking approach, KPIs, law enforcement
The emergence of the COVID-19 virus has created an unexpected global emergency situation, creating a major impact both on the lives of citizens and on the public sectors and private companies of the various States. Following the first outbreak in China, the virus epidemic followed a propagation linked to civil and commercial routes, and Italy was among the first countries severely affected. Due to the limited epidemiological information received during the early stages of the emergency, and based on precautionary models, Italy decided to apply strict lockdown measures to the entire country system for an initial stage of about 3 months.
Numerous investigations have been conducted, or are underway, on how the epidemic (later identified as a pandemic by the WHO) is damaging the country's production framework, and what kind of impact this may have on the GDP in Italy and Europe in the years to come.
On the contrary, there were no -or very limited- scientific studies aimed at investigating how the application of the current Directives and Legislative acts, designed to implement safety measures and interventions for the containment and management of the emergency COVID-19 throughout the national territory, had an impact on the productivity and efficiency of the Public Sector.
On the other hand, it is clear that the Public Administration, playing a central role in managing a considerable percentage of the national GDP, due to the application of strict security measures, has suffered an important setback on many activities, and this could affect both the public and private life of people (e.g. delays in issuing administrative acts, interruptions in the administration of justice, difficulties in overseeing public order and security) and the private interests of small businesses, companies and enterprises.
The Italian national Police, a Public Administration with about a hundred thousand employees, primarily connected to the task of guaranteeing public order and security, due to the sudden and dramatic changes in the "internal situation" (e.g. national interests, epidemic outbreak, security risks, riots menaces, etc.), had to undertake a complex process aimed at maintaining its functions even by substituting numerous activities, while at the same time making a great effort to protect the safety of its personnel and citizens alike.
During this study the authors carefully investigated, from the point of view of CBRN sensitivity, a possible integrated and carefully planned approach to the emergency management through the application of typically business-oriented management tools to the Regional Centre of Forensic Police in Florence.
From a senior managerial position within the Italian Police, we established to examine and then handle the unexpected CBRN emergency situation within the range of our own office, using an extensive range of planning and control tools, often related solely to the private business dimension, such as "Lean thinking approach", the SWOT analysis, the KPI definition, in order to improve our chances to take favorable paths during the crisis phase, and assess if and how a strategic approach could help to leave more quickly from a stage of turbulent change of the "external market conditions".
Several past CBRN disasters all around the world have clearly shown that proper emergency management cannot be "chance-based", or only entrusted to good will, requiring instead careful planning (when possible in advance) and to be supported by a managerial approach and methods, that allowing to find the best exit strategies from the crisis, to mitigate unavoidable damages (even if they are immaterial damages such as delays in the management of criminal investigations), as well as to assess the impact of the latter.
Starting from the first days of March 2020, the authors attempted, through a series of actions and measures better described in this study, not only to maintain their work activities fully functional, in full compliance with the legislation issued by the Government and the Directives of the Ministry of the Interior, but also to customize the duties and timetables of the employees in order to make the most of the change in the situation, and to mitigate the expected negative impact on their productivity.
Within the office's various operational areas, all of which were subjected to the same security measures, job-schedule shaping and hourly staff rotation criteria, it was decided to select a "pilot area" where certain Key Performance Indicators (or KPIs) [1, 2] could be strategically set, so that the performance trends considered "essential" could be traced in a manager-oriented manner.
After having considered carefully what we believed to be the risk factors for "internal" productivity (e.g. sectors with a high performance to sustain, sectors with activities often connected to external "suppliers") the Abuse drug investigation Area, which was considered to be at greater risk of decreased productivity (and thus a better indicator of potential "company" damage), was selected as the pilot area to be examined in depth during the crisis timeframe.
2.1 Setting of the main objectives
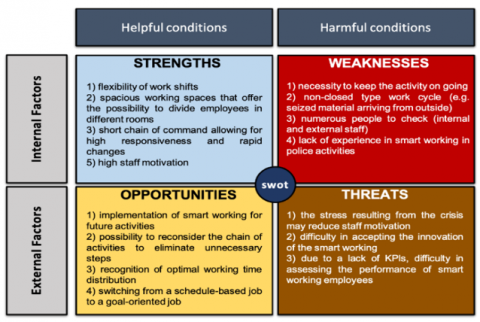
In order to better manage the efforts and activities of the management and staff, it was decided to use the strategic tool of SWOT analysis [3] to plan in advance the most important activities to be carried out during the CBRN emergency phase, and to reshape the office for the next recovery phase.
SWOT analysis (or SWOT matrix) is a decision-making planning tool used to assist a company or an individual in recognizing strengths, weaknesses, opportunities and threats (hence S.W.O.T.) relevant to a business, activity or a project planning [4, 5].
Due to the SWOT matrix ability to visually bring internal and external factors closer to those of the organization's activities, we reached the following operational conclusions (sorted in order of priority):
1) the prevailing need for the public interest was to keep the activity ongoing, without lessening the safety of the staff;
2) in order to ensure the safe continuation of the activities, a number of drastic measures on protection (forced routes and paths inside the building, setting of decontamination stations, etc.) and on the type of work schedule and on the organization of staff activities ("space" separation of personnel, "time" separation of staff, separation of certain working-schedules, etc.) were necessary;
3) the necessity to adapt some tasks so that they could be handled in "smart working" modality, thus reducing the opportunities for physical contact between staff members;
4) the awareness that a rapid transition to new and unconventional forms of work may lead to a reduction in productivity, mainly due to resistance to change.
Figure 1. Internal and external factors considered more relevant for the Police office under scrutiny
The result of the detailed evaluation of potential factors internal and external to the organization's activities (considered as a single police office in this study) is shown in the Figure 1.
2.2 Safety measures application
The difficulty of reconciling the routine work of a police officer with that of ensuring the safety of its employees has been the main difficulty to overcome since the very beginning of the CBRN emergency.
In agreement with the office manager, a detailed program to exit from the crisis situation be implemented in about 4 months was proposed, with departure scheduled during the first days of March, coinciding with the first signs of the virus transmission peak.
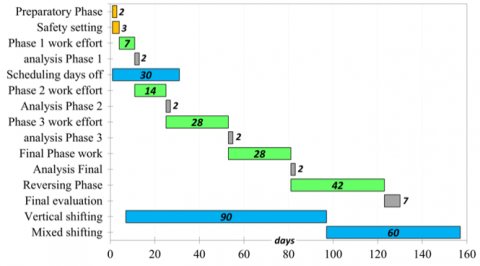
During the preparatory phase of the transition, the authors assessed the risk conditions and then proposed and applied, in full accordance with the office senior manager, a series of safety measures within the workplace in order to mitigate the risk of contagion. The sequence of the phases has been evaluated and established during a preparatory phase by means of a Gantt diagram [6] (Figure 2) in order to better track the alternating of the new projected working-phases (called Phase 1-2-3 work effort).
Figure 2. Gantt diagram showing the different phases designed to overcome the emergency. The initial stage of the crisis (time 0) is conventionally set as 1st of March
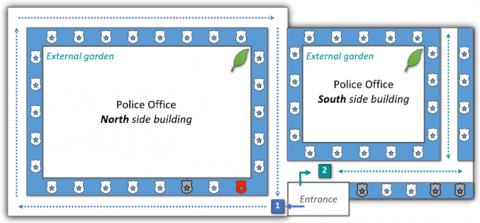
Among the various measures adopted, the most important and decisive ones are listed below (Figure 3):
a) setting of two different mandatory routes within the office to reduce physical contacts within internal personnel;
b) establishment of two decontamination stations at the entrance (square nr.1 in Figure 3) of the office and at one of the intersection points (square nr.2 in Figure 3), considered to be at risk due to the seized material deliveries;
c) establishment of restricted access zones, so as to increase the separation of physical environments and decrease the possibility of unmotivated movement of personnel;
d) one waiting area (square nr.2 in Figure 3) for external staff was arranged in correspondence with one of the decontamination stations (prior to the forensic laboratory) to allow safe deposits and exchanges of seized material;
e) all the personnel (both internal and external) were strictly required to use masks and gloves during their job activities;
Figure 3. Layout of the Forensic Police Office of Firenze. The blue and green arrows are the structure's entrance, and associated with the 2 mandatory paths (blue/green dotted lines). Offices and the laboratories are marked in blue. The marks (1, 2) outline the 2 decontamination stations
In addition, as a further step to minimize the risk of contagion, which was perceived to be especially problematic inside a police office that must ensure its operability, it was agreed to:
f) taking in account a physiological decrease in the number of ordinary working activities (e.g. outside activities for crime-scene examination), motivating the personnel to take days off or parental leave, so as to reduce the presence of office staff by about 50% during the first month;
g) modification of the work schedule for approximately 3 months, from the traditional 6-hours weekday model (with rotating morning, afternoon, noon and night shift) to a rigid vertical shift 7-19 h on alternate days, swapping one day of presence with one day of full rest, with the intent to minimize the presence of employees by approximately 50% throughout the day and consequently reducing the number of their interactions ("vertical separation" of employees);
h) as an additional precautionary measure, the staff within each office were separated every day, when not already alone, into different rooms/laboratories by the on-duty officers in order to maintain a 'horizontal' separation of personnel during their routine activities.
We often underestimate the impact that innovation has on the long-term prosperity of any business/activities in the products (or services) that we provide to our customers [7]. The Lean thinking approach arises from the Lean Manufacturing approach, a popular mean of continuous improvement that has globally restructured manufacturing processes, practices and principles [8, 9].
The original concept originated in Japan after the Second World War when Japanese manufacturers realized that they could not afford the massive investment required to rebuild devastated facilities [10-12].
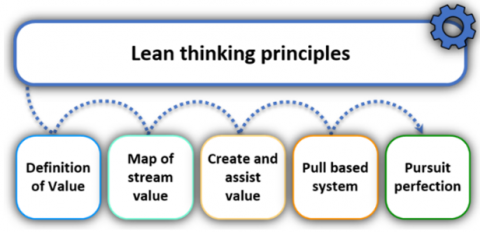
The Lean system, rather than being a mere tool for manufacturing, is a real philosophy and production culture (Figure 4), which aims to make the product flow within the production chain, favoring activities that increase its value, avoiding unproductive or time-wasting phases, enhancing and motivating human resources [13], and at the same time aiming at perfection as a means of continuous customer satisfaction [14], perceiving this approach positively and aligning it with how an organization thinks and works in terms of communicating and organization structuring [15].
Figure 4. Principles of lean thinking
The authors of this work have found a strong parallelism between the fundamental principles of the Lean thinking especially as the enhancement of the human factor (untapping human potential), or the continuous pursuit of quality and customer satisfaction, increasingly applied in the Public Administration [16-19], with the management tools adopted in their office, and have considered the emergency scenario as the right stimulus (opportunity) to reconsider the entire "production process" and possibly improve it [20].
For time-related considerations, and for reasons of opportunity in the choice of appropriate performance indicators, the Lean approach has been applied, as explained in Paragraph 2.0, to the Abuse drug investigation Area, which was considered to be at greater risk of decreased productivity inside the whole office.
3.1 Practical application of Lean thinking approach to the Abuse drug investigation Area
According to the principles of the Lean thinking, within an organization the concept of value is defined as the “capability provided to the customer at the right time at an appropriate price, as defined in each case by the customer". Understanding what is the real meaning of "value" is the crucial starting point for a Lean approach, and it can only be defined from a client perspective. The same notion of quality is strongly product-specific (or service-specific) and relevant only when expressed in terms of a particular product.
Within our forensic police office, the key clients for the Abuse drug investigation Area are the Prosecutor offices of the Region (or, in less extent, the Tribunal courts), who require to perform rapid and accurate testing of the drugs confiscated during police operations.
However, the need for rapid analysis cannot reduce the quality of the results. For this reason, for several years now, this police office has decided to qualify its activities with a certification path in accordance with ISO 9001 standards. In addition, with a view to the continuous improvement of its performance and the services offered, the Drug Laboratory has, for about a year now, taken the path of further accreditation to ISO 17025 standards.
The authors then agreed to set the "value" for the Lean approach of their study as "the ability to execute, in the shortest time possible, the maximum number of Drug dossiers according to the state-of the-art required conditions (according to the current Laws, existing technologies, etc.)".
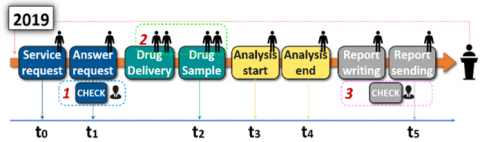
Starting from the assessment of value, we started to map and graphically represent all the activities carried out to "effectively" achieving the goals (starting from the administrative management of the request, to the very delivery of the final results to the customer), with the purpose of an in-depth understanding of the on-going processes (Figure 5).
A scrutiny of the process followed with the aim of seeking unnecessary, duplicated, or steps to be revised. Finally, an attempt was made to assess how to apply the concept of pursuing perfection within this specific production cycle.
The production cycle of the pilot area is triggered by the request of the Prosecutor for an investigation (pull-based system). The inquiry is processed, and then a response is given with a date to begin operations with the police team that carried out the seizure (administrative management).
Then the confiscated substance is delivered at the scheduled date, usually to two officers, who verify the chain of custody and conduct sampling for analysis. The samples are placed in the inventory. When the instruments are available the analysis start.
Finally, at the end of the analysis, the final report is written, delivered to a senior police officer for an inspection check, and lastly delivered to the Prosecutor.
Figure 5. Graphical map of the forensic drug laboratory activities during the year 2019 and up to the onset of the COVID emergency. The number of employees engaged in each step is indicated by the presence of "operator" icons
Figure 6. Graphical map of the forensic drug laboratory activities after the onset of the COVID-19 emergency
The activity of mapping our internal activities and processes provided us with the exceptional opportunity to examine our procedures thoroughly and to discover certain non-linear pathways (Muda 1&3: waiting, overproduction), small process duplications (Muda 2: overprocessing), inventory formation and waste of human potential (Figure 5).
We have therefore decided to reconsider the whole production process (focus on the Drug analysis area) with the precise aim of reducing customer waiting times, while put an effort in maintaining the quality of the results (Figure 6).
In order to minimize waiting times, prevent accumulations and mistakes in the distribution of the material, reduce over-processing and inventory during the "drug sampling" phase, we agreed to simplify some slow steps, adding a control stage to the initial administrative management and assign only one police officer to each phase of drug receipt and sampling.
Finally, expecting an increase in the "flow" of data, due to the elimination of some unnecessary steps, we agreed to set up a further review process at the time of dispatch, in order to avoid post-production errors.
Eventually, recognizing that part of the operations would have done in smart work modality (i.e. workers that are difficult to monitor), we decided to focus on the employee's morale boosting, explaining them the idea of the change and making them participate in it.
The testing of the new "production cycle" started from the first days of the month of March, along with the monitoring of the chosen key performance indicators (KPIs).
3.2 Setting of key performance indicators (KPIs)
Suggesting modifications and reshaping the productive cycle is pointless if we are unable to track these developments over time.
In order to be able to strategically monitor the effects of their choices, the authors have decided to set some indicators. Having established the concept of value for the organization, and with clear new targets of reorganization aiming at efficiency, and wanting to re-evaluate over time the decrease in time-waste and the effects on customer satisfaction aspects (number of reports concluded, timing of satisfaction of requests, number of dunning, etc.), we attempted to choose SMART (Specific, Measurable, Achievable, Relevant, Time-bound) type indicators. In the context of corporate management, the indicators adopted in a SMART way are considered to be more reliable and suitable to sustain a change over the long-term.
The initial selection of indicators was also constrained by the availability of equivalent information (or the possibility of extracting this information by other data) over the same period of the previous year, in order to be able to compare coherent and consistent results.
We decided to define three types of indicators:
a) one K series (Table 1) related to "raw output data" (how many completed dossiers, how many analyzed samples, how many tasks carried out by the employees involved in 1 specific tasks, etc.);
The parameter Kr1 = K1.3 - 0.5*(K1.1) - 1*(K1.2) Kr1 compares the actions deemed positive towards the client to which we assigned a positive value of +1, with those regarded as partially negative to which we assigned a negative value of -0,5, and with the negative conditions to which we assigned a negative value of -1.
K5 is defined as the sum, extended to all the requests fulfilled, of the numbers of analysis performed for each sample collected, representing the global complexity of the activities completed. Kr5 being the ratio within the global complexity and the total number of activities executed, characterizes the medium complexity of the activities executed during the considered period (Kr5 = K5/K2).
K6 counts the number of total activities (sampling, analysis, etc.) carried out by the operators in the area under examination, while K7 isolates only the number of sampling carried out by the operators.
Finally, Kr7 calculates the percentage of sampling activities managed by a single operator.
Table 1. K series performance indicators
|
Parameter |
Definition |
|
K1 |
Requests (total number) |
|
K2 |
Requests satisfied |
|
Kr1 |
Performance index A1 |
|
K3 |
Samples collected |
|
K4 |
Analysis performed |
|
K5 |
Sample complexity tot. |
|
Kr5 |
Medium complexity B1 |
|
K6 |
Total operator activity |
|
K7 |
Sampling operator activity |
|
Kr7 |
% single sampling |
b) the two series of P and D (Primary and Derived) indicators (Table 2), instead, were chosen to track the waiting time requested to complete a task asked by the client (or a portion of it). We considered these 2 types of indicators more capable of expressing the rate of customer satisfaction, because the dimension of time is clearly expressed in the concept of value.
Table 2. P and D series performance indicators
|
Parameter |
Definition parameter |
|
|
P0 |
t1-t0 |
Administrative management |
|
P1 |
t2-t1 |
Client waiting time from answer |
|
P1.1 |
t2-t0 |
Client waiting time from request |
|
P2 |
t3-t2 |
Rapidity in starting treatment |
|
P3 |
t4-t3 |
Analysis overall duration |
|
P3.1 |
t4-t2 |
Overall sampled material stored |
|
P4 |
t5-t4 |
Preparation and checking report |
|
P4.1 |
t5-t3 |
Report from analysis length |
|
P4.2 |
t5-t2 |
Execution request length |
|
P4.3 |
t5-t1 |
Time to meet request |
|
P4.4 |
t5-t0 |
Total time to meet request |
|
D4 |
P4/Ic |
Report preparation vs complexity |
|
D4.2 |
P4.2/Ic |
Execution length vs. complexity |
|
D4.4 |
P4.4/Ic |
Total time vs. complexity |
The Pi series of value contains the main time-related indicators, while the Pi.i series of value contains the secondary time-related indicator.
The D series of value contains combined indicators, obtained by matching main or secondary collected indicators with the complexity index (Ic) of the request. Ic was defined as the number of samples processed per request multiplied by the average number of tests performed per sample.
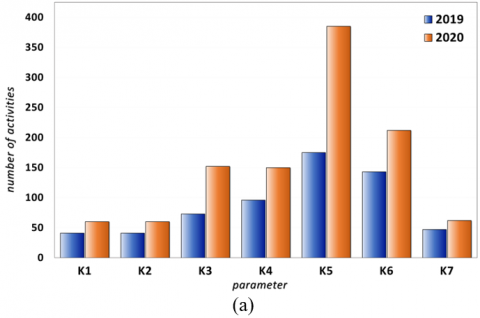
The data collected related to the K parameters (Table 1) illustrate the productivity trend of the office (nr. of received requests, nr. of samples analysed, nr. of dossiers completed, etc.).
Despite the alternating shifting needed for the COVID emergency, the reduction in staff activity and also the implementation of the new smart-working activity, all the K parameters, including the Kr ones (Kr1, Kr5, Kr7), showed a significant increase (Figure 7).
The data collected related to the K series of performance KPIs showed that the reorganization of the office has not only mitigated the expected risk of productivity loss, but has even enhanced the amount of the completed tasks carried out (K1 and K2 +46%, K3 +108%, K4 +56%, K5 +120%, K6 +48%, K7 +32%, Kr1 +517%, Kr5 +50%, Kr7 +11%).
Figure 7. K series performance indicators: in Figure 7a (on top) K1-7 and in Figure 7b (on bottom) K2 vs. Kri. Data monitored in 2019 (in blue) vs. data monitored in 2020 (in orange)
Despite the alternating distribution during the week of the staff in the office, and part of the job being conducted as "smart working" modality, all the raw productivity indices (volume of satisfied requests K2, quantity of samples collected K3, number of analyses carried out K4, etc.) showed a significant increase.
As a result of an efficient and carefully planned reorganization of the tasks, the extent of activities carried out by each employee (K6, K7) has also augmented, though the number of presences in the office of each employee has been reduced by about 30% during the period considered (by means of days-off, parental leave, smart working, etc.), and the general complexity of the client's request has raised (K5).
As planned (Figure 6) by the modification of the "production cycle", the different arrangements of the reception and sampling material steps, inspired by Lean management, have improved the percentage of activities carried out by a single operator (Kr7) of about 11%, thus allowing the second operator to be better employed in a different task.
The elaborated data demonstrate that a correct management of the CBRN emergency has not only succeeded in mitigating the expected risk of performance reduction, but even increased by around 46% the total number of successfully handled jobs (K2) despite the reorganization of the shifts and the smart working conditions, regardless a general growth of about 50% in the average complexity of the cases completed (Kr5).
Of particular importance is considered the approximately 6-fold increase the Performance Index (Kr1), which collects and evaluates factors directly related to the customer satisfaction.
The increase is mostly due to the speeding up the time-schedule of numerous work practices, achieved by the extra activity of the second person no longer employed "in pairs" during the accepting material stage (t2).
Despite the reduction of the office staff, the relocation of the job, also through a consistent use of the digital smart-working tool, the team has succeeded in positively dealing with more dossiers (K1), moving up many requests ahead of the scheduled time (K1.3) and effectively completing them (K2/K1=1).
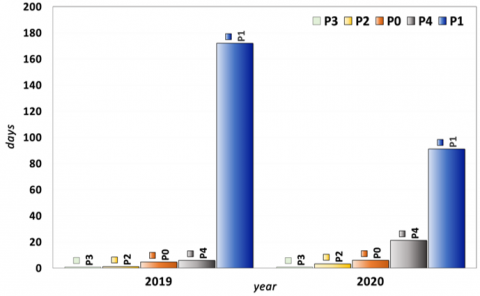
The P indicators represent the time (average, in days) needed to complete a specific task (or a segment of it) inside the productive cycle of the pilot area of the Police office.
Altogether, P1, P2, P3 and P4 define the parameter P4.4 (total time to complete a dossier from its first request). All the main KPIs (expect the small contribution of P4), following the rearrangement of the office, are greatly reduced and therefore improved (Figure 8).
Figure 8. Contribution of the single activities to the total time (in days) required for completing successfully one request (2019 at left side vs. 2020 at right side)
To a first general evaluation of the timed-parameters, we observe that the largest contribution to the total time of completing a request (P4.4) is accounted for by P1 (client waiting-time from request to the delivery of the drugs), although a substantial decrease in this waiting period is observed during 2020 as a result of the rearrangement of the office and of the productive cycle. Follows the time needed to write the report after the analysis and for the senior police officer to check it (P4), that contributes in a minor amount.
Finally, the contributions due to parameters P0 (administrative management of the request), P2 (rapidity in starting analysis after the delivery of the material) and P3 (overall duration of the chemical analysis), proved to be almost irrelevant to the total time of completing a request (P4.4) and not to have changed substantially in the two compared periods.
As an expected consequence of the increment of successfully processed dossiers, and the decision to set up a second-level of checking of the reports to be sent the Tribunal court in order to pursue always a very high standard of outcomes, the average time required to complete the files and documents after the end of the analysis (P4) increased by approximately 2 weeks (Figure 8).
Although, considering the order of magnitude of improvement of P4.4 (P4.4 2019 = 184 days, P4.4 2020 = 122 days), and also by assessing effectively the same parameter normalized for the number of requests received (+46% during 2020), the authors regard the minute increase in P4 as unremarkable and in any case needed to shorten the duration of the other processes and ensuring a pursuit of quality.
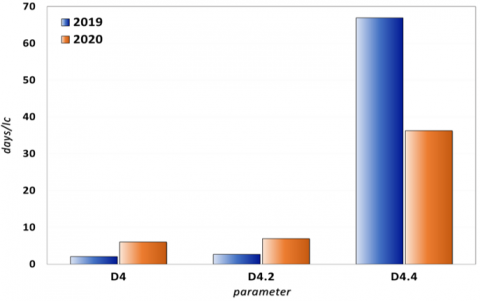
Finally, while the indicators D4 (report preparation time and checks vs. complexity) and D4.2 (time from deposit to report vs. complexity) remained very similar, the D4.4 parameter (total time required for completing a request vs. complexity) show a consistent decrease of about 46%, thus suggesting that under conditions of the same complexity, the overall processing time of a customer's request has been highly optimized (Figure 9).
Figure 9. Comparison of timed quality indicators D4, D4.2 e D4.4 (data 2019 in blue vs. data 2020 in orange)
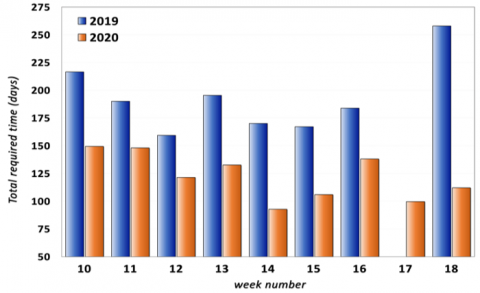
Figure 10. Comparison of P4.4 values (total time required for completing a request). Data 2019 (in blue) vs. data 2020 (in orange). No analysis requested during the 17th week of 2019
Finally, evaluating the progression of the P4.4 values (P4.4 being the total time necessary for completing a request) in the weeks under monitoring of the two considered periods (Figure 10), it can be clearly appreciated that during 2019, in the absence of COVID-19 crises, the execution times were significantly higher.
On the contrary, during the management of CBRN emergencies through methods inspired by Lean thinking in 2020, during the COVID-19 crises, we can highlight a substantial shortening of the required time to fulfil the requests.
Without conducting a regression analysis (the authors considered the two period too much short for a robust mathematical discussion) it is clear that during the crisis scenario, due to a reshaping of the office activity, to a morale boosting of the personnel, and to the reduction of some time wasting tasks, the fundamental indicator P4.4 was consistently maintained at a much better level than the previous year.
The CBRN crisis scenario which arose in Italy as a result of the pandemic caused by the rapid spread of the COVID-19 virus forced the State Police, with its sensitive task of maintaining order and maintaining public security, to reconsider and redesign its activities so as to continue to provide a public service, while at the same time ensuring the health of its employees.
The two Police Officers authors of this study, well aware that the proper response to a crisis situation cannot be simply relied on good will, with great support of their Superior Officers, entirely reorganized the activities of their Police office according to business planning methods (Lean thinking) and tools (SWOT analysis, visual planning, flowcharts), in order to lessen the impact of the crisis.
After having carefully assessed the current situation and evaluated the most important objectives (personnel safety, continue to provide a service to citizens, etc.) to be pursued in the short and medium term in order to emerge from the crisis phase, the authors, have drawn up a scheduled plan with the aim of mitigating the risks and reduce the expected losses. In order to monitor the situation, and to evaluate the expected undesirable impact of the crisis on the office's activities, a number of appropriate KPIs have been carefully established and tracked.
Within their Police office, the Abuse drug investigation Area, which was considered more at risk of decreasing productivity due to the emergency situation, has been investigated as a pilot performance model. Finally, the data obtained from the monitoring of the KPIs during the period March-May 2020, have been compared with those collected during the same months of 2019 for the same area and the same personnel.
With considerable better results than expected, the productivity trend investigated during the COVID-19 emergency period, demonstrated that the reorganization of the whole office, guided by a deep CBRN awareness in accordance with the Lean principles, has not only managed to mitigate the expected risks (decreasing in the overall activities, possible infections within the personnel) in the pilot area, but has even enhanced both the amount and the quality of the tasks carried out (e.g. increasing the successfully handled jobs by about 46%).
Although the same working and safety conditions (masks, decontaminations, etc.) were imposed to all the personnel of the Police office from the outset of the CBRN emergency, the authors cannot speculate about the sections not closely monitored. Nevertheless, the extremely positive results recorded in the sector of activity considered to be most at risk for productivity reduction were extremely encouraging, prompting the idea of considering a more comprehensive Lean application at the end of the crisis scenario for their Police office.
The authors would like to express their sincere appreciation to the Forensic Science Police Service for the opportunity offered to develop this project.
|
CBRN |
chemical, biological, radiological, nuclear |
|
CBRNe |
chemical, biological, radiological, nuclear and explosive |
|
COVID-19 |
Coronavirus disease 2019 |
|
GDP |
Gross Domestic Product |
|
KPI |
Key Performance Indicator |
|
SMART (indicator) |
Specific, Measurable: Attainable/Achievable, Relevant, Time-bound (or timely) |
|
SWOT |
Strengths, Weaknesses, Opportunities, and Threats |
|
TPS |
Toyota Production System |
|
WHO |
World Health Organization |
[1] Heath, G. (2019). Performance Management and Rationality in Public Sector Organisations (Doctoral Dissertation, Luleå Tekniska Universitet).
[2] Zanin, F., Corazza, G. (2019). Strategic knowledge management models and tools in the public sector: Evidence from the university setting. In Handbook of Research on Implementing Knowledge Management Strategy in the Public Sector, 231-253.
[3] Calicchio, S. (2017). La SWOT analysis in 4 step. Come sfruttare la matrice SWOT per fare la differenza nella carriera e nel business.
[4] Nazarko, J., Ejdys, J., Halicka, K., Magruk, A., Nazarko, Ł. and Skorek, A. (2017). Application of Enhanced SWOT Analysis in the Future-oriented Public Management of Technology. Procedia Engineering, 182: 482-490. http://dx.doi.org/10.1016/j.proeng.2017.03.140
[5] Juneja, P. (2020). SWOT Analysis-Definition, Advantages and Limitations. Managementstudyguide.com. Available at: https://www.managementstudyguide.com/swot-analysis.htm, accessed on 20 August 2020.
[6] The Constructor. (2020). Project Management Techniques- PERT, CPM, And Gantt Chart. Available at: https://theconstructor.org/construction/const-management/pert-cpm-gantt-chart-project-management/94/, accessed 21 August 2020.
[7] Attolico, L. (2012). Innovazione Lean; strategie per valorizzare persone, prodotti e processi. Hoepli.
[8] Smith, A.T. (2015). Lean thinking: An overview. Industrial Engineering and Management, 4(2). http://dx.doi.org/10.4172/2169-0316.1000159
[9] Čiarnienė, R., Vienažindienė, M. (2012). Lean manufacturing: Theory and practice. Economics and Management, 17(2). https://doi.org/10.5755/j01.em.17.2.2205
[10] Bhamu, J., Singh Sangwan, K. (2014). Lean manufacturing: literature review and research issues. International Journal of Operations & Production Management, 34(7): 876-940. http://dx.doi.org/10.1108/IJOPM-08-2012-0315
[11] Womack, J., Jones, D. (1997). Lean thinking - Banish waste and create wealth in your corporation. Journal of the Operational Research Society, 48(11): 1148-1148. https://doi.org/10.1057/palgrave.jors.2600967
[12] Pearce, A., Pons, D. (2013). Implementing lean practices: Managing the transformation risks. Journal of Industrial Engineering, 2013: 790291. https://doi.org/10.1155/2013/790291
[13] Radnor, Z., Walley, P. (2008). Learning to walk before we try to run: Adapting lean for the public sector. Public Money & Management, 28: 13-20. https://doi.org/10.1111/j.1467-9302.2008.00613.x
[14] Womack, J., Jones, D., Roos, D. (1991). The Machine That Changed the World. New York: HarperPerennial.
[15] How business works - a graphic guide to business success (various authors). DK Penguin Random House, 2015.
[16] de Almeida, J., Galina, S., Grande, M., Brum, D. (2017). Lean thinking: planning and implementation in the public sector. International Journal of Lean Six Sigma, 8(4): 390-410. https://doi.org/10.1108/IJLSS-06-2016-0027
[17] Bhatia, N., Drew, J. (2007). Applying lean production to the public sector. The McKinsey Quarterly, 3: 97-98.
[18] Wijnhoven, F., Beckers, D., Amrit, C. (2016). Reducing waste in administrative services with lean principles. In 2016 International Conference on Information Systems, ICIS 2016 https://aisel.aisnet.org/icis2016/Practice-OrientedResearch/Presentations/1/
[19] Radnor, Z., Boaden, R. (2008). Editorial: Lean in public services-Panacea or Paradox? Public Money & Management, 28: 3-7. https://doi.org/10.1111/j.1467-9302.2008.00610.x
[20] Gaudet, J., Bergeron, F. (2016). Lean: It’s not rocket science, it’s work science. https://doi.org/10.17605/osf.io/wp9bw