Fuquan Pan* | Yongzheng Yang | Lixia Zhang | Xiaoxia Yang | Jinshun Yang | Meijun Liu
© 2021 IIETA. This article is published by IIETA and is licensed under the CC BY 4.0 license (http://creativecommons.org/licenses/by/4.0/).
OPEN ACCESS
To study the influence of illumination and longitudinal slope at the entrance and exit of an undersea tunnel on driver EEG characteristics, a real vehicle experiment was performed with the Jiaozhou Bay Undersea Tunnel. The experimental data of a driver’s real vehicle experiment were collected using an illuminance meter, EEG instrument, video recorder and other experimental equipment. The EEG power spectrum was classified according to frequency, the difference between the EEG power spectrum at the entrance and exit sections and other regions was analyzed, and the influence of the illumination and longitudinal slope of the undersea tunnel on the brain activity of drivers was studied. The region near the entrance and exit of the undersea tunnel was divided equidistantly, the changes in the EEG power of the driver during the process of entering and exiting the undersea tunnel were analyzed, and the changes in brain activity and different brain regions during the process were studied. Based on the EEG power, the model of illumination, longitudinal slope and their coupling effect was established. The traffic safety of the entrance and exit of the undersea tunnel was analyzed, and a high-risk driving region was found. The results show that the power spectrum of the entrance and exit sections of the undersea tunnel is obviously different from those of other sections. At 50 m behind the entrance point and 50 m in front of the exit point of the undersea tunnel, the power of the β wave changes rapidly and is at a high level. The consistency between the variation law of the β wave and the variation law of illumination is high. At the entrance and exit of the undersea tunnel, the active regions of the driver’s brain are concentrated in the frontal lobe and occipital lobe.
traffic safety, undersea tunnel, driver, illumination, longitudinal slope, EEG
The undersea tunnel is a large-scale artificial traffic facility built under the seabed for vehicle flow to solve traffic problems across bays [1]. It has the advantages of safety, high efficiency, less land occupation, no obstruction to sea navigation, all-weather traffic and a large traffic capacity [2, 3]. The undersea tunnel can be considered a special highway tunnel. Compared with ordinary highway tunnels, undersea tunnels have an obvious characteristic: complex longitudinal slope changes. The undersea tunnel needs to be introduced into the seabed from the land first, then pass under the seabed, and finally pass out to the land. This scheme leads to the entire process of the undersea tunnel; in particular, the entrance and exit will have a large longitudinal slope change, which will have an adverse effect on the driving process. At the same time, the entrance and exit of the undersea tunnel are located in the transitional area of natural light from the outside [4-6]. The difference in illuminance inside and outside the tunnel will cause the “black hole effect” and “white hole effect” at the entrance and exit, and drivers will experience short-term visual obstacles. This change process and related phenomena will directly affect the driving ability of the driver [7]. Under the interaction of the longitudinal slope and illumination changes, drivers will face greater challenges in behavior and psychology, which will lay hidden dangers for driving safety [8].
The undersea tunnel is a strategic traffic channel that plays a vital role in urban traffic. Once a traffic accident occurs, it will easily cause large-scale regional traffic congestion. According to relevant studies, the entrance and exit of the tunnel are accident-prone areas of highway tunnels, and the accident rate and severity of the entrance and exit are higher than those of other areas [9, 10]. Therefore, the physiological and behavioral characteristics of drivers at the entrance and exit of undersea tunnels is very important to study for safe operation and traffic accident prevention.
Some scholars have conducted relevant research on driver psychology and behavior at the entrance and exit of tunnels. Pan et al. [11] took the road alignment of the tunnel as the research object and analyzed the linear change characteristics of different areas in the tunnel. This study found that the entrance and exit areas of the tunnel are where the longitudinal slope is largest and the psychological fluctuations in drivers is greatest. Zhao et al. [12] studied a long highway tunnel and found that the driver will have obvious physiological fluctuations and anxiety at the tunnel entrance. Jiao et al. [13] took an urban underwater tunnel as the research object, analyzed the driver’s eye movement parameter changes at the tunnel entrance and exit, and found that the driver's adaptation time to the “black hole effect” and “white hole effect” was 8.6 s and 2.3 s, respectively. Du et al. [14] found that the illumination changes at the tunnel entrance would severely interfere with the vision of the driver and proposed the use of line-of-sight guidance to optimize the tunnel traffic environment to improve the driver’s sense of position in the tunnel.
The existing studies of tunnel traffic safety have shown that the drastically changing traffic environment is a major cause of traffic accidents. In terms of research indicators, most existing studies use eye movement indicators, such as the degree of eyelid closure, pupil area, blink frequency, and fixation time, as well as the heart rate, heart rate growth rate, heart rate variability and other ECG indicators, to study the physiological changes in drivers and then evaluate traffic safety in a specific environment [15, 16]. Reimer [17] analyzed the relationship between the traffic environment and driving tasks during driving and found that driving safety is closely related to indicators such as the pupil area, blink frequency and fixation time. He et al. [18] found that the pupil area of drivers differs between lighting conditions in highway tunnels, and a sharp decrease in illumination will unsettle drivers and then induce traffic accidents. Peng et al. [19] studied the relationship between driver fixation points and driving efficiency in mountain highway driving and established a safety evaluation model of eye movement characteristics. Feng et al. [20] established a model of the longitudinal slope, vehicle speed and heart rate variability rate and found that in the slope range of 3.5% to 4.0%, the driver's heart rate variability was the highest, and the driver was the most unsettled.
At present, the research on traffic safety at the entrance and exit of tunnels is primarily based on ordinary highway tunnels, and few studies are available on undersea tunnels. At the same time, most of the parameters studied are eye movements or ECG indicators. Compared with ordinary highway tunnels and urban highway tunnels, undersea tunnels have a deeper undercrossing depth, which leads to more complex longitudinal slope changes [21]. On this basis, this study takes the Jiaozhou Bay Undersea Tunnel as the experimental site to conduct real vehicle experiments. Taking the driver’s EEG signal as the parameter, combined with the illumination change and longitudinal slope at the entrance and exit of the Jiaozhou Bay Undersea Tunnel, the EEG signal change law of the driver is analyzed. The mechanism of the coupling effect of the illuminance and the longitudinal slope of the undersea tunnel on the driver is explored to provide a theoretical basis for the operation and management of undersea tunnels and to ensure traffic safety.
2.1 Experimental site
The experimental site of this study is the Jiaozhou Bay Undersea Tunnel in Qingdao. The total length of the tunnel is 7.8 km, of which the cross-sea section is 4.1 km, and the deepest section is 82.8 m below sea level. It has 3 lanes in both directions, and the maximum speed limit is 80 km/h.
2.2 Experimental equipment
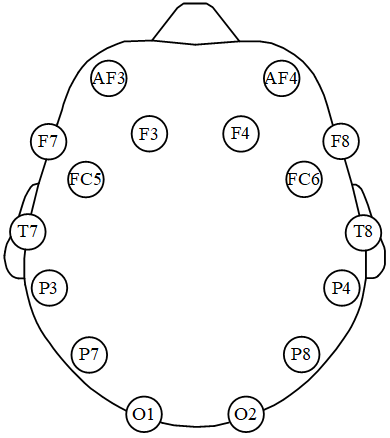
The experimental vehicle in this study is a Chevy car that is in good condition. The illuminance data acquisition equipment is a TES-1339R professional illuminance meter. The measurement range of the equipment is 0.01-999900 lux, the resolution is 0.01 lux, the measurement accuracy is 3%, and the sampling rate is 5 times/s. The EEG data acquisition equipment is an Emotiv EEG instrument. The measuring range of the equipment is 0.2-45 Hz, and the sampling rate is 258 times/s. The electrode placement method of the international 10-20 system is adopted. There are 16 channels in total. The location of each channel is shown in Figure 1 and Figure 2. Among them, channels AF3, F3, F7, AF4, F4, and F8 are located in the frontal lobe, P3, P7, P4, and P8 are located in the parietal lobe, channels FC5, T7, FC6 and T8 are located in the temporal lobe, and channels O1 and O2 are located in the occipital lobe [22, 23].
Figure 1. Positions and names of electrodes
Figure 2. Electrode distribution during EEG data collection
2.3 Experiment time and driver
The real vehicle experiment time of this study is from July to August 2020. To avoid interference of the drivers by traffic flow as much as possible, the experimental period is selected in the common period (9 am to 11 am and 2 pm to 4 pm). From the traffic accident statistics of the whole tunnel, there are more traffic accidents at the entrance and exit sections [8]. One of the main reasons is that the illumination inside and outside the tunnel is quite different, and the “black hole effect” at the entrance and the “white hole effect” at the exit are more serious. The undersea tunnel has 24-hour artificial lighting and the illumination of the tunnel is stable in the range of 60-200 lux. The illumination outside the tunnel can reach 40000-80000 lux on sunny days. The greater the illumination outside the tunnel, the more serious the “black hole effect” at the entrance and the “white hole effect” at the exit of the undersea tunnel, and the greater the threat to traffic safety. In fact, for the entrance and exit of the undersea tunnel, the harsh environment is a sunny day with high illumination. Therefore, in order to ensure the practicability of this study, the sunny day with better weather was selected for the experiment. Before the experiment, the natural light intensity will be measured to ensure that the natural light illumination is higher than 40000 lux in the experimental period.
A total of 26 drivers participated in the real vehicle experiment. All the drivers had more than 2 years of driving experience and were in good health. Three days before the real vehicle test, all drivers were supposed to hold to a reasonable diet and good sleep without drinking and medication behaviors. To make the drivers better adapt to the experimental vehicle and route, all drivers have 1-2 trial drives before the experiment.
A series of processing such as bad segment elimination, EEG segmentation, filtering, EEG frequency segmentation, baseline calibration, and artifact removal are performed on the collected EEG data, and then the EEG power spectrum, EEG power and other characteristic quantities are further extracted. Laida criterion method is selected to eliminate the abnormal values in the EEG data, and the formula is as follows:
$\left|X_{i}-\bar{X}\right|>3 \sigma$ (1)
where, Xi is the data of each experimental sample; $\bar{X}$ the arithmetic mean of each sample; $\sigma$ is the standard deviation of the experimental sample.
3.1 Characteristic analysis of the entrance and exit of an undersea tunnel
The existing research shows that the length of the entrance and exit sections of the undersea tunnel is approximately 150 m, and the influence distance of the tunnel external light is approximately half of the length of the entrance and exit sections of the undersea tunnel [11]. Take the average illuminance of all drivers during the experiment and draw the illuminance distribution map from the Huangdao District to the Qingdao District of the Jiaozhou Bay Undersea Tunnel (Figure 3).
Figure 3 shows that the illuminance at the entrance and exit of the undersea tunnel changes dramatically from 58000 lux to 100 lux. The illumination of the artificial lighting in Jiaozhou Bay undersea tunnel is stable in 60-200 lux. Therefore, whether the illuminance is greater than 200 lux is used as the criterion to determine whether a certain area of the undersea tunnel is affected by the natural light outside the tunnel, and then calculate the influence distance of the natural light. It can be found that the influence distance of external light at the entrance of the undersea tunnel is slightly larger than that of the exit, and the influence distance of external light at the entrance and exit is 91 m and 70 m, respectively. At the same time, the entrance and exit of the undersea tunnel have a large longitudinal slope, and the driver will be affected by the coupling of illumination and longitudinal slope when driving through the entrance and exit.
Figure 3. Illumination distribution
3.2 Power spectrum analysis
According to the frequency, EEG signals can be divided into δ waves, θ waves, α waves and β waves [24, 25]. The EEG frequency can reflect the excitement of neurons to a certain extent. The higher the EEG frequency is, the more active the brain state will be; the lower the EEG frequency is, the greater the inhibition of neuron excitement will be [26]. The EEG power spectrum indicates the degree of excitement or inhibition of the brain. When the brain is in an excited state, low-frequency signals decrease and high-frequency signals increase. When the brain is in a suppressed state, high-frequency signals decrease and low-frequency signals increase [27].
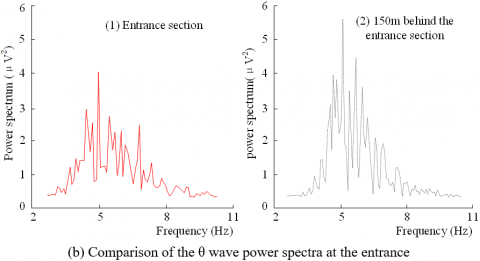
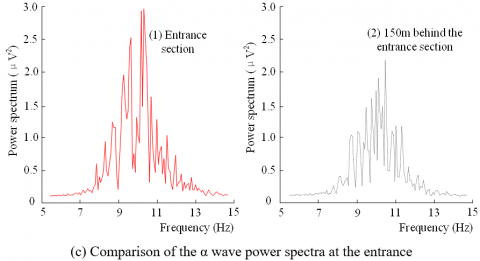
The entrance section and exit section of the undersea tunnel are selected as the research objects, 150 m after the entrance section and 150 m before the exit section are selected as the control group, and the EEG power spectrum changes of the driver passing through the area near the entrance and exit of the undersea tunnel are compared and analyzed.
Figure 4 shows that the power spectrum of the EEG α and β waves of the driver is obviously greater at the entrance section than 150 m behind the entrance section. The power spectrum of the δ and θ waves of the driver is obviously smaller at the entrance section than 150 m behind the entrance section. This result shows that the driver’s brain is more excited at the entrance section than 150 m behind the entrance section of the undersea tunnel. When the driver drives into the undersea tunnel, with the sharp decrease of illumination at the entrance of the undersea tunnel, the driver will have a “bright-dark-bright” visual change process, which will cause serious interference to the driver’s vision, the driver’s ability to perceive the road environment is reduced, the mentality is highly stressed, and the probability of traffic accidents increases.
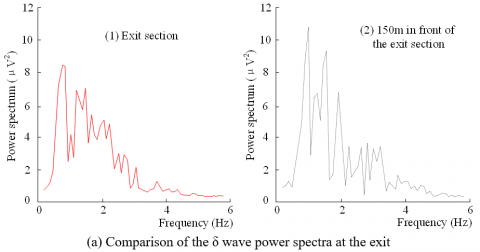
Figure 5 and Figure 4 have the same trend, which shows that the driver’s brain is more excited at the exit section than 150 m before the exit section of the undersea tunnel. When the driver drives away from the undersea tunnel, with the sharp decrease of illumination at the exit of the undersea tunnel, the driver will have a “dark-bright-dark” visual change process, which will also cause serious interference to the driver’s vision, and induce traffic accidents.
Figure 4. Comparison of the power spectra at the entrance of the undersea tunnel
Figure 5. Comparison of the power spectra at the exit of the undersea tunnel
3.3 Power analysis
The power spectrum of the EEG signal can be further processed to obtain the power of the EEG signal. Because EEG signals can be considered random signals, the power of EEG signals can be obtained using the following methods:
$P_{i}=\frac{1}{t}\left|S_{i}(t)\right|^{2} d t=\frac{1}{n} \sum_{k=1}^{n}|x(k)|^{2}$ (2)
where, Pi is the EEG signal power of frequency (i= δ wave, θ wave, α wave, β wave); t is the time; Si(t) is the power spectrum; x(k) is the amplitude of various EEG discrete points; and k is the period.
In the study of driver physiological states, EEG power is often used to represent driver brain activity [28, 29]. Among them, β waves and (θ+α)/β are the most sensitive to brain activity. The greater the power of the β wave is, the more excited the driver’s brain will be, and the lower the power of the β wave is, the sleepier the driver’s brain will be; the larger (θ+α)/β is, the sleepier the driver’s brain will be, and the smaller (θ+α)/β is, the more excited the driver’s brain will be. In general, the β wave power of the driver’s EEG is between 3-7, and (θ+α)/β is between 4-16.
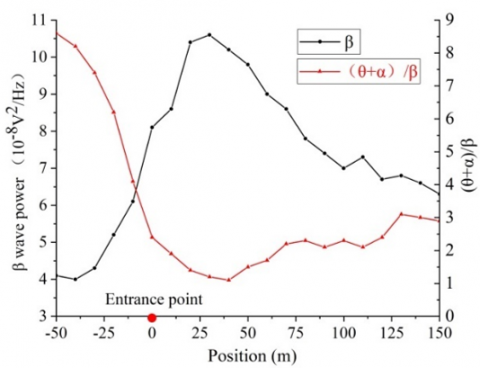
Taking the study area of the undersea tunnel as 50 m in front of the entrance point to 150 m behind the entrance point and 150 m in front of the exit point to 50 m behind the entrance point, the power values of the β wave and (θ+α)/β of all experimental drivers passing through the study area are calculated (Figure 6, Figure 7).
Figure 6 shows that while entering the undersea tunnel, the driver’s EEG signal β wave and (θ+α)/β change drastically. From 30 m before the entrance point to 30 m after the entrance point, the β wave increases rapidly and reaches the peak value. From 40 m after the entrance point to 150 m after the entrance point, the β wave gradually decreases. Over the entire entrance section, the β wave is maintained at a high level. From 40 m before the entrance point to 40 m after the entrance point, (θ+α)/β decreases rapidly and reaches the minimum value. From 50 m to 130 m after the entrance point, (θ+α)/β increases slowly. Over the entire entrance section, (θ+α)/β is maintained at a low level. Generally, the driver’s brain activity level changes dramatically from approximately 30 m before the entrance point of the undersea tunnel. Approximately 30 m after the entrance point, the driver’s brain activity level reaches its peak, gradually decreases, and remains highly active over the entire entrance section.
Figure 6. β wave and (θ+α)/β change process in the entrance area
Figure 7. β wave and (θ+α)/β change process in the exit area
Figure 7 shows that while driving out the undersea tunnel, the driver’s EEG signal β wave and (θ+α)/β changes drastically. From 50 m in front of the exit point to 40 m after the exit point, the β wave changes rapidly and is maintained at a high level. From 80 m before the exit point to 30 m after the exit point, (θ+α)/β decreases first and then increases and is maintained at a low level. In general, brain activity is highly active from 80 m before the exit point to 40 m after the exit point.
Combined with Figure 3, a high degree of agreement is found between the variation law of β wave power and the illumination variation law of the entrance and exit sections. Near the entrance and exit, the illumination and β wave power are at a high level and change violently. Far from the entrance and exit, the illumination and β wave power gradually decrease and tend to be stable.
The brain topographic map is a plane map in the shape of the human brain and can clearly reflect the activity of different regions of the brain [30]. Taking the first experimental driver as an example, the EEG signal power was processed to obtain a brain topographic map, as shown in Figure 8 and Figure 9.
Figure 8. Brain topographic map of the process of entering the undersea tunnel
Figure 9. Brain topographic map of the process of driving out of the undersea tunnel
Figure 8 and Figure 9 show that the driver’s brain topographic map changes substantially, and the change trend is similar to that in Figure 6 and Figure 7. From 30 m before the entrance point to 100 m after the entrance point, the driver’s brain activity level is higher, and the active brain region gradually transits from the occipital lobe to the frontal lobe. The occipital lobe and frontal lobe are the visual function center and the motor function center, respectively, which indicates that while driving into the undersea tunnel, the driver is first disturbed by vision and then by d movement. Ninety meters before the exit point and 30 m after the entrance point of the undersea tunnel, the driver’s brain activity level is higher, the active brain regions are primarily concentrated in the frontal lobe, and the changes in active brain regions are not obvious.
4.1 Model of the illumination of the undersea tunnel and driver EEG power
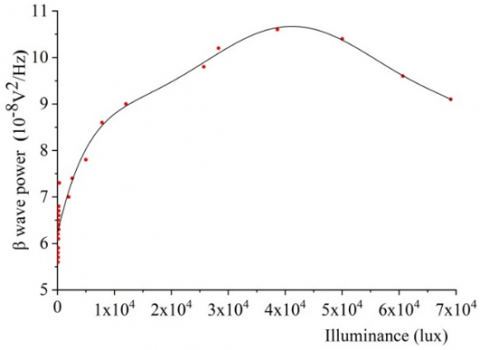
Take the average of the β wave power and (θ+α)/β of the EEG signal, take the illuminance of the undersea tunnel as the independent variable, and take the β wave power and (θ+α)/β as the dependent variable, and use ORIGIN to fitting them. The scatter diagram and fitting curve of illuminance, β wave power and (θ+α)/β of the undersea tunnel are shown in Figure 10 and Figure 11.
Figure 10 shows that when a driver is driving in an undersea tunnel, the model of the β wave power of the EEG signal and the illuminance is:
$f_{1}(x)=6.21+5.39 x_{1}-4.37 x_{1}^{2}-1.95 x_{1}^{3}-4.35 x_{1}^{4}$
$+4.62 x_{1}^{5}-1.87 x_{1}^{6}$ (3)
where, f1(x) is the β wave power (10-8V2/Hz); x1 is the illuminance (lux). The fitting determination coefficient R2 is 0.95, indicating that the reliability of the fitted model is good.
The β wave power increases first and then slowly decrease, and when the illuminance value is 41000 lux, the β wave power reaches the maximum. When the illuminance value is less than 8000 lux, the β wave power changes fastest; when the illuminance value is greater than 3000 lux, the β wave power is at a higher level, and the driving risk is high.
Figure 11 shows that when a driver is driving in an undersea tunnel, the model of (θ+α)/β of the EEG signal and the illuminance is:
$f_{2}(x)=3.37-4.12 x_{1}+4.49 x_{1}^{2}-2.37 x_{1}^{3}+6.07 x_{1}^{4}$
$-7.34 x_{1}^{5}+3.36 x_{1}^{6}$ (4)
where, f2(x) is the (θ+α)/β; x1 is the illuminance (lux). The fitting determination coefficient R2 is 0.92, indicating that the reliability of the fitted model is good.
As the illuminance increases, (θ+α)/β first decreases and then slowly increases. When the illuminance value is 37000 lux, (θ+α)/β reaches the minimum. When the illuminance value is less than 6500 lux, (θ+α)/β changes the fastest; when the illuminance value is greater than 1000 lux, (θ+α)/β is at a low level, and the driving risk is high.
Figure 10. Fitting curve of illuminance and β wave power
Figure 11. Fitting curve of illuminance and (θ+α)/β
4.2 Model of the longitudinal slope of the undersea tunnel and driver EEG power
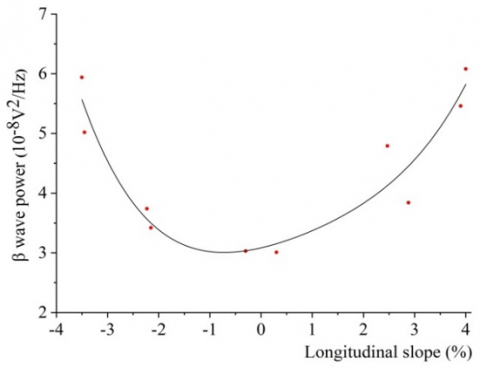
Take the average of the β wave power and (θ+α)/β of the EEG signal, take the longitudinal slope of the undersea tunnel as the independent variable, and take the β wave power and (θ+α)/β as the dependent variable, and use ORIGIN to fitting them. The scatter diagram and fitting curve of the longitudinal slope, β wave power and (θ+α)/β of the undersea tunnel are shown in Figure 12 and Figure 13.
Figure 12. Fitting curve of the longitudinal slope and β wave power
Figure 13. Fitting curve of the longitudinal slope and (θ+α)/β
Figure 12 shows that when a driver is driving in an undersea tunnel, the model of the β wave power and the longitudinal slope is:
$f_{1}(x)=3.08+0.2 x_{2}+0.11 x_{2}^{2}-0.02 x_{2}^{3}+0.01 x_{2}^{4}$ (5)
where, f1(x) is the β wave power (10-8V2/Hz); x2 is the longitudinal slope (%). The fitting determination coefficient R2 is 0.89, indicating that the reliability of the fitted model is good.
The fitting curve of the longitudinal slope and β wave power resembles a convex parabola. With the increase in longitudinal slope, the β wave power decreases first and then increases and reaches the minimum value when the longitudinal slope is -0.8. The fitting curve is approximately symmetrical. The greater the absolute value of the longitudinal slope is, the greater the power of the β wave will be, and the greater the EEG activity of drivers will be.
Figure 13 shows that when a driver is driving in an undersea tunnel, the model of (θ+α)/β and the longitudinal slope is:
$f_{2}(x)=13.35-1.34 x_{2}-2.78 x_{2}^{2}+0.12 x_{2}^{3}-5.74 x_{2}^{4}$ (6)
where, f2(x) is the (θ+α)/β; x2 is the longitudinal slope (%). The fitting determination coefficient R2 is 0.91, indicating that the reliability of the fitted model is good.
With increasing longitudinal slope, (θ+α)/β first increases to the maximum value when the longitudinal slope is -0.5 and then decreases. The fitting curve is approximately symmetrical. The greater the absolute value of the longitudinal slope is, the smaller (θ+α)/β will be, and the more active the driver’s EEG will be.
4.3 Model of the coupling effect of the illuminance and longitudinal slope and driver EEG power
Taking the illuminance and longitudinal slope of the undersea tunnel as the independent variable, and take the β wave power as the dependent variable, and use ORIGIN to fitting them. The fitting surface and model of the β wave power under the coupling effect of the longitudinal slope and illuminance of the undersea tunnel are as follows:
Figure 14. Fitting surface of β wave power under coupling effect of longitudinal slope and illumination
$f_{1}(x, y)=4.51-0.08 x_{1}-3.87 x_{2}+0.13 x_{1}^{2}+1.28 x_{2}^{2}$ (7)
where, f1(x,y) is the β wave power (10-8V2/Hz); x1 is the illuminance (lux); x2 is the longitudinal slope (%). The fitting determination coefficient R2 is 0.79, indicating that the reliability of the fitted model is good.
The regions with β wave power higher than 7 were divided into two types: risk driving regions and high-risk driving regions. Figure 14 shows that risk driving regions are distributed in zones with illuminance greater than 38000 lux; high-risk driving regions are distributed in zones with illuminance greater than 52000 lux and longitudinal slope gradients of -4% to -2.5% or 2.5% to 4%. Combined with Figure 3, it is apparent that the illumination at 28 m behind the entrance point and 13 m in front of the exit point of the undersea tunnel is greater than 52000 lux, so this zone is a high-risk driving region. The length difference of the high-risk driving region at the entrance and exit of the undersea tunnel is related to whether a shading shed is installed. There is no shading shed at the entrance of the Jiaozhou Bay Undersea Tunnel, but a shading shed is installed at the exit. The shading plate can slow down the dramatic changes in illumination and reduce the “white hole effect” at the exit of the undersea tunnel, thereby reducing the length of the high-risk driving region at this exit [31].
Taking the illuminance and longitudinal slope of the undersea tunnel as the independent variable, and take the (θ+α)/β as the dependent variable, and use ORIGIN to fitting them. The fitting surface and model of (θ+α)/β under the coupling effect of the longitudinal slope and illuminance of the undersea tunnel are as follows:
Figure 15. Fitting surface of (θ+α)/β under the coupling effect of the longitudinal slope and illumination
$f_{2}(x, y)=13.67+0.19 x_{1}-1.07 x_{2}+0.01 x_{1}^{2}-7.18 x_{2}^{2}$ (8)
where, f2(x,y) is the (θ+α)/β; x1 is the illuminance (lux); x2 is the longitudinal slope (%). The fitting determination coefficient R2 is 0.89, indicating that the reliability of the fitted model is good.
The region with (θ+α)/β less than 4 is divided into two categories: risk driving regions and high-risk driving regions. Figure 15 shows that when the longitudinal slope of the entrance section is -3.50%, the road section with illuminance greater than 42000 lux is a risk driving region, and the road section with illuminance greater than 53000 lux is a high-risk driving region. When the longitudinal slope of the exit section is 4.00%, road sections with illuminance greater than 49000 lux are risk driving regions, and road sections with illuminance greater than 56000 lux are high-risk driving regions. According to Figure 3, the high-risk driving region is 22 m behind the entrance point of the undersea tunnel and 7 m in front of the exit point.
In this study, a real vehicle experiment was conducted in the Jiaozhou Bay Undersea Tunnel, and the characteristics of the entrance and exit were analyzed. The EEG signals of drivers passing through the entrance and exit were analyzed, and the conclusions are as follows:
(1) The illuminance within the entrance and exit of the undersea tunnel changes drastically, and the natural light outside the tunnel affects the entrance and exit distances of the Jiaozhou Bay Undersea Tunnel at 91 m and 70 m, respectively. A shading shed outside the entrance and exit can effectively reduce the “black hole effect” and “white hole effect”, which is conducive to driving safety.
(2) The tasks of driving into and out of the undersea tunnel are approximately inverse processes. The closer the driver is to the entrance and exit of the undersea tunnel, the lower the power of the δ and θ waves of the driver’s brain will be, and the higher the power of the α and β waves is, the more excited the brain will be.
(3) From 30 m before the entrance point to 100 m after the entrance point and 90 m before the exit point to 30 m after the exit point, the driver’s brain activity level was higher, and the active brain regions were primarily concentrated in the frontal lobe and occipital lobe.
(4) The illumination and longitudinal slope of the entrance and exit of the Jiaozhou Bay Undersea Tunnel have an important effect on driving safety. The area approximately 20 m behind the entrance point and the area approximately 10 m before the exit point are high-risk driving regions.
To further study the EEG changes of drivers at the entrance and exit of the undersea tunnel, the following issues need further exploration.
(1) The real vehicle experiments in this study were performed during the common period when traffic volume was smaller. During the experiment, the driver did not receive interference from other vehicles. If the driver is in a congested traffic flow, the results may be different from those of this study.
(2) This study did not distinguish certain characteristics of drivers. Drivers of different genders, age groups, and levels of driving experience may have different perceptions of longitudinal slope and illumination changes. Therefore, further research is needed on different driver types.
(3) The research object of this study is the entrance and exit of the undersea tunnel. The entrance and exit of the undersea tunnel have a complicated longitudinal slope while the illumination changes. No longitudinal slope change occurs at the entrance and exit of ordinary road tunnels. Therefore, the conclusions of this study are not fully applicable to ordinary road tunnels.
This research was supported by the Natural Science Foundation of Shandong Province, China (ZR2020MG021), the Humanities and Social Sciences Research Planning Foundation of Chinese Ministry of Education (18YJAZH067), and the Key Research and Development Project of Shandong Province (2018GGX105009).
[1] Song, C.Y., Zhou, S.M. (2012). The overall design of Qingdao Jiaozhou Bay subsea tunnel. Advanced Materials Research, 368-373: 2971-2976. https://doi.org/10.4028/www.scientific.net/AMR.368-373.2971
[2] Chen, L.J., Shi, P.X., Tang, Q., Liu, W., Wu, Q.L. (2020). Development and application of a specification-compliant highway tunnel facility management system based on BIM. Tunnelling and Underground Space Technology, 97: 103262. https://doi.org/10.1016/j.tust.2019.103262
[3] Domenichini, L., Torre, F.L., Vangi, D., Branzi, V. (2017). Influence of the lighting system on the driver's behavior in road tunnels: A driving simulator study. Journal of Transportation Safety & Security, 9(2): 216-238. https://doi.org/10.1080/19439962.2016.1173155
[4] Yang, C., Fan, S., Wang, Z., Li, W. (2010). Application of fuzzy control method in a tunnel lighting system. Mathematical and Computer Modelling, 54(3): 931-937. https://doi.org/10.1016/j.mcm.2010.11.018
[5] Jin, X., Zheng, J., Geng, X. (2020). Prediction of road traffic accidents based on grey system theory and grey Markov model. International Journal of Safety and Security Engineering, 10(2): 263-268. https://doi.org/10.18280/IJSSE.100214
[6] Yeung, J.S., Wong, Y.D. (2013). Road traffic accidents in Singapore expressway tunnels. Tunnelling and Underground Space Technology, 38: 534-541. https://doi.org/10.1016/j.tust.2013.09.002
[7] Zhou, H., Zhao Y., Shen Q., Yang, L., Cai, H. (2020). Risk assessment and management via multi-source information fusion for undersea tunnel construction. Automation in Construction, 111: 103050. https://doi.org/10.1016/j.autcon.2019.103050
[8] Ma, Z., Fang, S., Liu, S., Cai, B. (2020). Analysis of the relationship between the number of traffic accidents and the traffic flow & section location in extra long tunnel. Engineering, 12(2): 71-81. https://doi.org/10.4236/eng.2020.122007
[9] Sun, H., Wang, Q., Zhang, P., Zhong, Y., Yue, X. (2019). Spatialtemporal characteristics of tunnel traffic accidents in China from 2001 to present. Advances in Civil Engineering, 2019: 1-12. https://doi.org/10.1155/2019/4536414
[10] Chen, L., Huang, S., Yang, Can., Chen, Q. (2020). Analyzing factors that influence expressway traffic crashes based on association rules: using the Shaoyang–Xinhuang section of the Shanghai–Kunming expressway as an example. Journal of Transportation Engineering, Part A: Systems, 146(9). https://doi.org/10.1061/JTEPBS.0000425
[11] Pan, F.Q., Zhang, L.X., Wang, J., Ma, C., Yang, J., Qi, J. (2020). Lane-changing risk analysis in undersea tunnels based on fuzzy inference. IEEE Access, 8: 19512-19520. https://doi.org/10.1109/ACCESS.2020.2968584
[12] Zhao, W., Wang, L., Liu, H. (2013). Changes of driver's visual characteristics at the entrance of expressway long tunnel. Journal of Wuhan University of Technology, 37(2): 261-265. https://doi.org/10.3963/j.issn.2095-3844.2013.02.010
[13] Jiao, F., Du, Z., Wang, S. (2020). Research on drivers’ visual characteristics in different curvatures and turning conditions of the extra-long urban underwater tunnels. Tunnelling and Underground Space Technology, 99: 103360. https://doi.org/10.1016/j.tust.2020.103360
[14] Du, Z., Zheng, Z., Zheng, M. (2014). Drivers’ visual comfort at highway tunnel portals: A quantitative analysis based on visual oscillation. Transportation Research Part D: Transport and Environment, 31: 37-47. https://doi.org/10.1016/j.trd.2014.05.012
[15] Henrik, B., Terje, A. (2013). Treatment of uncertainty in risk assessments in the Rogfast road tunnel project. Safety Science, 55: 34-44. https://doi.org/10.1016/j.ssci.2012.12.012
[16] Casse, C., Caroly, S. (2019). Analysis of critical incidents in tunnels to improve learning from experience. Safety Science, 116: 222-230. https://doi.org/10.1016/j.ssci.2019.03.015
[17] Reimer, B. (2009). Impact of cognitive task complexity on drivers’ visual tunneling. Transportation Research Record, 2138(1):13-19. https://doi.org/10.3141/2138-03
[18] He, S., Liang, B., Pan, G., Wang, F., Cui, L. (2017). Influence of dynamic highway tunnel lighting environment on driving safety based on eye movement parameters of the driver. Tunnelling and Underground Space Technology, 67: 52-60. https://doi.org/10.1016/j.tust.2017.04.020
[19] Peng, J., Wang, C., Shao Y. (2018). Visual search efficiency evaluation method for potential connected vehicles on sharp curves. IEEE Access, 6: 41827-41838. https://doi.org/10.1109/ACCESS.2018.2861940
[20] Feng, Z., Yang, M., Zhang, W., Du, Y., Bai, H. (2018). Effect of longitudinal slope of urban underpass tunnels on drivers’ heart rate and speed: A study based on a real vehicle experiment. Tunnelling and Underground Space Technology, 81: 525-533. https://doi.org/10.1016/j.tust.2018.08.032
[21] Zheng, Z., Du, Z., Yan, Q., Xiang, Q., Chen, G. (2017). The impact of rhythm-based visual reference system in long highway tunnels. Safety Science, 95: 75-82. https://doi.org/10.1016/j.ssci.2017.02.006
[22] Yang, L., Guan, W., Ma, R., Li, X. (2019). Comparison among driving state prediction models for car-following condition based on EEG and driving features. Accident Analysis and Prevention, 133: 105296. https://doi.org/10.1016/j.aap.2019.105296
[23] Ramdani, S., Boyer, A., Caron, S., Bonnetblanc, F., Bouchara, F., Duffau, H., Lesne, A. (2021). Parametric recurrence quantification analysis of autoregressive processes for pattern recognition in multichannel electroencephalographic data. Pattern Recognition, 109: 107572. https://doi.org/10.1016/j.patcog.2020.107572
[24] Wascher, E., Arnau, S., Reiser, J.E., Rudinger, G., Karthaus, M., Rinkenauer, G., Dreger, F., Getzmann, S. (2019). Evaluating mental load during realistic driving simulations by means of round the ear electrodes. Frontiers in Neuroscience, 13: 940. https://doi.org/10.3389/fnins.2019.00940
[25] Brevers, D., Cheron, G., Dahman, T., Petieau, M., Palmero-Soler, E., Foucart, J., Verbanck, P., Cebolla, A.M. (2020). Spatiotemporal brain signal associated with high and low levels of proactive motor response inhibition. Brain Research, 1747: 147064. https://doi.org/10.1016/j.brainres.2020.147064
[26] Jafarifarmand, A., Badamchizadeh, M.A. (2020). Real-time multiclass motor imagery brain-computer interface by modified common spatial patterns and adaptive neuro-fuzzy classifier. Biomedical Signal Processing and Control, 57: 101749. https://doi.org/10.1016/j.bspc.2019.101749
[27] Kar, S., Bhagat M., Routray, A. (2010). EEG signal analysis for the assessment and quantification of driver’s fatigue. Transportation Research Part F: Traffic Psychology and Behaviour, 13(5): 297-306. https://doi.org/10.1016/j.trf.2010.06.006
[28] Wali, M.K., Murugappan, M., Ahmmad, B. (2013). Wavelet packet transform based driver distraction level classification using EEG. Mathematical Problems in Engineering, 2013: 1-10. https://doi.org/10.1155/2013/297587
[29] Chuang, C., Huang C., Ko, L.W., Lin, C.T. (2015). An EEG-based perceptual function integration network for application to drowsy driving. Knowledge-Based Systems, 80: 143-152. https://doi.org/10.1016/j.knosys.2015.01.007
[30] Almahasneh, H.A., Chooi, W.T., Kamel, N., Malik, A.S. (2014). Deep in thought while driving: An EEG study on drivers’ cognitive distraction. Transportation Research Part F: Traffic Psychology and Behaviour, 26: 218-226. https://doi.org/10.1016/j.trf.2014.08.001
[31] Li, S., Guo, M., Wang, L., Chai, M., Chen, F., Wei, Y. (2017). Analysis on the correlation degree between the driver’s reaction ability and physiological parameters. Mathematical Problems in Engineering, 2017: 1-8. https://doi.org/10.1155/2017/5215874