Nagarjuna Karyemsetty | Kontham Raja Kumar*
© 2020 IIETA. This article is published by IIETA and is licensed under the CC BY 4.0 license (http://creativecommons.org/licenses/by/4.0/).
OPEN ACCESS
The increasing rate of road fatalities has demanded the attention of the researchers, scientists, Industry and government organizations and technologies. The impact of accidents is simulated by rear-end collision with parameters such as vehicle position, direction, speed, inter-vehicle distance, and relative speeds, etc. Open source simulators have to be adopted to study and analyze various collision scenarios in vehicular networks. Safety mechanism proposed to minimize the possibility of accidents and mitigate the effect of the escalating incident. The proposed mechanism estimates the point of intersection, time to collision, and time to avoid accidents. Using parameters, the proposed mechanism able to determine accidents with 92.6% accuracy. The remaining 7.4% cases enable the passive safety system to help the people to stay alive, minimize the damage in case an accident.
Intelligent Transport System, traffic simulator, road accident, road safety, network simulator, vehicular network
In the present time, road congestion in smart cities, including Visakhapatnam, can be attributed to huge traffic heading for a maximum apart of the existing roads and lanes. This situation escalates during the peak making it difficult for traffic control and other agencies.
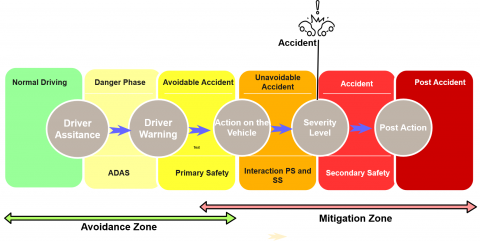
It is a matter of distress that services road accidents have not been decreasing over the last few years in all India level. On an average, 1214 traffic-related fatalities taking place. This corresponded by the loss to infrastructure in various metropolitan centers have a sufficient population with the continuous increase in available vehicles, the traffic has been raised in a galloping manner. The fatalities are often compiled by the injuries typical and grievous. The overall picture reveals that one road accident every minute and one road death every five minutes. It is also a challenge for vehicle manufacturers to set up safety domains from the alarming situation and prevent fatalities and damages. Figure 1 represents various stages of assistance provided to drivers to safeguard. Post-accident ensures the reduction in loss and escape from death situations. Complete control or auto control of vehicles in case of an emergency may help the people and severity level can be reduced as minimum as possible by enabling the post safety system such as an airbag etc.
SUMO (Simulation of Urban Mobility) is essentially a multi-model and real-time traffic simulator. It functions on open-source mode as per the need of every vehicle in which individually modeled externally in a customized way considering the traffic pattern.
The SUMO [1] is a specialized tool for representing simulations on a realistic basis. As a traffic simulator, it can create a road network from external sources and convert the same in appropriate format. A routing level (DUAROUTER) is available to compute the shortest route.
Network and trips can be taken as parameters for generating a route file that has routing state information for each vehicle in a specific network. Moreover, random trips manually created demand nations, and provision of various parameters for the generalized networks are also considered.
In real-time, there is a need to estimate driver awareness by prediction of collision and related fatal accidents. Utilizing sensor technology, Intelligent Transport System (ITS) can guide the drivers. The data regarding vehicles in the neighborhood, experience as well as the condition of the driver are the significant factors for determining potential collision in the early warning prose. For the condition of emergency, safety systems can give alerts for warning and safety system for avoiding collision to mitigate the consequences.
The remaining part of this paper is prepared as follows. Section II analyses the literature, and related works contributed to the active safety system are discussed. The proposed safety approach, including identification of collision variables and building safety model, are discussed in Section III. Simulation of real-time road network scenarios and the creation of accident scenarios are specified in Section IV. In section V, the proposed read end collision model with real-time representation is described with detailed procedure with the theoretical analysis presented. In Section VI, the result and possibilities of future scope are discussed, followed by the conclusion in section VII.
SUMO real-time traffic simulator provides a generic traffic demand on a grid network or customized network through NET GENERATE python command for starting and monitory observations. Moreover, Open Street Maps are having the capability of generating real-time traffic networks by Google maps as per the need to construct experimental setups in the creation or generation of accidents. Dingil et al. [2] utilized advanced software packages, the SUMOPy, and OSMNx. These packages can be extended for complex junctions.
Erdmann et al. [3] have proposed a modeling pedestrian behavior in SUMO. The authors extended the COLOMBO project by adding road network format, movement models, and routing tools to SUMO. Pedestrian models, including crosswalk, sidewalks also discussed. Results can be extended to VANET to include pedestrians in addition to vehicles and infrastructure simulation.
Dynamic peer-to-peer modeling in vehicular ad-hoc network for data scavenging with the integration of SUMO and TracCI4Matlab implemented by Lim et al. [4]. Authors utilized the traffic control interface commands, properties of the vehicle to export data. Based on this data, the behavior of routing and re-routing protocols computed and assessed.
Xu et al. [5] implemented three connected vehicle application scenarios, including collision avoidance. The authors utilized the GPS position and velocities to the test vehicles and recorded field test results. Scenarios are tested on DSRC and 4G LTE. Authors utilized an LTE CPE manufactured by Datang Mobile Co. Ltd. and a DSRC Wave box developed by Genvict Co., Ltd., for the field test. Performance metrics such as round trip time, packet loss rate, and throughput of the network are measured in the collision avoidance scenario.
Wegener et al. [6] have focused on the general and adaptable framework using TraCI package to integrate road traffic and network for controlling the mobility. The authors utilized the SUMO and NS2 tools to implement the framework. The authors detailed the low-level command, syntax, data types, and formats required to simulate. Run time simulations of Traces, TraCI, and static are evaluated on the server.
Using relative kinetic energy density, a coordinated collision avoidance mechanism has been proposed by Hu et al. [7] for connected vehicles. Conventional systems focused on connected vehicles having onboard sensors ignoring the influence on upstream traffic. This proposed strategy for connected vehicles has the capability of avoiding collision and smoothing the breaking behavior of multiple vehicles resulting in augmentation for smoothness of traffic.
A cooperative collision avoidance system suitable for a 4-lane highway based on VANET has been suggested by Kauser et al. [8]. The emphasis is the car to car communication, which reduces the need for roadside went by permitting the vehicles to provide critical and relevant information directly with another vehicle, effectively preventing the risk of collisions. A reliable method has been developed for a high-end transport solution.
Figure 1. Hybrid safety model
Figure 2. Safety applications
Passive safety elements such as seat belts, airbags, and anti-lock brake systems contribute a lot to safer driving in our daily life, as shown in Figure 1. Passive safety or post safety phase enables the safety elements post to the accident or after the accident to minimize the loss in addition to the passive safety stage, which saves the life of drivers and passengers in an accident, active safety systems that can be implemented to prevent the impact of the collision before they become a reality, a concrete mechanism to prevent crash-related injuries and damages. As a top priority to the Safety of drivers and people during the journey, Safety domain can be categorized into different safety applications such as Proactive Safety, Active Safety, and Passive Safety, as shown in Figure 2.
Passive Safety indicates the features that help vehicles, drivers, passengers, and surroundings stay alive and uninjured in a collision includes seat belts and airbags, etc. The size of the vehicle (bigger is safer) is also included as a passive safety feature. Dimensions of the vehicle also play a critical role in road safety. Hence, the proposed safety algorithm works based on the dimensions of the vehicle.
Active safety applications help drivers to escape or avoid accidents by obtaining details of nearby vehicles. Vehicle details include vehicle speed, direction, and position of vehicles. Intelligent Transport System (ITS) computes the distances between two vehicles based on position vehicles and also calculate relative speeds, and an intelligent decision is taken to warn the drivers for safe driving, continuously monitoring this approach helps to avoid an accident.
The proactive safety stage predicts the critical situations, analyzes, and selects the best affirmative action to deal with safety driving, thus preventing the possible collisions, which leads to safe driving. This includes autonomous vehicle applications such as collision avoidance etc. and non-autonomous vehicle applications such as lane change warning etc. Proactive qualities are input for active safety features or selected new features that would not be possible without vehicular communication. Even then, active safety components should be encouraged, radar-based safety systems should be preferred together with proactive Safety selected parameters to validate the support of information provided by the vehicular communication. Beacons are messages used to communicate between vehicle nodes. Proactive safety features are based on permanent beacons that consist of vehicle data (position, velocity, direction, etc.) used to estimate or bi-pass an accident that may occur. Vehicular communication system consists of the following essential elements:
A digital map database (Digital Road Map) in this work open street goggle map is used to represent the road traffic
Permanent messages and specific sensor (wireless beacon messages)
Integration from multiple sensors/vehicle communication (Formation of Vehicular communication network)
An intelligent Logic system that interprets incoming messages and makes decisions (Intelligent Safety System).
3.1 Real-time factors influencing road accidents
Literature reveals that the leading causes of an accident include the following three categories primarily, i.e.,
Human behavior
Vehicles condition, and
External environment mainly road fitness,
Figure 3. Risk factors
Human factors, vehicle conditions, and Environment conditions, as indicated in Figure 3. Environmental Conditions
Surface of Road
Gravity
Road condition
Weather conditions
Time of travel
Vehicle Dynamics
Brake state, pressure,
Speed and acceleration of the vehicle
Dimensions of vehicle
Weight of vehicle
Steering wheel angle, wheel speed
Driver Condition
Reaction Time of Driver
Experience of Driver
Male or Female
Age
Health condition of the driver
Pulse Rate
Any medication status
3.2 Safety algorithm
The real-time, open-source traffic simulator, named SUMO Simulator, used to simulate the road network of Visakhapatnam, India, considered as the real-time road network.
Steps to handle rear-end collisions:
(1). Start
(2). Read local and neighbor vehicle position details
(3). Set brake state to the ideal
(4). Set Safe range, warning range and danger range to ideal
(5). Set TTC, TTA to zero
(6). While True
Compute the distances
V-front, Vrear, V-left & V-right Compute PoI
Calculate TTC and TTA
Assign Margin Time based on TTC
(7). If margin time more than Safety then Issue significant safe
Message to the driver.
(8). If margin time moderate and controlled speed, then issue
Significant warning message to the driver to reduce speed
(9). If margin time is low and auto-controlled, then issue
Significant danger message to the driver and automatic control to reduce speed
(10). Stop
Depending on the speed and inter-vehicle distance, we classified the three safety scenarios and one post-accident scenario as detailed in Figure 1.
Case 1: Safe Domain
In this safe domain, the vehicle speed is high, and inter-vehicle distance is also high, ensure the Safety of vehicles, drivers, and people.
Case 2: Warning Domain
In this warning domain, the vehicle speed is high, and inter-vehicle distance is low, then we can't ensure the Safety of vehicles, drivers, and people. Hence, warning alert will be generated to the driver to get more attention and slow down the vehicle by reducing the speed of the vehicle.
Case 3: Danger Domain
In danger domain, if the vehicle speed is high or medium and inter-vehicle space is shallow, to ensure the Safety of the vehicle, driver, and passengers, then danger alert will be raised to driver and auto control of speed by safety system and ready to enable the passive Safety in which safety system helps people to stay alive and uninjured in the collision.
Case 4: Passive Safety or Post Accident
In this Passive Safety, even though our safety algorithm predicts 96% accidents and remains 4% chances of occurring collision. In these cases, our safety model enables passive safety system (post-accident) to help people to stay alive and minimize the damage by enabling airbags, alert surrounding, location sharing to nearest hospitals, and also connects the vehicle insurance and personal insurance to share information simultaneously. The safety matrix details the scenarios.
4.1 Representation of real-time road network
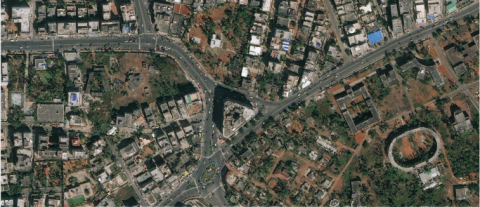
The real-time, open-source traffic simulator, named Simulation of Urban MObility (SUMO) Simulator, used to simulate the road network of Visakhapatnam. This simulator provides different traffic flows, lanes, traffic control signals, vehicle movements, and different kinds of vehicles, including emergency vehicles, etc., also support to import road network manually from Open Street Map (OSM) [9] as shown in Figure 4.
The individual commands line tools of SUMO, such as Net convert, Polyconvert, and Random trips, are useful in converting the open street maps data into configuration (CFG) as shown in Figure 5.
Figure 4. Road traffic in google map
Figure 5. Traffic generation
The network comprises:
Every street (edge) is shown as a group of lanes covering position, shape and speed time of every lane.
Traffic light logic is shown with reference to junctions.
The rules show junctions.
Connections between lanes are shown junctions or nodes
4.2 Simulation of road network scenarios
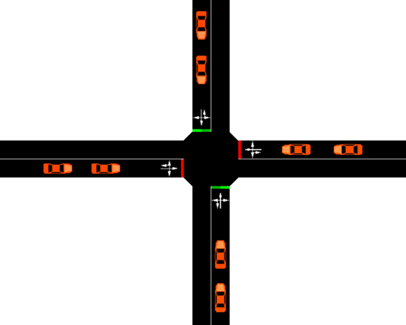
The traffic network represented in the SUMO simulator is a directed graph. Nodes in the graph are represented as junctions or signal controls, and edges are roads or streets. Every street is a collection of edge (lane)s, including the length, shape, and speed limit of every lane, etc. Traffic lights logic implemented at junctions. Each junction is a collection of road segments. eXtensible Markup Language (XML) [10] used to represent nodes, edges, and routes. The result of the creation of vehicles, nodes, edges is shown in Figure 6. The safe distance among the vehicles can be monitored continuously, as shown in Figure 7.
The file generation in SUMO becomes the source file for NS2 [11] simulation; the node pattern of mobility can be coded in TCL or processed by generating a trace file that may be used as a command-line compatible with TCL file. Network animator in NS2 illustrates the network, from the mobility files generated by SUMO, as shown in Figure 8a and Figure 8b.
Figure 6. Four road junctions
Figure 7. Safety distance
a. Vehicular communication in NS2 simulator
b. Vehicular network in NS2 simulator
Figure 8. V2V communication
4.3 Integration of road traffic and network simulation
It is worth noting that NS2 is an event-oriented network suitable for different protocols. Its main advantage includes open source code, facility to modify mechanism as per customer's requirements, extendibility, and stability. It can support up to 20,000 nodes for realistic studies. This simulation tool is amenable to C++ and OTCL applicable for mobility nodes in VANETs, and some VANET Simulation scenarios are shown in Figure 8.
5.1 Enhancement of existing safety algorithm
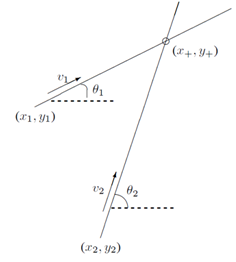
Some of the required real-time factors such as location, speed, and dimensions of the vehicle are considered and applied to the safety algorithm. Figure 9 shows the simple calculation of TTC [12]. Assume, two vehicles are positioned at (x1; y1), (x2; y2), are moving at speeds v1, v2, in the directions µ1, µ2 respectively, and a collision is identified at (x+,y+) from the possibility of collision described in Figure 12.
In a simplified approach [13], we first compute the expected point of intersection (PoI) (x+; y+) by using both vehicle headings and locations, given by the following Eq. (1) and (2) for x and y coordinates respectively. Algebraic model to compute the cross point of intersection given in Eq. (1) and (2).
$x_{+}=\frac{\left(y_{2}-y_{1}\right)-\left(x_{2} \tan \theta_{2}-x_{1} \tan \theta_{1}\right)}{\tan \theta_{1}-\tan \theta_{2}}$ (1)
$y_{+}=\frac{\left(x_{2}-x_{1}\right)-\left(y_{2} \cot \theta_{2}-y_{1} \tan \theta_{1}\right)}{\cot \theta_{1}-\cot \theta_{2}}$ (2)
Figure 9. Point of intersection
Once PoI is computed, the procedure to calculate the time is taken to reach the intersection by two vehicles. It is represented as time-to-collision (TTC). In ordered to ensure Safety by avoiding collision, a safety factor α is considered. Setting the safety parameter and its relationship as shown in Eq. (3)
$\left|T T X_{1}-T T X_{2}\right|<\alpha$ (3)
where, term TTX1 and TTX2 are times of vehicle 1 and 2 to reach PoI, and the α is the safety parameter. The higher the α value, the more conservative the algorithm becomes. Hence the absolute value of TTX1-TTX2 should go as high as possible but lower the value lead to a collision, and finally, when TTX1 = TTX2, the collision detected.
If the two vehicles reach the intersection point at the same time, then TTX1 = TTX2, indicates there is a collision. Once there is a collision, the time taken to reach the intersection point by vehicle 1 and vehicle 2 are the same. Therefore, TTX is the same as time-to-collision (TTC) as shown Eq. (4)
$T T C_{i}=\left\{\begin{array}{c}T T X_{i} \\ \text {Undefined}\end{array}\right.$TTX1=TTX2 (4)
Analysis of proposed safety model for computing TTC:
Figure 10 represents the same scenario as a simplified model except for that dimensions of the vehicle. Assume that vehicles have a certain size and are not abstract points, the following collision criteria are used instead of the simple equivalence condition, and every vehicle is represented with the size of length and width and four edges, as shown in Figure 11a and 11b.
Figure 10. Improved safety model
Figure 11. Possible accident scenario
Figure 12. Some possible accidents
For example, out of many accident configurations, one configuration is shown above and elaborated below.
The dimensions of vehicle one is indicated as A1, B1, C1 & D1, and similarly, vehicle 2. As shown in Figure 13, the corner of vehicle two i.e. point A2 hits the vehicle1 side, i.e., C1D1. If any clash detects, then the intersection point should be Q1. To conclude the collision, the following two conditions must be satisfied.
The time taken by corner A2 to reach Q1 indicated as TA21. Similarly, vehicle 1 to D1 as TD11.
The time cornernA2 takes to reach the intersection Q1 is TA21. It must be <= to C1 to reach Q1 (TC11) because, if C1 arrives early, vehicle one has passed by the intersection point, and therefore there is no change on A2.
So, if TC11 > TA21> TD11 satisfies, a collision guarantee and hence, TTC is given by time to reach the intersection point, that is TTC = TA21
When two vehicles coincide, it can be seen that the corner of one vehicle comes into contact with others. In the normal and specific cases, there is 32 possible situations in which some are shown in Figure 12.
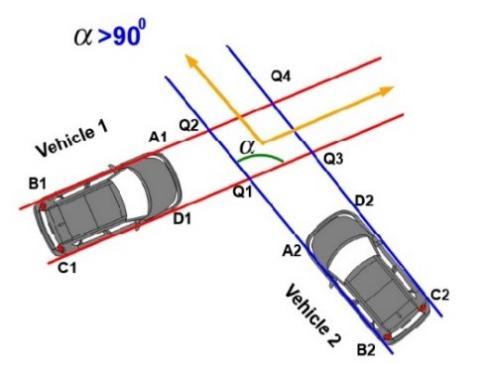
Once a collision is detected [14], the safety algorithm takes intelligent decisions by computing TTC and decides whether to issue a warning or not. One way to review when to issue a warning is by comparing the time-to-collision with the time-to-avoidance. Based on ground truth, time-to-avoidance depends on many factors such as the alertness of the vehicle, the response time of the driver, and selection time to avoidance, etc. instead of considering everything into account, in this work, more focus on the physical factors which can be parameterized, such as the response time tr of a driver was given preference. In this work, braking time as our expected avoidance measure, and propose TTA formula based on the assumption of constant deceleration considered and detailed accident configuration angle when α > 900 & α < 900 and specifically α > 90° was shown in Figure 13.
Accident configuration when α > 90° scenario was considered to evaluate the safety algorithm, as shown in Figure 13. Four corners of vehicle one is represented as A1, B1, C1 & D1, and similarly, vehicle two as A2, B2, C2 & D2, and PoI is divided into four quadrants such as Q1, Q2, Q3 & Q4 as shown below. The time taken by corner A1 and A2 to reach the intersection Q1 is donated as TA11 and TA21, respectively.
Figure 13. Representation and analysis of accident scenario
Some accident configurations when α > 900 are shown in Figure 8. Accident situations such as vehicle two hits side vehicle1, corner vehicle one hits front part of vehicle 2, corner vehicle one hits side vehicle two and corner vehicle two hits front part of vehicle1. Our safety algorithm analyses [15] these situations and predicts the TTC based on time to reach PoI and predicts one of the possible situations, and depending on the level of phase, the concerned system will be enabled to remove anyone's mandatory condition, which leads cause accident.
Many methods are proposed in the literature to estimate the accident and prevention of accidents. Still, the proposed method considers vehicle dynamics especially break time, the distance between the leading vehicle and following vehicle, time to collision, and time to avoidance for predicting road accidents.
5.2 Evaluation parameters for the prediction accuracy of the proposed safety algorithm
The following evaluation parameters are considered to validate our proposed safety algorithm.
a) Point of Intersection (PoI)
b) Time To Collision (TTC)
c) Time To Avoidance (TTA)
d) Time To Post Accident
PoI is a measure to indicate the crossing point of two vehicles concerning speed and distance. This is based on the basic algebraic model to compute the intersection point, as given above, section 3. Time to collision (TTC) represents the time taken by the vehicle to reach PoI. Time to avoidance (TTA) represents the time to avoid an accident after predicting the collision. Time to post-accident indicates the time available after the accident to enable auto safety elements such as airbags—alarm, sharing locations, etc.
6.1 Performance analysis of proposed safety algorithm
To validate the accuracy of the proposed safety model, five different outcome phases are considered, as shown in Table 1 safety matrix. As specified in section 5, using vehicle position, its dimensions, and PoI, as shown in Figure 11a and 11b, two cases are used to evaluate the algorithm as shown below:
Table 1. Safety matrix
|
Safety Matrix |
Relative Speed |
|||
|
High |
Medium |
Low |
||
|
Inter vehicle distance |
High |
Safety |
Safety |
Warning |
|
Medium |
Warning |
Danger |
Danger |
|
|
Low |
Danger |
Danger |
Danger |
|
Case 1: Assume both vehicles are position 10 m apart from the central point of intersection. The dimension of vehicles is 2 x 5 m. vehicle one speed is 20 m/s, and vehicle two speed is 19 m/s.
Following the method [11], in both scenarios, the intersection point should occur at the central point of crossing then, the time required to both vehicles take to reach that point is computed as
TX1= 10/20 = 0.5 s
TX2= 10/19 = 0.526 s
Absolute value | 0.5 – 0.526 | = 0.026 which is greater than safety parameter
Therefore, the simplified algorithm predicts as no collision
Using the proposed safety approach,
TC11= 15/20 = 0.75 s
TA21 = 10/19 = 0.526 s
TD11 = 10/20 = 0.5 s
Since TC!! > TA21 > TD11 is satisfied for above scenarios,
Proposed safety approach, predict it as collision
Case 2: Assume both vehicles are positioned 10 m apart from the central point of intersection. The dimension of vehicles is 2 x 5 m. vehicle one speed is 25 m/s, and vehicle two speed is 19 m/s.
Following the method [11], in both scenarios, the intersection should occur at the central point of crossing then, the time both vehicles take to reach that point is computed as
TX1= 10/25 = 0.4 s
TX2= 10/19 = 0.526 s
Absolute value | 0.4– 0.526 | = 0.126 which is greater than safety parameter
Existing approach predicts as collision
Using the proposed safety approach,
TC11= 15/19 = 0,789 s
TA21 = 10/20 = 0.5 s
TD11 = 10/19 = 0.526 s
Since TC11 > TA21 > TD11 is not satisfied for above scenarios,
Proposed safety approach, predict it as not collision
Performance analysis of the proposed safety algorithm shown in the confusion matrix given below.
6.2 Result
The performance analysis of the safety algorithm can estimate the accidents with 92.6% accuracy. A trace log file is a place where all events are logged when simulating vehicular communication using the SUMO traffic simulator. Table 3 shows the log file of the rear-end collision scenario generated in the SUMO Simulator. This log file details every action in the scenario. Specifically, a part of vehicle 4 log data such as position, speed, etc. shown in Table 2.
Table 2. Confusion matrix
|
Confusion Matrix |
Prediction |
||
|
Simple Alg |
Proposed |
||
|
Ground Truth |
Collision |
No collision |
Collision |
|
No Collision |
Collision |
No Collision |
|
Table 3. Trace log in SUMO
|
ID |
Route |
Type |
Waiting |
Lane |
Position |
Speed |
x |
y |
Vehicle |
|
v0 |
left |
typeWE |
0 |
2o_0 |
365.47 |
2.28 |
880.22 |
508.35 |
v1 |
|
v0 |
left |
typeWE |
0 |
2o_0 |
368.02 |
2.55 |
882.77 |
508.35 |
v2 |
|
v0 |
left |
typeWE |
0 |
2o_0 |
370.44 |
2.42 |
885.19 |
508.35 |
v3 |
|
v0 |
left |
typeWE |
0 |
2o_0 |
372.74 |
2.3 |
887.49 |
508.35 |
v4 |
|
v0 |
left |
typeWE |
0 |
2o_0 |
375.17 |
2.43 |
889.92 |
508.35 |
v5 |
|
v0 |
left |
typeWE |
0 |
2o_0 |
377.82 |
2.65 |
892.57 |
508.35 |
v6 |
|
v0 |
left |
typeWE |
0 |
2o_0 |
380.25 |
2.43 |
895 |
508.35 |
v7 |
|
v0 |
left |
typeWE |
0 |
2o_0 |
382.64 |
2.38 |
897.39 |
508.35 |
v8 |
|
v0 |
left |
typeWE |
0 |
2o_0 |
385.26 |
2.62 |
900.01 |
508.35 |
v |
|
v0 |
left |
typeWE |
0 |
2o_0 |
387.85 |
2.59 |
902.6 |
508.35 |
v10 |
|
v0 |
left |
typeWE |
0 |
2o_0 |
390.18 |
2.33 |
904.93 |
508.35 |
v11 |
|
v0 |
left |
typeWE |
0 |
2o_0 |
392.54 |
2.36 |
907.29 |
508.35 |
v12 |
Table 4. Part of vehicle v4 log details
|
ID |
Route |
Type |
Waiting |
Lane |
Position |
Speed |
x |
y |
|
v4 |
left |
typeWE |
0 |
2o_0 |
365.95 |
2.47 |
880.7 |
508.4 |
|
v4 |
left |
typeWE |
0 |
2o_0 |
368.34 |
2.4 |
883.09 |
508.4 |
|
v4 |
left |
typeWE |
0 |
2o_0 |
370.77 |
2.42 |
885.52 |
508.4 |
|
v4 |
left |
typeWE |
0 |
2o_0 |
373.18 |
2.41 |
887.93 |
508.4 |
|
v4 |
left |
typeWE |
0 |
2o_0 |
375.71 |
2.52 |
890.46 |
508.4 |
|
v4 |
left |
typeWE |
0 |
2o_0 |
378.25 |
2.54 |
893 |
508.4 |
|
v4 |
left |
typeWE |
0 |
2o_0 |
380.56 |
2.31 |
895.31 |
508.4 |
|
v4 |
left |
typeWE |
0 |
2o_0 |
383.08 |
2.53 |
897.83 |
508.4 |
|
v4 |
left |
typeWE |
0 |
2o_0 |
385.68 |
2.6 |
900.43 |
508.4 |
|
v4 |
left |
typeWE |
0 |
2o_0 |
388.25 |
2.57 |
903 |
508.4 |
|
v4 |
left |
typeWE |
0 |
2o_0 |
390.68 |
2.43 |
905.43 |
508.4 |
|
v4 |
left |
typeWE |
0 |
2o_0 |
393.07 |
2.39 |
907.82 |
508.4 |
|
v4 |
left |
typeWE |
0 |
2o_0 |
395.36 |
2.29 |
910.11 |
508.4 |
|
v4 |
left |
typeWE |
0 |
2o_0 |
397.86 |
2.49 |
912.61 |
508.4 |
|
v4 |
left |
typeWE |
0 |
2o_0 |
400.27 |
2.41 |
915.02 |
508.4 |
Figure 14. Trace log file of NS2 simulator
A part of the trace file generated with necessary parameters of VANET in SUMO simulator is shown in Table 3 and vehicle 4 log details are represented in Table 4. The output file NS2 simulator contains the OBUs (Vehicle nodes) and RSUs to communicate warning messages highlighted in Figure 14.
Any accident leads to vehicle damage, disturbance in surroundings, physical damage sometimes life death. This paper proposes a safety model to reduce accidents or collisions to minimize loss. The proposed solution identifies the distance among the vehicles and alerts any nearby vehicles. Our computing approach is based on the time taken to collide, and time is taken to avoid the collision using data from GPS Receiver. Distance between any two vehicles is calculated, and an intelligent decision is taken based on distance. Vehicle dynamics and environmental parameters can also be considered in future work to accurately estimate the collision possibilities so that active Safety can strengthen rather than passive Safety.
[1] SUMO online documentation on pedestrians 2015 http://sumo.dlr.de/wiki/Simulation/, accessed on 10 April, 2020.
[2] Dingil, A.E., Schweizer, J., Rupi, F., Stasiskiene, Z. (2018). Road network extraction with OSMNx and SUMOPy. EPiC Engineering, 2: 111-117. https://doi.org/10.29007/t7pk
[3] Erdmann, J., Krajzewicz, D. (2015). Modelling Pedestrian Dynamics in SUMO. Proceedings of SUMO 2015 Intermodal Simulation for Intermodal Transport.
[4] Lim, K.G., Tan, M.K., Chin, R.K.Y., Yeo, K.B., Teo, K.T.K. (2018). Traffic vehicular network modelling for VANET inter-vehicle data scavenging. 2018 IEEE International Conference on Artificial Intelligence in Engineering and Technology (IICAIET), Kota Kinabalu, Malaysia, pp. 1-6. https://doi.org/10.1109/IICAIET.2018.8638467
[5] Xu, Z.G., Li, X.C., Zhao, X.M., Zhang, M.H., Wang, Z.R. (2017). DSRC versus 4G-LTE for connected vehicle applications: A study on field experiments of vehicular communication performance. Journal of Advanced Transportation, 2017: 1-10. https://doi.org/10.1155/2017/2750452
[6] Wegner, A., Piórkowski, M., Raya M., Hellbrück, H., Fischer, S., Hubaux, J. (2008) TraCI: An interface for coupling road traffic and network simulators. Proc. 11th Comm. and Networking Simulation Symposium, (CNS 08), pp. 155-163. https://doi.org/10.1145/1400713.1400740
[7] Hu, M.J., Wu, J., Qin, H.M., Bian, Y.G., Xu, B., Xu, Q., He, J.G., Wang, J.Q. (2017). Coordinated collision avoidance for connected vehicles using relative kinetic energy density. International Journal of Automotive Technology, 18(5): 923-932. https://doi.org/10.1007/s12239-017-0090-9
[8] Kausar, T., Gupta, P., Arora, D., Kumar, R. (2012). A VANET based cooperative collision avoidance system for a 4-lane highway. Notes on Engineering Research and Development, IIT Kanpur Technical Journal, 4.
[9] Open Street Maps. https://www.openstreetmap.org/, accessed on 11 April, 2020.
[10] XML. https://www.w3schools.com/xml/xml_whatis.asp/, accessed on 11 April, 2020.
[11] NS2 Simulator. https://www.isi.edu/nsnam/ns/, accessed on 11 April, 2020.
[12] Jiménez, F., Naranjo, J.E., García, F. (2013). An improved method to calculate the time-to-collision of two vehicles. International Journal of Intelligent Transportation Systems Research, 11(1): 34-42. https://doi.org/10.1007/s13177-012-0054-4
[13] Sugimoto, Y., Sauer, C. (2005). Effectiveness estimation method for an advanced driver assistance system and its application to collision mitigation brake system. Proceedings of the 19th International Technical Conference on the Enhanced Safety of Vehicles. Washington DC. https://trid.trb.org/view/813013
[14] Zheng, L., Ismail, K., Meng, X.H. (2014). Traffic conflict techniques for road safety analysis: open questions and some insights. Canadian Journal of Civil Engineering, 41(7): 633–641. https://doi.org/10.1139/cjce-2013-0558
[15] Sayed, T., Zaki, M.H., Autey, J. (2013). Automated safety diagnosis of vehicle–bicycle interactions using computer vision analysis. Safety Science, 59: 163-172. https://doi.org/10.1016/j.ssci.2013.05.009