Hirosuke Horii
© 2020 IIETA. This article is published by IIETA and is licensed under the CC BY 4.0 license (http://creativecommons.org/licenses/by/4.0/).
OPEN ACCESS
The crowd behaviour recognition system is a subsystem of a distributed cooperative adaptive evacuation guide system, and it detects and forecasts crowd flow and anomaly occurrence by using machine learning method such as deep learning with visual and depth information obtained by RGB-D camera. The distributed cooperative adaptive evacuation guide system aims to suggest evacuation routes at extensive evacuation situations by autonomously cooperation among plural sensors and evacuation guiding devices. In this paper, a recognition method of overall behaviour of the crowd is proposed. Some indices for indicating the situation are examined in order to recognize the overall behaviour of the crowd flow and the anomaly occurrence, and cooperate among the system by sharing the recognition results rapidly.
machine learning, deep learning, image recognition, crowd behaviour recognition
When construction of a large structure such as a building or an underground area is planned, the evacuation route is pre-examined to respond to a disaster. However pre-examined evacuation route is not enough to respond to the disaster, because the situations on the evacuation route may dynamically change due to blockage by obstacles or congestion by concentration of evacuees. Therefore, we propose a distributed cooperative adaptive evacuation guide system which consists of monitoring sensors and intelligent evacuation guide signs distributed in a wide area. Each sensor monitors the situation on the evacuation route, and each intelligent evacuation guide sign guides the evacuation route dynamically in cooperation with other signs. The crowd behaviour recognition system presented in this paper is a subsystem of the distributed cooperative adaptive evacuation guide system. The crowd behaviour recognition system monitors the crowd flow of evacuees and detects anomaly occurrence by using machine learning. This paper proposes a recognition method of overall behaviour of the crowd in the wide area in order to cooperate among the systems with sharing the recognition results rapidly. Some indicators for indicating the situation are examined for recognizing the overall behaviour of the crowd flow and the anomaly occurrence.
In this study, the crowd behaviour recognition system monitors the overall behaviour of the evacuating crowd instead of monitoring each evacuee’s behaviour independently, because the objectives of the system are detection and estimation of the crowd flow status and the anomaly occurrence. The proposing system focuses on the crowd flow and the density. Conventional methods of the human behaviour recognition detect each person and analyze his or her behaviour independently, and the computational time cost is concerned for processing massively crowd in real-time rapidly, but the proposing system resolves the concern.
The crowd behaviour recognition system has two functions, the behaviour recognition and the anomaly detection. The behaviour recognition function monitors the crowd and their movement by image processing of the colour and the depth information obtained by RGB-D camera. The anomaly detection function detects anomaly situation by congestion situation, biased moving direction and moving velocity which are recognized by the behaviour recognition function. And furthermore the future congestion situation is forecasted by using a machine learning method.
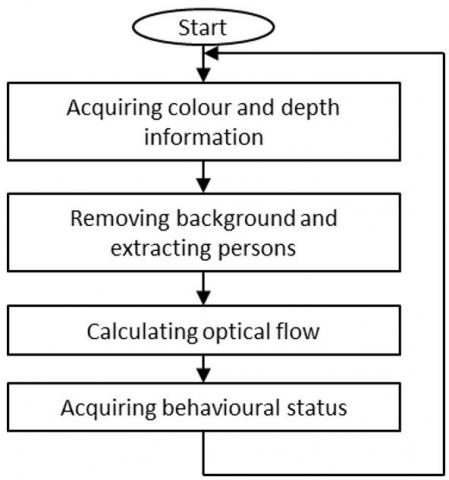
Figure 1 shows the procedure of the behaviour recognition. Image processing is applied to the colour and the depth information obtained by RGB-D camera, and then persons are extracted and their moving trails are estimated. In this research, the information obtained by the image processing results is called the behavioural status, and any piece of time series information of the behavioural status is called the time series behavioural status.
3.1 Image processing
The frame difference method is applied to the person detection from the image. Due to avoid the effect of luminance variation, the depth information is used for the frame difference method to remove the background.
3.2 Indicators of behavioural status
Four indicators, the congestion degree, the deadlock ratio, the histogram of movement direction and the histogram of movement intensity, defined below are obtained as the behavioural status.
A) Congestion degree
The congestion degree, CD represents a congestion situation in an image as a numeric value calculated as the following equation by using distance to subjects obtained by the depth information. Where n is number of subjects, si is area of, and di is distance to each subject.
$C D=\sum_{i=1}^{n} s_{i} \times d_{i}$ (1)
B) Deadlock ratio
When a subject is detected for a certain period at a certain pixel, the area is considered deadlocked. The deadlock ratio, DR represents the ratio of deadlocked area to the area of the frame (number of frame pixel) calculated as the following equation. Where n is number of subjects, si is area of deadlocked subject, and Sframe is area of the frame.
$D R=\sum_{i=1}^{n} s_{i} \times d_{i} / S_{f r a m e}$ (2)
C) Histogram of movement direction
The movement direction of the subjects obtained from the optical flow [1] is aggregated, and the histogram in the range of 0 to 360 degree is defined as the histogram of movement direction.
D) Histogram of movement intensity
The movement intensity of the subjects obtained from the optical flow is aggregated, normalized in the range of 0 to 255, and the histogram is defined as the histogram of movement intensity. Higher movement intensity means crowd of evacuee is in a hurry.
Figure 1. Behaviour recognition process
In this study, a situation of crowd that does not occur in normal, such as congestion by people concentration or flood of people to one direction, is defined as the anomaly situation. Normal behavioural status is able to learn by collecting many normal situations, but anomaly behavioural status is difficult to learn due to difficulty of collecting anomaly situation with low occurrence frequency or unexpected situation. Therefore, the outlier detection is performed on the latent space distribution of the time series behavioural status to determine normally / anomaly. Real-time anomaly detection and forecast of anomaly occurrence are performed.
4.1 Real-time anomaly detection
Anomaly detection is performed by combing the Long Short-Term Memory (LSTM) encoder with the Mahalanobis distance [2-4]. Figure 2 shows the procedure of the real-time anomaly detection. The latent variable is obtained by translating the time series behavioural status of past 15 frames to feature vectors using the LSTM encoder. The outlier detection using the Mahalanobis distance is applied to the dataset of the latent variable. If an outlier is detected, it is judged as an anomaly situation.
The LSTM encoder is used for translating the time series behavioural status to the latent variables. The LSTM is a neural net realizing long-term memory [5, 6] and the LSTM encoder obtains the feature values of input.
The Mahalanobis distance defined as the following equation is a multi-dimensional distance which takes account of correlation. Where μ is a mean vector and Σ is a variance-covariance matrix.
$D_{M(x)}=\sqrt{\left(x_{i}-\mu\right)^{\top} \sum\left(x_{i}-\mu\right)}$ (3)
New data x is judged to be an outlier when the following equation holds. Where θ is a certain threshold.
$\theta<D_{M(x)}$ (4)
The threshold for the outlier detection is calculated from the normal dataset which is generated in advance by the indicators of the normal behavioural status of a video in which anomaly detection is desired. Two thresholds, $\theta_{1}$ which includes 99% and $\theta_{2}$ which includes 95% of the dataset, are employed. When input data exceeds $\theta_{1}$, it is judged as anomaly. When input data does not exceed $\theta_{1}$ and exceeds $\theta_{2}$, the input data is added to the dataset for calculating the threshold, and then the thresholds are recalculated.
Figure 2. Anomaly detection algorithm
4.2 Forecast of behavioural status
In addition to real-time anomaly detection, by forecast the occurrence of anomalies in the situation after several frames, appropriate evacuation guide can be performed before congestion occurs. Therefore, indicators of behavioural status after several frames are forecasted by using the deep learning.
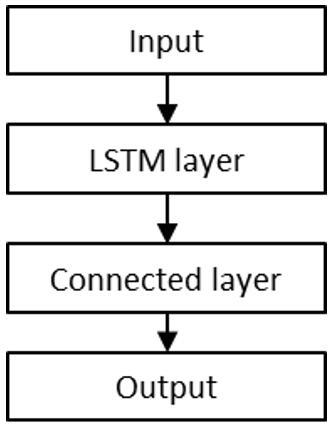
Here, in order to confirm the effectiveness of the forecast, the congestion degree that makes it easy to confirm the forecasted result by visualizing is forecasted. Generating a network that has learned changes of the congestion degree in advance and then inputting the acquired the time-series congestion degree into the learned network to obtain the forecasted value. Figure 3 shows the structure of the network.
Figure 3. Network structure
5.1 Forecast of congestion degree
In order to verify the forecast capability, learning of the network and forecast of the congestion degree were performed by using the deep learning. Video of training and testing dataset for learning the network was obtained by using RGB-D camera which was installed on 1,870mm high and 5,500mm distant from a wall. Person walked straight from the left or right of the shooting area. There were 17 peoples in and out, the number of people in the shooting area was random, and there were frames where no people were shown. The frame rate was 30 fps and the number of frames was 6,200. Each training data consists of 5 frames of the congestion degree and the congestion degree of after 10 frames. Thus the congestion degree of after 10 frames was forecasted from recent 5 frames.
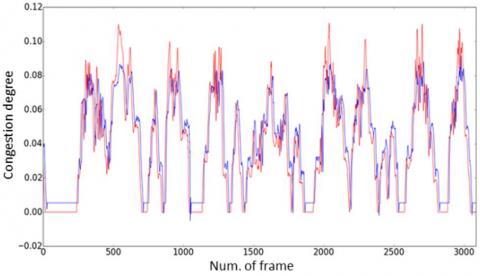
The congestion degree was forecasted by using the learned network and the results were visualized. Input video data for verification was obtained at the same conditions of learning data. Figure 4 shows the forecast and the measured value of congestion degree. The red line represents the measured value and the blue line represents the forecasted value. From the results, peak value was not forecasted but up and down fluctuation was well forecasted.
Figure 4. Forecast of congestion degree
(Red: Measured value, Blue: Forecasted value)
5.2 Behaviour recognition and anomaly detection for crowd flow
Anomaly detection algorithm is applied to the crowd flow and the behaviour of the crowd when anomaly is detected is verified.
Behaviour recognition and anomaly detection were performed on videos taken under the same conditions as in the previous section 5.1. The videos for verification consist of three patterns shown in Table 1. Behaviour of the crowd in the video #1 was the same in the previous section. Behaviour of the crowd in the video #2 was that all people walked straight to one direction, from left to right of the shooting area. There were 17 peoples in and out, the number of people in the shooting area was random, and there were frames where no people were shown. Behaviour of the crowd in the video #3 was that no people walked in and out, and a certain number of people stayed still in the shooting area.
The threshold of Mahalanobis distance used for anomaly detection was set using 3,100 frames with the same content as the video #1. Table 2 shows the number of anomaly detected in each video. The number of frames in which anomaly were detected throughout the entire movie was 7,281 out of 18,600 frames.
At the video #1, anomalies were detected in 3.5% of the frames. The movement intensity was the most frequent index detected as anomaly. At the video #2, anomalies were detected in 2.3% of the frames. The movement intensity was the most frequent index detected as anomaly. At the video #3, anomalies were detected in all frames. The congestion degree was the most frequent index detected as anomaly.
In this verification, the video #3 was a video that assumed an anomaly, but anomalies were also detected in the video #1 and #2. The reason was assumed that some outlier values were contained to the indices input to the LSTM encoder.
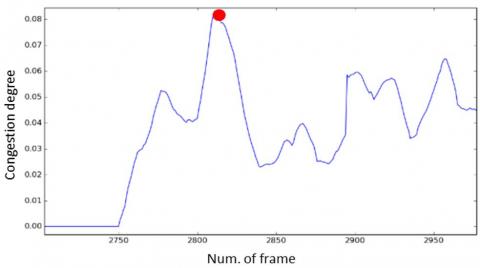
Figure 5 shows an excerpt of the area around the point where an anomaly was detected in the congestion degree. An anomaly was detected at the red point. Anomaly is judged by the input values of the past 15 frames. It can be confirmed from Figure 5 that the input values up to the point where the anomaly was detected contained outliers and sudden changes. It is considered that such outliers or sudden changes occur when a person in the shooting area is hidden. When there are a lot of people in the shooting area, a person who was hiding in the previous person in one frame appears in the next frame and then hides in the next frame, or the similar situation also occurs when people walking in opposite directions overlap.
Table 1. Contents of video for verification
|
# of video |
Num. of set |
Contents |
|
#1 |
2 |
People walking straight from left or right |
|
#2 |
3 |
All people walking straight to same direction |
|
#3 |
2 |
No people walking in and out, and a certain number of people staying still |
Table 2. Number of anomaly detected frames
|
# of video |
Num. of anomaly detected frames |
|
#1 |
530/6200 |
|
#2 |
583/6200 |
|
#3 |
6168/6200 |
|
Total |
6281/18600 |
Figure 5. An excerpt of the area around the point where an anomaly was detected in the congestion degree
It is also confirmed that sudden changes of the optical flow. Figure 6 shows a visualized result of an optical flow of the frame included in the input to the LSTM encoder where anomalies in the movement direction and the movement intensity were detected in the video #2. Figure 6 (a) is the optical flow one frame before (b), and (c) is the colour image of (b).
By comparing Figure 6 (a) and (b), it confirms that there is a clear difference in hue and brightness. The reason why this optical flow is confirmed is that the colour of the clothes or the hairs of the persons were similar. Since the optical flow is calculated with a grayscale image, if the object is a similar colour and its position is continuous, the destination estimation may be incomplete. For this reason, it is considered that there was a difference between frames in the detected movement direction and movement intensity even in the frames that shot a person moving at almost constant velocity.
A sudden change in the optical flow was also confirmed in the scene where only a part of a human body was reflected in the shooting area. In the lower left corner of Figure 6, you can see a person's arm swinging down. If the time series behavioural status includes a sudden change, it is judged as anomaly even in the normal state, so it is necessary to prevent the sudden change from being contained in the normal state. In the future, countermeasures for this problem must be considered.
Figure 6. Optical flow and colour image at a certain recognition failure
In this paper, two functions of the crowd behaviour recognition system, the behaviour recognition and the anomaly detection, were examined. At the examination of the behaviour recognition, four indicators for recognizing the behavioural status were proposed. Due to avoid the effect of luminance variation, the depth information obtained by RGB-D camera was used for the frame difference method to remove the background and extract persons. And then the movements of extracted persons were estimated by using the optical flow method. Based on the indicators of the time series behavioural status, forecast of the congestion degree by using the deep learning was tested and up and down fluctuation was well forecasted. At the examination of the anomaly detection, an anomaly detection algorithm by using the LSTM encoder with the Mahalanobis distance was tested and several challenges to improve the detection accuracy were clarified.
[1] Fleet, D.J., Weiss, Y. (2006). Optical flow estimation. Handbook of Mathematical Models in Computer Vision, 237-257. https://doi.org/10.1007/0-387-28831-7_15
[2] Hochreiter, S., Schmidhuber, J. (1997). Long Short-Term Memory. Neural Computation, 9(8): 1735-1780. https://doi.org/10.1162/neco.1997.9.8.1735
[3] Mahalanobis, P.C. (1936). On the generalised distance in statistics. Proceedings of the National Institute of Sciences of India, 2(1): 49-55.
[4] Smetek, T.E., Bauer, K.W. (2007). Finding hyperspectral anomalies using multivariate outlier detection. Proceedings of 2007 IEEE Aerospace Conference, Big Sky, MT, pp. 1-24. https://doi.org/10.1109/AERO.2007.353062
[5] Malhotra, P., Vig, L., Shroff, G., Agarwal, P. (2015). Long short term memory networks for anomaly detection in time series. Proceedings of 23rd European Symposium on Artificial Neural Networks, Computational Intelligence and Machine Learning, 89-94.
[6] Tran, K.P., Nguyen, H.D., Thomassey, S. (2019). Anomaly detection using long short term memory networks and its applications in supply chain management. IFAC-PapersOnLine, 52(13): 2408-2412. https://doi.org/10.1016/j.ifacol.2019.11.567