Ali Hashim Al-Ameedee*![]() | Nada Khaleefah M. A. Alrikabi
| Nada Khaleefah M. A. Alrikabi![]()
© 2026 The authors. This article is published by IIETA and is licensed under the CC BY 4.0 license (http://creativecommons.org/licenses/by/4.0/).
OPEN ACCESS
This study develops the Transport Fabric Framework as an applied planning approach for improving mobility resilience in constrained urban fabrics. Rather than proposing a new Space Syntax metric, the framework translates configurational diagnosis and disruption testing into movement-role reassignment and comparative evaluation. The Old City of Najaf was selected because its religious centrality, compact morphology, and limited expansion opportunities generate concentrated movement pressure around the historic core. Geographic Information System (GIS) and DepthmapX were used to model the vehicular access network, test closure of a high-choice link and disruption of a critical transition node, and compare a structural alternative with the Transport Fabric scenario. The assessment combined configurational indicators, Choice Concentration, Redundancy, and observed peak-hour traffic volumes. Field counts supported the diagnosis: high-choice links recorded 2020 veh/h, critical transition nodes 1480 veh/h, and alternative routes 1100 veh/h. The Transport Fabric scenario increased Mean Connectivity from 2.10 to 2.25, Integration from 0.67 to 0.69, Local Integration from 0.76 to 0.80, and Redundancy from 1–2 to 3–4, while reducing Choice Concentration from 2.5 to 1.6 without increasing Network Density. The findings demonstrate a measurable, field-supported procedure for reorganizing movement without physical network expansion.
historic urban fabric, mobility resilience, Network reorganization, Old Najaf, Space Syntax, Transport Fabric Framework
Many religious cities face complex mobility pressures because dense urban fabrics, limited expansion opportunities, and concentrated movement demands operate within the same constrained spatial setting. In such contexts, road widening or capacity-based interventions may improve local conditions, but they do not resolve the deeper problem of movement concentration within a limited number of network elements [1-6]. Recent Baghdad-based studies have also shown that urban mobility problems are strongly associated with parking demand and with the difficulty of implementing planning interventions in complex urban fabrics [7, 8].
The Old City of Najaf, represents a clear case of this challenge. Its compact historic structure, central religious function, and daily and pilgrimage-related flows create a movement system that is highly sensitive to disruption, especially around the vehicular access zones regulating movement toward the historic core [9-11].
Although Space Syntax and transport-resilience studies are useful for diagnosing network structure and disruption sensitivity, fewer studies clarify how such diagnosis can be translated into an operational planning intervention in constrained historic fabrics. In this study, the Transport Fabric Framework is introduced not as a new metric and not as a mere relabeling of Space Syntax, but as an applied planning framework that transforms configurational diagnosis and disruption testing into a structured process of movement-role reorganization and comparative evaluation in Old Najaf. Using Geographic Information System (GIS) and DepthmapX, the study compares baseline, disrupted, structural-alternative, and reorganization scenarios.
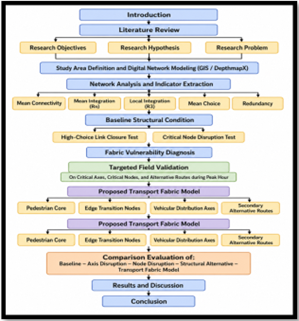
Figure 1 presents the overall research methodology adopted in the study.
Figure 1. Research methodology framework
2.1 Urban mobility systems as a spatial–functional system
In modern planning thought, urban mobility systems are more than just a system of roads or infrastructure that allows the movement of people and vehicles; they are spatial–functional systems whose performance is shaped by the relationship between network structure, the spatial distribution of activities, and the organizational capacity of the network to facilitate movement throughout the urban system [6]. As a result, it is no longer adequate to analyze the efficiency of a mobility system solely in terms of flow volume or movement speed. Mobility should not be regarded as a transport issue alone; rather, the analysis of movement should be understood as part of the structure of the city as a whole.
2.2 Resilience of urban mobility systems
Resilience has emerged as an important concept in the evaluation of urban mobility systems. Because it shifts the analytical focus from measuring performance under normal conditions to assessing the ability of the system to maintain functionality under disruption, collapse, or interruption [12]. As such, a resilient mobility system does not have to be the one with the highest capacity; rather, it must be able to absorb disturbances, redistribute movement, and reduce dependence on critical parts of the system while preserving reasonable accessibility even when interruption occurs. One recent study has reinforced this idea by arguing that transport network resilience is best assessed through a combination of evaluation methods based on connectivity, redundancy, and network response to disruption, rather than through independent performance measures alone [12]. This is important in historic cities, where the physical constraints of the existing urban fabric limit opportunities for physical expansion and require the reorganization of movement routes and options in order to maintain the network’s internal capacity to function effectively.
2.3 Spatial network reading of urban movement
Spatial network analysis gives a diagnostic reading of urban movement by examining how the configuration of links, nodes, and segments shapes accessibility and through-movement within the network [13, 14]. In this regard, Space Syntax is used in this study as a configurational diagnostic and interpretive tool rather than as the planning intervention itself. Its indicators, including connectivity, global integration, local integration, and choice, help identify where movement potential is concentrated, how strongly particular elements structure access, and where dependence on governing routes becomes pronounced [15-19].
Many recent studies have also shown that configurational analysis can support scenario-based assessment of disruption and accessibility pressures in historic urban areas [20-24]. However, while this type of analysis is effective in diagnosing configurational conditions, it does not by itself determine how movement roles should be reorganized once vulnerability has been identified. This distinction is important for the present study, because the proposed framework uses configurational diagnosis as an input for defining planning actions, rather than treating diagnosis as the final output of the study.
2.4 From urban transport to the Transport Fabric Framework
Most urban transport research addresses mobility through operational efficiency, congestion, or capacity, but they do not always provide a clear planning procedure for reorganizing movement once movement dependence has been identified [11]. This limitation becomes more evident in historic cities, where spatial constraints restrict expansion and where movement functions must be managed within a sensitive and already formed urban fabric.
In this study, the Transport Fabric Framework is introduced as an applied planning framework for constrained historic fabrics. It is not proposed as a new Space Syntax metric, nor as a relabeling of existing configurational analysis. Rather, it uses configurational diagnosis and disruption testing as the analytical basis for planning action. Operationally, the framework links four sequential steps: diagnosing movement-dependence patterns, testing disruption response, reassigning movement roles across available routes, and evaluating the reorganized condition against disrupted and structural-alternative scenarios. Within the scope of this study, this procedure is applied to the vehicular access system regulating movement toward the sensitive historic core of Old Najaf.
2.5 Theoretical value of Transport Fabric
The theoretical value of the Transport Fabric Framework lies in its role as a procedural link between diagnosis and intervention. Space Syntax identifies where integration, choice, and dependence are concentrated, while resilience-oriented assessment examines how the system responds when critical elements are disrupted.
Table 1. Conceptual and procedural distinction between existing approaches and the Transport Fabric Framework
|
Comparison Aspect |
Traditional Space Syntax Studies |
General Transport-Resilience Models |
Simple Combination of Space Syntax and Resilience Analysis |
Transport Fabric Framework in This Study |
|
Main purpose |
Diagnose spatial configuration and movement potential through indicators such as integration, choice, and connectivity |
Assess network response to disruption, performance loss, recovery capacity, or redundancy |
Combine configurational diagnosis with disruption assessment |
Translate diagnosis and disruption response into a planning procedure for movement-role reassignment |
|
Main analytical question |
Where are accessibility and through-movement potentials concentrated? |
How does the network perform when disruption occurs? |
Which configurationally important elements are vulnerable under disruption? |
Which movement elements should have their roles reduced, supported, or redirected to improve resilience? |
|
Type of output |
Configurational indicators and spatial maps |
Resilience measures, performance-loss patterns, redundancy, or recovery indicators |
Combined diagnosis of centrality and disruption sensitivity |
A structured planning sequence: diagnosis → disruption testing → route-role reassignment → comparative evaluation |
|
Intervention logic |
Mainly diagnostic; it identifies spatial relations but does not define how movement should be reorganized |
Mainly evaluative; it measures response but does not necessarily define spatial planning roles |
Identifies weakness but may remain at the level of analysis |
Defines how movement roles are redistributed among access zones, transition nodes, vehicular corridors, and alternative routes |
|
Treatment of alternatives |
Alternative routes may appear indirectly through network configuration |
Redundancy may be measured as an indicator of resilience |
Alternatives may be identified but not assigned a clear planning role |
Alternative routes are explicitly activated as part of the reorganization scenario |
|
Relevance to constrained historic fabrics |
Useful for reading configuration, but not sufficient alone for intervention in sensitive historic cores |
Often general and not specific to the spatial hierarchy of historic religious cities |
Useful diagnostically, but may remain a method-combination rather than a planning framework |
Designed for contexts where expansion is limited and movement must be reorganized within the available route structure |
Unlike general resilience models, which mainly evaluate performance loss, recovery capacity, or redundancy after disruption, the Transport Fabric Framework uses disruption results to define a planning response: which movement elements should have their roles reduced, which alternative routes should be activated, and how the reorganized condition should be compared with both disrupted and physical-intervention scenarios.
The Transport Fabric Framework does not replace either Space Syntax or resilience assessment. Rather, it connects them within a planning sequence that guides how movement roles can be redistributed across sensitive access zones, transition nodes, vehicular distribution corridors, and alternative routes. In this sense, the novelty of the framework lies not in producing new indicators, but in converting configurational and disruption-based diagnosis into a structured planning logic for movement-role reassignment and comparative evaluation in constrained historic fabrics. This procedural conversion from diagnosis to intervention is the principal distinction between the proposed framework and a simple combination of existing methods.
Table 1 summarizes the conceptual and procedural distinction between existing approaches and the Transport Fabric Framework.
2.6 Interpretive framework for improvement in network indicators
The indicators in this study are not treated as universal threshold values. Because urban networks differ in size, morphology, spatial hierarchy, and functional context. Therefore, the evaluation is based on comparative change across the baseline, disrupted, structural-alternative, and Transport Fabric conditions rather than on fixed normative standards.
In this interpretive framework, increases in indicators like Mean Connectivity, Mean Integration (Rn), and Local Integration (R3) are considered positive when they indicate stronger segment connection, improved global accessibility, and better local cohesion. Mean Choice is treated differently: an increase is not automatically interpreted as an improvement unless it is accompanied by lower Choice Concentration and higher Redundancy because higher Choice may also indicate stronger dependence on a limited number of governing movement elements.
Table 2. Interpretive framework for the direction of improvement in the adopted network indicators
|
Indicator |
Direction of Improvement in This Study |
Basis for Evaluation |
Planning Meaning |
|
Mean Connectivity |
Increase ↑ |
When it rises after intervention compared with the disrupted condition |
Stronger direct connection among network segments |
|
Mean Integration (Rn) |
Increase ↑ |
When global accessibility is restored or improved after intervention |
Better overall accessibility within the movement system |
|
Local Integration (R3) |
Increase ↑ |
When local accessibility improves after intervention |
Stronger local cohesion within the fabric |
|
Mean Choice |
Conditional |
Interpreted together with Choice Concentration and Redundancy |
Improvement depends on whether through-movement becomes less dependent on governing elements |
|
Choice Concentration |
Decrease ↓ |
When it declines after intervention compared with the disrupted condition |
More balanced distribution of through-movement |
|
Redundancy |
Increase ↑ |
When the number of viable alternative routes increases |
Stronger rerouting capacity under disruption |
In this case, the indicators are understood as a connected set rather than as isolated measures. A decrease in Choice Concentration indicates a more balanced distribution of through-movement, while an increase in Redundancy indicates stronger rerouting capacity under disruption. This combined reading supports the procedural logic of the Transport Fabric Framework by linking diagnosis, disruption response, movement-role reassignment, and comparative evaluation. In this way, the indicators do not only describe network conditions, but also provide the basis for assessing whether the proposed reorganization produces a measurable improvement over the disrupted and structural-alternative scenarios.
Table 2 presents the interpretive framework used to define the direction of improvement in the adopted network indicators.
3.1 Study area
The suitable case for applying the Transport Fabric Framework is Old City of Najaf. Its compact form the large volume of movement generated by its role as a pilgrimage destination and its spatial and regulatory constraints together make it a highly challenging environment in which conventional forms of expansion are often ineffective [25]
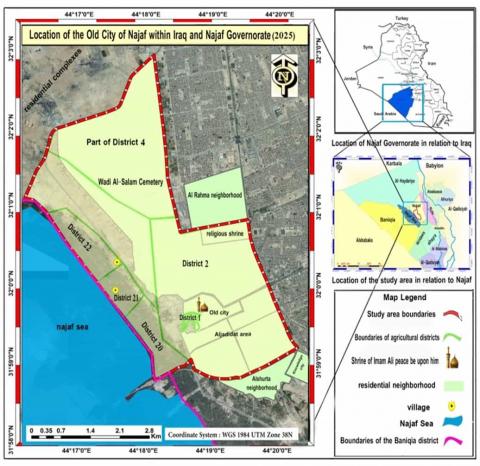
Figure 2. Location of the Old City of Najaf within Iraq and Najaf Governorate (2025)
The historic centre of the Old Najaf encompasses the area adjacent to the Holy Shrine; however, movement to this area is not limited to the core itself. Since many people also travel from the transitional and outer areas on their way to the Holy Shrine, these areas are also included in the analysis. Therefore, the study area is defined on the basis of the actual movement field rather than only the classic morphological boundary of the Old City [26]. Figure 2 shows the location of the Old City of Najaf within Iraq and Najaf Governorate.
3.2 Methodological design
This methodological process was constructed as a sequential workflow aimed at investigating the possibility of improving mobility resilience in Old City of Najaf by reorganizing movement roles instead of expanding physical space. The research design utilizes the applied logic of the Transport Fabric Approach. In particular, network diagnosis occurs first, then testing of disruptions, and comparison of the proposed reorganization to alternatives.
The first step involved setting the boundary of the study area and building up the road network database using GIS. Topological corrections were made to the road network by eliminating discontinuities, testing for connectivity of segments, also validating the node-link relationships.
In stage two, a configurational network analysis was conducted through the use of the DepthmapX program. The axial and angular segment models were created for the calculation of Mean Connectivity, Mean Integration (Rn) and Local Integration (R3), and Mean Choice indicators. These indicators helped to establish the base status of the movement system, also identified elements with higher configurational importance.
The disruption of network operation was evaluated in the third phase using two scenarios, which included the blocking of a high-choice link and the failure of a key transition point. This phase of the simulation was chosen since the sample scenarios depict the major types of movement dependency in the study area and provide insight into the effect of removing controlling factors on access and connectivity.
In the fourth phase, the capacity of the movement system was examined using GIS Network Analyst to analyze alternative routes from selected movement nodes and to examine redundancy. This stage helped us understand whether or not there were enough alternative routes within the system to compensate for any disruptions.
The fifth stage constructed two scenarios for comparison. The first one was a structural alternative represented by adding a physical connection at the critical-node location. The other was the Transport Fabric scenario which was based on movement-role reassignment by reducing dependence on highly loaded elements and activating available alternative routes.
In the last phase, the four conditions were compared against each other based on the same set of indicators. The comparison allowed to determine if the restructuring achieved significant benefits in terms of increased connectivity, integration, movement concentration, and rerouting. Targeted field traffic volumes were taken later for verification purposes based on the operational indicator of observed movement pressure. Figure 3 illustrates the methodological workflow followed in applying the Transport Fabric Framework.
Figure 3. Methodological workflow of the Transport Fabric Framework application
3.3 Data and analytical tools
The analysis was based on the 2025 spatial road-network records of the study area gated from Najaf Planning Directorate and the Municipality of Najaf. The data were entered into GIS and topologically corrected by removing discontinuities and duplicate segments and by verifying node–segment connections. This step was necessary to ensure that the network model was suitable for configurational analysis and scenario testing.
The corrected network was further imported into DepthmapX program to create axial/angular segment models. Four different configurational measures were obtained using this program, namely: Average Connectivity, Average Integration (Rn), Local Integration (R3), and Average Choice. Average Connectivity calculates the average number of direct connections between segments; Average Integration (Rn) is a measure of global integration; Local Integration (R3) is a measure of local coherence, while Average Choice is a measure of movement through the system.
Two further measures were utilized to back up the comparative evaluation. Choice Concentration was calculated as a derived indicator, to measure the degree to which through-movement is concentrated in a limited group of segments. Redundancy was calculated using GIS Network Analyst by identifying viable alternative routes between selected movement points under each analysis scenario. Together, these indicators allowed the study to evaluate connectivity, accessibility, movement concentration, and rerouting capacity. The Measure of Connectivity is defined as
$\mathrm{MC}=\frac{\sum_{\mathrm{i}=1}^{\mathrm{N}} \mathrm{Ci}}{\mathrm{n}}$ (1)
where, Ci: the number of direct connections of segment i, n: the total number of segments in the network.
Choice Concentration was defined as a derived indicator expressing the degree to which through-movement is concentrated within a limited number of elements. It was calculated as:
$\mathrm{CC}=\frac{\text { Top10 Choice }}{\text { ME.AN } \text { CHOICE }}$ (2)
where, Top10: Choice denotes the mean Choice value of the top 10% of segments, and Mean Choice: denotes the overall network mean. Higher values indicate stronger concentration of through-movement in a limited number of links or nodes, whereas lower values indicate a more balanced movement distribution.
Alternative routes provided when a governing element fails is measured by redundancy. For the purpose of calculating redundancy, the number of possible alternative paths between chosen pairs of critical nodes and access nodes is determined through GIS Network Analyst. Redundancy was calculated on the basis of the number of possible alternative routes for the movement between selected critical movement points. An alternative route could be defined as viable only if it did not go through the disrupted element and stayed functional according to the rules of movement. The result was presented in numerical terms based on the number of alternatives, i.e., 1–2 and 3–4 alternative routes. Table 3 summarizes the analytical tools, procedures, and outputs adopted in the study.
Table 3. Analytical tools, procedures, and outputs adopted in the study
|
Analytical Tool / Procedure |
Methodological Role |
Main Outputs |
|
GIS |
Preparing the spatial road-network database, correcting topology, removing discontinuities and duplicate segments, and verifying node–segment connections |
Corrected network database; node–segment structure; Network Density |
|
DepthmapX |
Producing axial and angular segment models for configurational analysis |
Mean Connectivity; Mean Integration (Rn); Local Integration (R3); Mean Choice |
|
GIS Network Analyst |
Identifying viable alternative routes between selected movement points |
Redundancy; alternative route availability |
|
Disruption testing |
Testing the closure of a high-choice link and the failure of a critical transition node |
Network response under disruption; changes in accessibility, connectivity, and rerouting capacity |
|
Derived indicator analysis |
Calculating movement concentration from Choice values |
Choice Concentration |
|
Scenario modelling |
Constructing the structural alternative and the Transport Fabric scenario |
Structural-alternative condition; Transport Fabric condition |
|
Targeted field traffic counts |
Supporting the configurational diagnosis with an operational traffic indicator |
Observed traffic volume (veh/h) at critical links, critical nodes, and alternative routes |
|
Comparative evaluation |
Comparing baseline, disrupted, structural-alternative, and Transport Fabric conditions using the same indicators |
Direction and magnitude of improvement across scenarios |
3.4 Analytical boundaries and unit of analysis
This analysis mainly concentrated on the vehicle movement system that controls the flow of traffic towards the historical center of Old Najaf. The inner zone in which the Holy Shrine is located was considered a sensitive pedestrian center since access to vehicles here is prohibited. The reason for this was that the logic of movement in this zone was not similar to that in the adjacent road networks. Therefore, the quantitative analysis involved only the transition and outer zones of the vehicle layers.
The unit of analysis was taken as road network segment in relation to access nodes also transition nodes, and alternative paths. It is chosen due to the nature of indicators adopted for the study, namely: Mean Connectivity, Mean Integration (Rn), Local Integration (R3), Mean Choice, Choice Concentration, and Redundancy. This study does not seek ways to penetrate into the religious core through more vehicles, but rather to assess how traffic flows within the core can be redirected.
3.5 Analytical procedure and validation indicators
The selection of the scenario was determined by the analysis performed on the baseline configurational model. The selection of the high-choice link was done because the link constituted one of the most significant through-links in the vehicular access system. The selection of the critical transition node was done because it connected several governing links and would impact continuity, accessibility, and rerouting in the case of disruption. It should be noted that neither of the selected scenarios was chosen arbitrarily but due to its configurational and functional significance.
Two scenarios were designed after performing two disruption tests. The structural alternative solution was the first scenario in which a physical link was added to the critical node position, after which the topology of the network was reprocessed. On the other hand, the Transport Fabric solution was designed in terms of moving role reassignment, in which there was no dependence on heavily utilized links.
All of scenarios were analyzed using identical procedures for GIS and DepthmapX program along with identical indicators: Mean Connectivity, Mean Integration (Rn), Local Integration (R3), Mean Choice, Choice Concentration, and Redundancy. The comparative analysis included the original situation, disrupted link, disrupted node, structural alternative, and Transport Fabric scenario. This made sure that the difference noticed was due to the scenarios being compared and not due to any difference in modeling techniques or indicators used.
The outcomes are presented in accordance with the scenario progression defined in the methodology section. Firstly, the baseline network state and reaction to link and node disruptions are discussed. Secondly, the analysis of the joint indicators provides insight into the primary mobility dependency pattern. Thirdly, the targeted field traffic volumes are used as an operational indicator to determine whether the analytical critical nodes are indeed carrying more field traffic volumes. Finally, the assessment of the Transport Fabric scenario performance takes place, followed by comparing the performance of the two scenarios through the same indicators.
4.1 Baseline network condition and disruption response
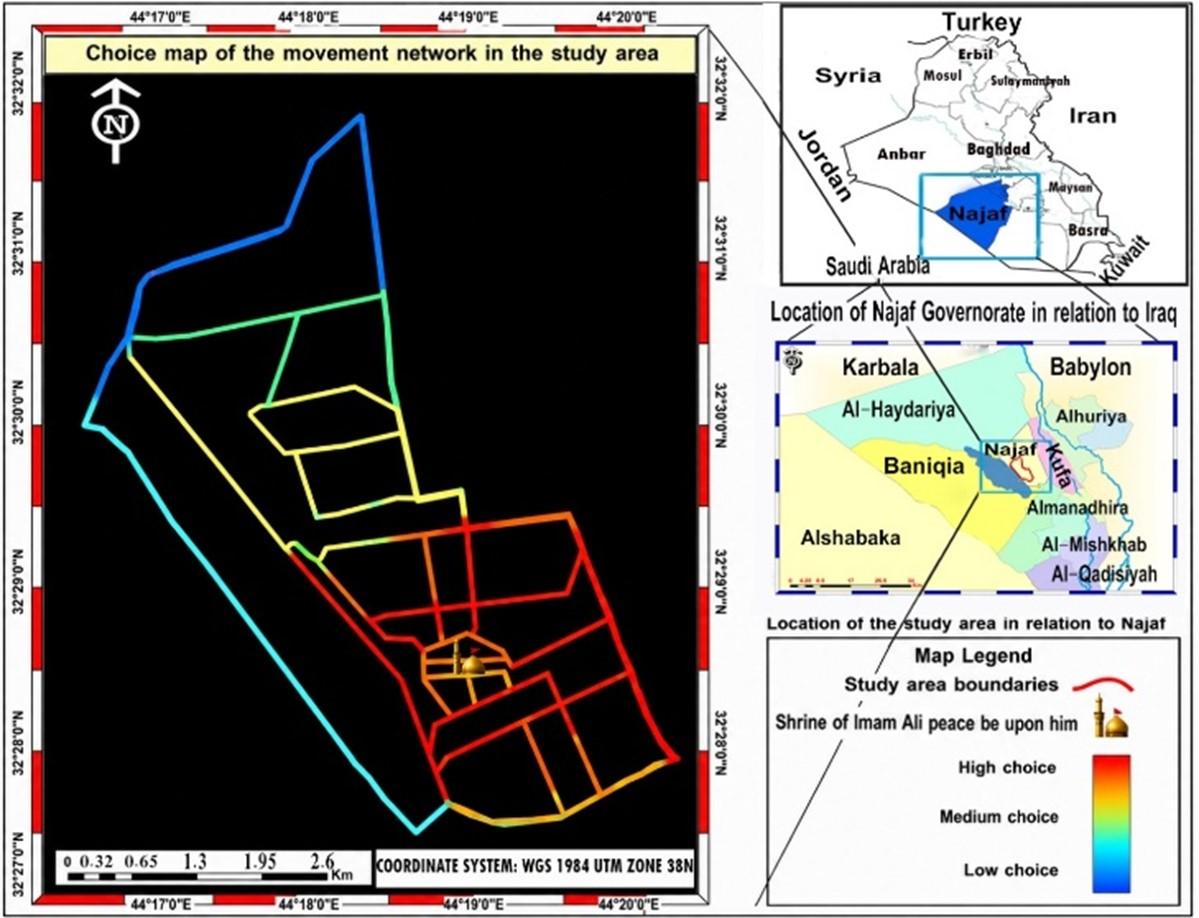
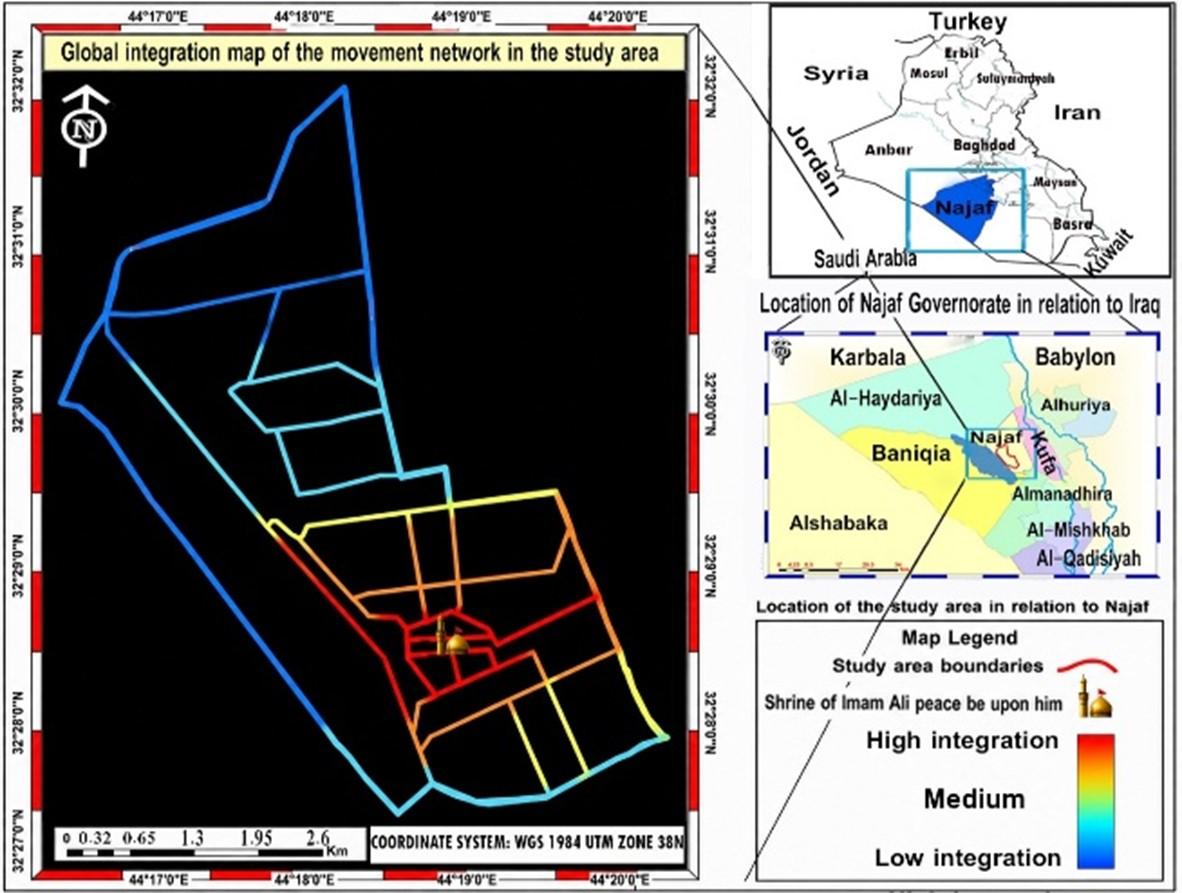
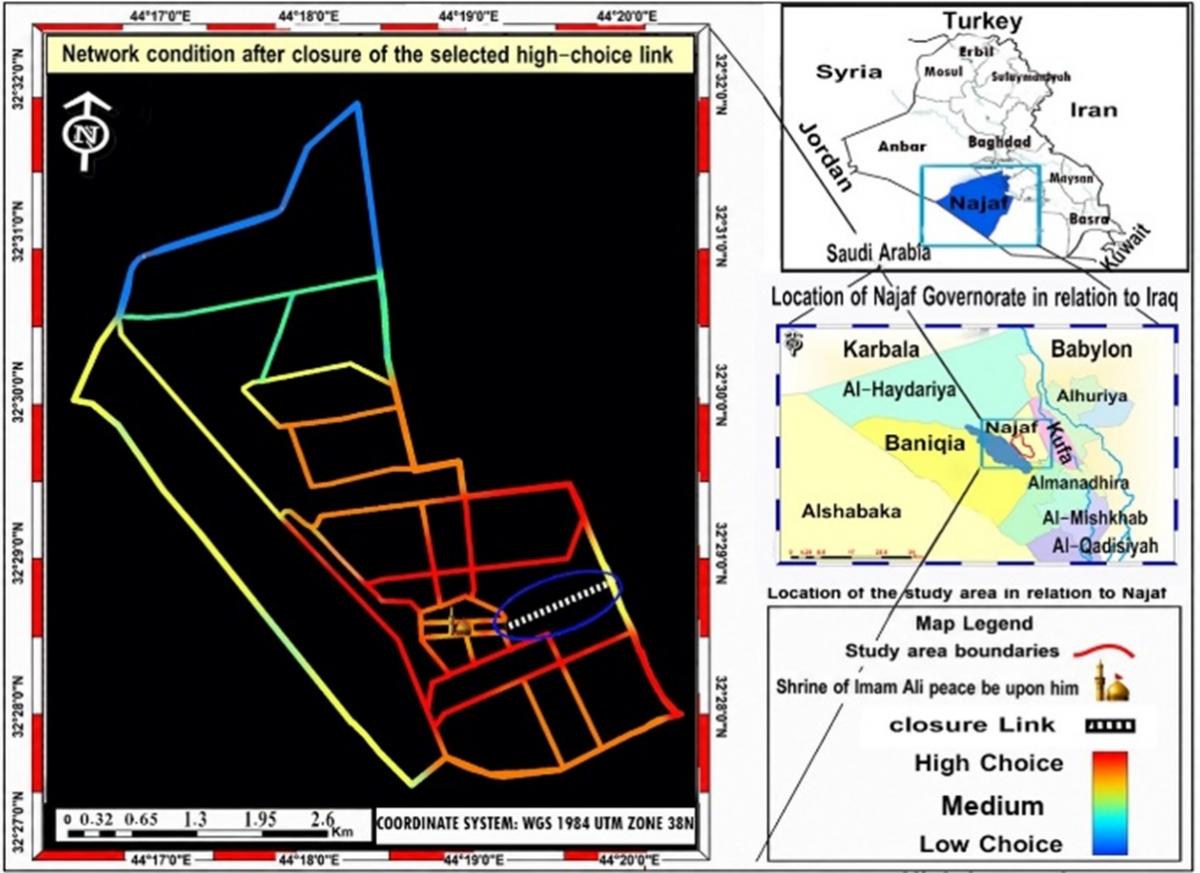
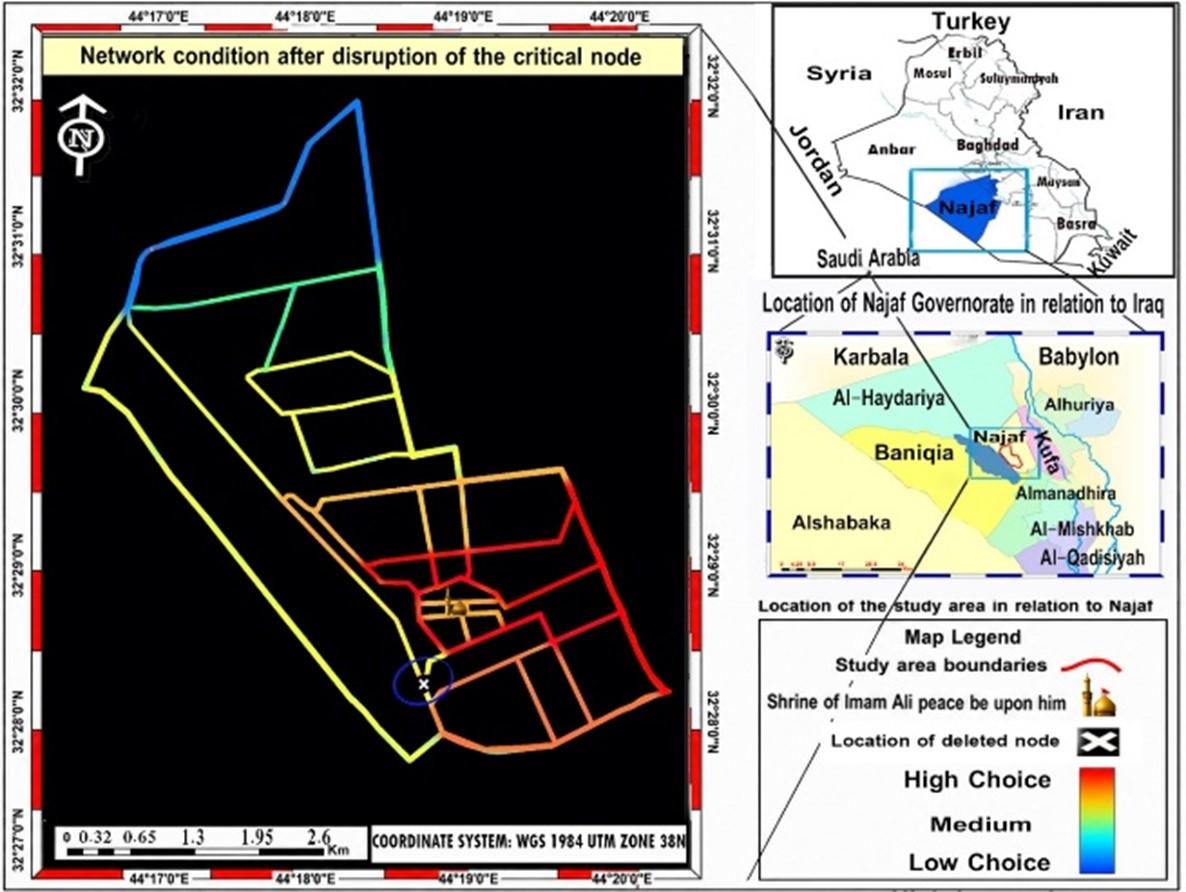
Figures 4 and 5 present the baseline spatial distribution of Choice and Global Integration in the study-area network, while Figures 6 and 7 show the network condition after the closure of the selected high-choice link and the disruption of the critical transition node. The corresponding quantitative results are summarized in Table 4.
Under the baseline condition, the network recorded Mean Connectivity = 2.34, Mean Integration (Rn) = 0.70, Local Integration (R3) = 0.82, Mean Choice = 0.347, Network Density = 2.40, Choice Concentration = 2.5, and Redundancy = 1–2. These values indicate that the network has measurable connectivity and integration, but through-movement is concentrated in a limited number of routes, while alternative route availability remains low.
Figure 4. Choice map of the movement network in the study area
Figure 5. Global integration map of the movement network in the study area
Figure 6. Network condition after closure of the selected high-choice link
Figure 7. Network condition after disruption of the critical node
After the closure of the selected high-choice link, Mean Connectivity decreased from 2.34 to 2.10, Mean Integration (Rn) from 0.70 to 0.67, and Local Integration (R3) from 0.82 to 0.76. Network Density remained unchanged at 2.40, Redundancy remained at 1–2, and Choice Concentration remained at 2.5. This indicates that link closure reduced connectivity and accessibility, but did not improve movement distribution or increase route alternatives.
After the disruption of the critical transition node, Mean Connectivity decreased to 1.98, Mean Integration (Rn) to 0.65, and Local Integration (R3) to 0.73. Choice Concentration increased from 2.5 to 2.6, while Redundancy remained at 1–2. Compared with the link-closure scenario, node disruption produced a stronger decline in network performance and a higher concentration of through-movement.
Table 4. Baseline network condition and disruption-response indicators
|
Indicator |
Baseline Condition |
After Link Disruption |
After Node Disruption |
Result Reading |
|
Mean Connectivity |
2.34 |
2.10 |
1.98 |
Connectivity decreased after both disruptions, with a stronger decline after node disruption |
|
Mean Integration (Rn) |
0.70 |
0.67 |
0.65 |
Global accessibility decreased under both disruption scenarios |
|
Local Integration (R3) |
0.82 |
0.76 |
0.73 |
Local cohesion declined after link and node disruption |
|
Network Density |
2.40 |
2.40 |
2.40 |
Total network extent remained unchanged |
|
Mean Choice |
0.347 |
0.349 |
0.346 |
Mean through-movement potential changed only slightly |
|
Choice Concentration |
2.5 |
2.5 |
2.6 |
Movement concentration persisted and increased slightly after node disruption |
|
Redundancy |
1–2 |
1–2 |
1–2 |
Alternative route availability remained limited |
4.2 Indicator-based diagnosis of movement dependence
The results in Table 4 refer that the main issue is not related to the physical extent of the network, since Network Density remained unchanged at 2.40 across the baseline and disruption scenarios. The clearer change appears in the decline of Mean Connectivity, Mean Integration (Rn), and Local Integration (R3), together with persistent low Redundancy and high Choice Concentration.
Under the baseline condition, Choice Concentration recorded 2.5, while Redundancy remained limited to 1–2. After node disruption, Choice Concentration increased to 2.6, and Redundancy remained unchanged. This indicates that disruption did not lead to a more distributed movement pattern; instead, it increased dependence on the remaining routes.
Table 5. Result-based diagnosis of movement dependence
|
Diagnostic Aspect |
Indicator Evidence |
Result-Based Reading |
|
Through-movement concentration |
Choice Concentration = 2.5 in the baseline condition and 2.6 after node disruption |
Through-movement remains concentrated in a limited set of routes |
|
Limited rerouting capacity |
Redundancy remained at 1–2 across the baseline and disruption scenarios |
The network has few viable alternatives when a governing element is disrupted |
|
Connectivity sensitivity |
Mean Connectivity decreased from 2.34 to 2.10 after link disruption and to 1.98 after node disruption |
Network continuity is more affected by node disruption than by link closure |
|
Global accessibility reduction |
Mean Integration (Rn) decreased from 0.70 to 0.67 after link disruption and to 0.65 after node disruption |
Global accessibility weakens under both disruption scenarios |
|
Local cohesion reduction |
Local Integration (R3) decreased from 0.82 to 0.76 after link disruption and to 0.73 after node disruption |
Local movement relations become weaker after disruption |
The node-disruption scenario had a greater impact than the link-closure scenario. Mean Connectivity decreased to 1.98 after node disruption compared with 2.10 after link disruption, while Mean Integration (Rn) decreased to 0.65 compared with 0.67. These findings indicate that the critical transition node has a stronger role in maintaining continuity and accessibility than the selected high-choice link. Table 5 presents the result-based diagnosis of movement dependence derived from the baseline and disruption analysis.
4.3 Field traffic-count validation and operational comparison
Field traffic counts were used to support the configurational diagnosis with an observed operational traffic indicator. Since the main issue in the study is movement concentration on a limited number of links and transition nodes, peak-hour traffic volume was used as the main operational measure. Similar Baghdad-based traffic studies have used observed movement density and travel-time reliability measures to support operational evaluation of urban corridors and central urban areas [27, 28].
Six observation points were selected directly from the analytical results: two high-choice links, two critical transition nodes, and two alternative routes. The high-choice links were selected because they represented the strongest through-movement concentration.
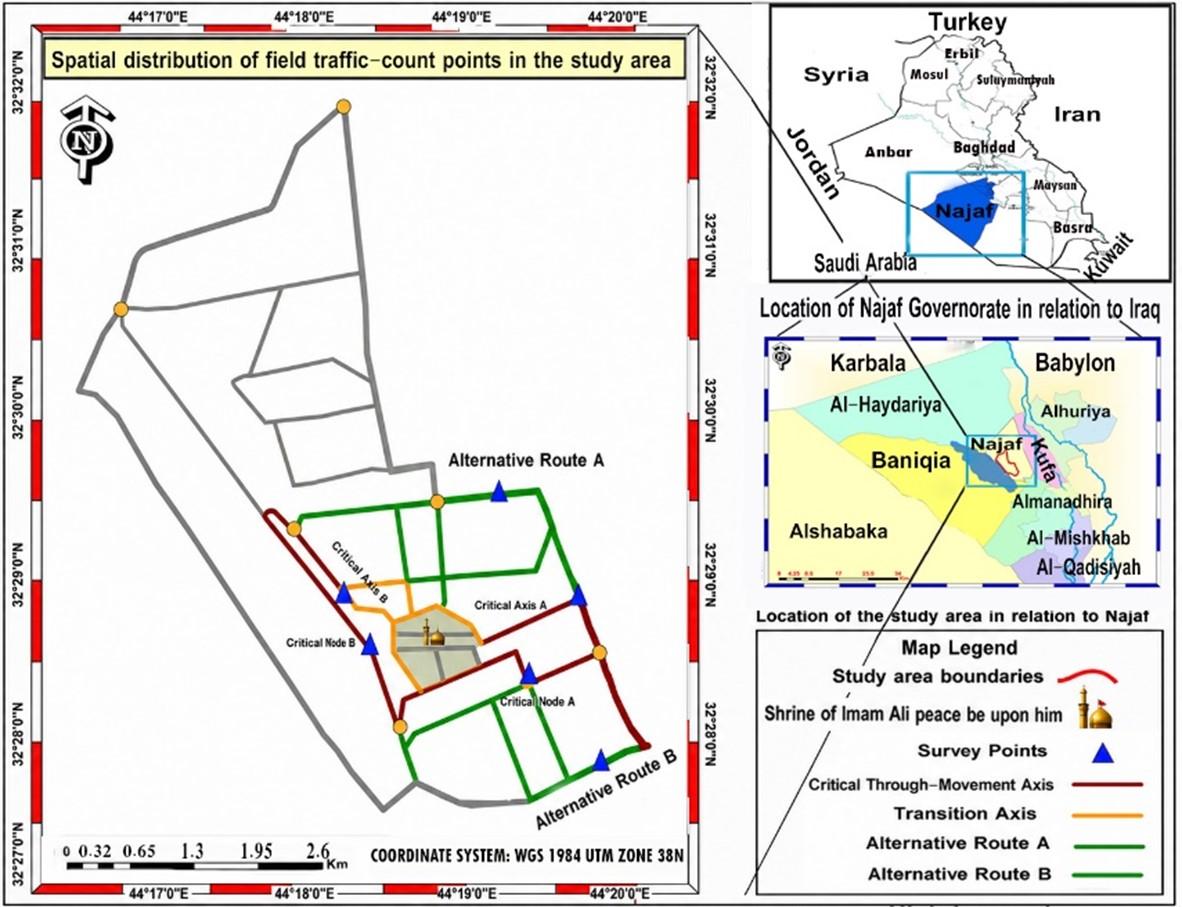
The critical transition nodes were selected because they connected several governing routes and influenced movement redistribution. For these nodes, traffic counts were recorded on the main approach segments representing the operational pressure on each node. The alternative routes were selected because they represented less concentrated paths with potential rerouting function. The survey was conducted during the Thursday evening peak hour from 7:00 to 8:00 PM, and all observations were recorded in vehicles per hour (veh/h). Figure 8 shows the spatial distribution of the field traffic-count points. Table 6 presents the field traffic-count validation of the analytically selected movement elements.
The point-based observations explain a clear operational gradient. The high-choice links recorded the highest volumes, with 2190 and 1850 veh/h. The critical transition nodes recorded intermediate but still high values, with (1550) and (1410) veh/h. The alternative routes recorded the lowest values, with (1140) and (1060) veh/h. This pattern is consistent with the configurational diagnosis, because the elements identified as analytically dominant also carried the highest observed movement pressure.
Figure 8. Spatial distribution of field traffic-count points in the study area
Table 6. Field traffic-count validation of analytically selected movement elements
|
Observation Point |
Model-Based Classification |
Selection Criterion |
Observed Volume (veh/h) |
Operational Reading |
|
Critical Link A |
High-choice link / high concentration |
Selected from the links with the strongest through-movement role |
2190 |
Highest observed traffic load among the surveyed points |
|
Critical Link B |
High-choice link / high concentration |
Selected to verify whether high-choice concentration is reflected in observed movement pressure |
1850 |
High traffic load on a concentrated route |
|
Critical Node A |
Critical transition node |
Selected because it connects several governing routes within the vehicular access system |
1550 |
High transitional pressure on the main approach segment |
|
Critical Node B |
Critical transition node |
Selected to test the operational role of nodal redistribution |
1410 |
Continued importance in receiving and redistributing movement |
|
Alternative Route A |
Alternative route |
Selected as a less concentrated route with potential rerouting function |
1140 |
Lower observed load compared with critical elements |
|
Alternative Route B |
Alternative route |
Selected to test whether an alternative route can support part of rerouted movement |
1060 |
Lower observed pressure and rerouting potential |
Table 7. Group-based operational comparison of observed traffic volumes
|
Operational Group |
Included Points |
Average Observed Volume (veh/h) |
Comparison with Alternative Routes |
Operational Meaning |
|
High-choice links |
Critical Link A; Critical Link B |
2020 |
83.6% higher |
Confirms that the analytically dominant links also carry the highest operational load |
|
Critical transition nodes |
Critical Node A; Critical Node B |
1480 |
34.5% higher |
Confirms the operational sensitivity of transition nodes in movement redistribution |
|
Alternative routes |
Alternative Route A; Alternative Route B |
1100 |
Reference group |
Indicates lower current load and potential support for rerouted movement |
To make the validation more explicit, the six observations were grouped into three operational categories: high-choice links, critical transition nodes, and alternative routes. This group-based comparison is presented in Table 7.
The group-based comparison provides direct operational evidence for the model results. High-choice links carried 83.6% more observed traffic than alternative routes, while critical transition nodes carried 34.5% more observed traffic than alternative routes. Therefore, the proposed Transport Fabric scenario is not based only on configurational indicators; it is also supported by observed field traffic volumes. The elements selected for reducing dependence are the same elements carrying the highest real traffic pressure, while the alternative routes show lower current loads and greater potential to support movement redistribution.
Accordingly, the field validation addresses two issues: it strengthens the methodological rigor of the field survey by explaining how and why the observation points were selected, and it provides a real operational comparison between model-based classifications and observed traffic volume. This validation does not claim to replace a full traffic simulation or Level of Service (LOS)-based assessment; rather, it provides a targeted operational check that is directly aligned with the study’s focus on movement concentration and redistribution.
4.4 Transport fabric scenario evaluation
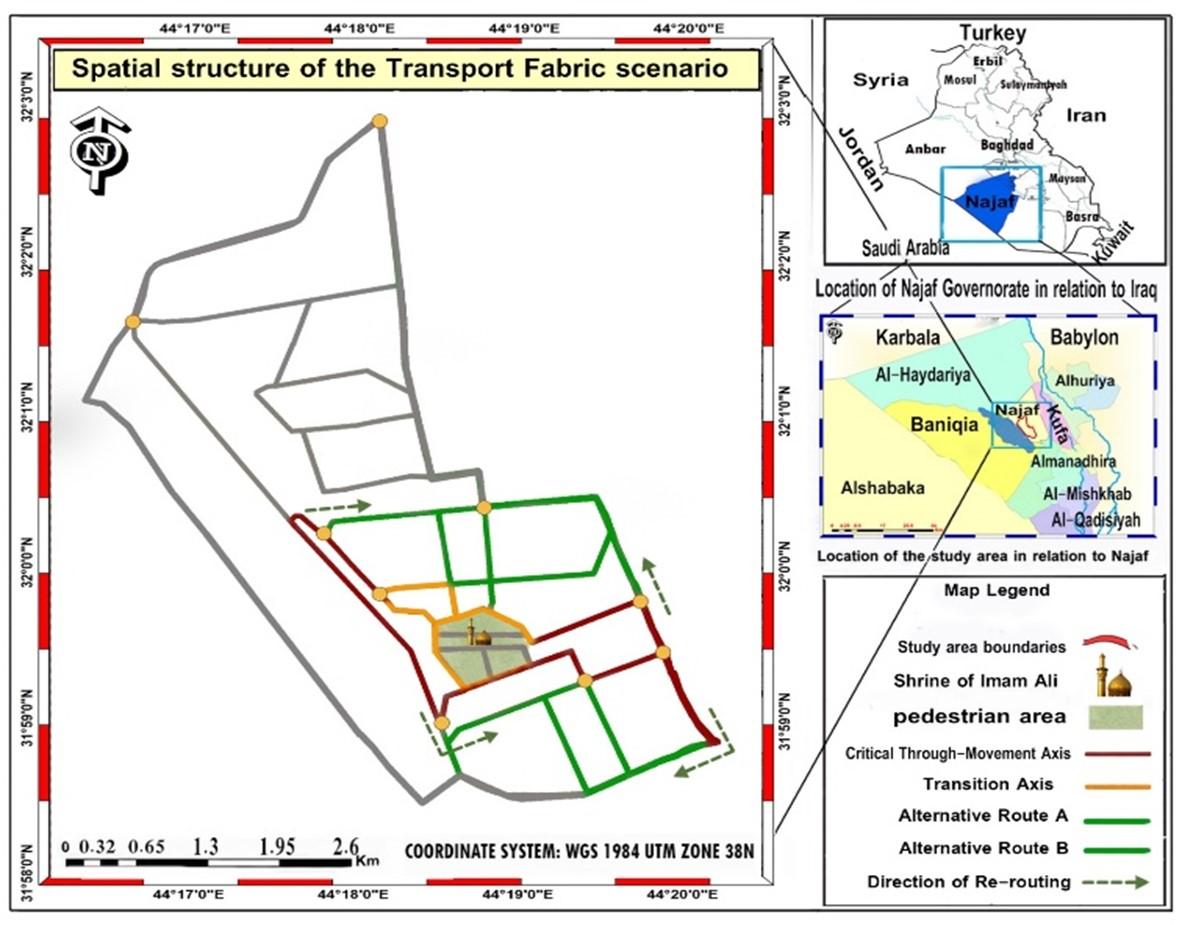
The Transport Fabric scenario was tested after the disruption analysis and field validation. Figure 9 illustrates the spatial logic of the scenario, in which movement roles are reassigned by reducing dependence on highly loaded elements and activating viable alternative routes within the available route structure. Table 8 presents the indicator changes after applying the Transport Fabric scenario.
Table 8. Indicator changes after the Transport Fabric scenario
|
Indicator |
After Link Disruption |
After Transport Fabric Scenario |
|
Mean Connectivity |
2.10 |
2.25 |
|
Mean Integration (Rn) |
0.67 |
0.69 |
|
Local Integration (R3) |
0.76 |
0.80 |
|
Network Density |
2.40 |
2.40 |
|
Mean Choice |
0.349 |
0.350 |
|
Choice Concentration |
2.5 |
1.6 |
|
Redundancy |
1–2 |
3–4 |
The results show that the Transport Fabric scenario improved the main accessibility and route-alternative indicators. Mean Connectivity increased from 2.10 to 2.25, Mean Integration (Rn) from 0.67 to 0.69, and Local Integration (R3) from 0.76 to 0.80. Redundancy increased from 1–2 to 3–4, while Choice Concentration decreased from 2.5 to 1.6. Network Density remained unchanged at 2.40.
Figure 9. Spatial structure of the Transport Fabric scenario
These changes indicate that the improvement was not produced by adding network extent, but by redistributing movement across available routes. The decrease in Choice Concentration indicates a more balanced distribution of through-movement, while the increase in Redundancy indicates stronger rerouting capacity under disruption.
The use of observed traffic volume (veh/h) provides a field-based operational indicator that supports the configurational diagnosis. Within the scope of this study, this validation is sufficient to examine whether analytically dominant elements also correspond to higher observed movement pressure in the field.
4.5 Comparative evaluation with the structural alternative
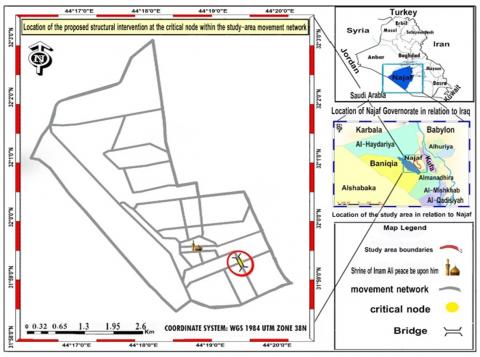
The structural alternative was modeled by adding a physical connection at the critical transition-node location. This scenario was included to compare the effect of physical addition with the effect of movement-role reassignment under the Transport Fabric scenario. Figure 10 shows the location of the structural intervention, and Table 9 presents a direct comparison between the node-disruption condition, the structural alternative, and the Transport Fabric scenario.
The structural alternative improved several indicators compared with the node-disruption condition. Mean Connectivity increased from 1.98 to 2.14, Mean Integration (Rn) from 0.65 to 0.68, Local Integration (R3) from 0.73 to 0.78, and Redundancy from 1–2 to 2–3. Choice Concentration also decreased from 2.6 to 2.20. These results indicate that adding a physical connection produced a measurable improvement after node disruption.
Figure 10. Location of the proposed structural intervention at the critical transition node
Table 9. Direct comparison between the structural alternative and the Transport Fabric scenario
|
Indicator |
After Node Disruption |
Structural Alternative |
Transport Fabric Scenario |
Comparative Reading |
|
Mean Connectivity |
1.98 |
2.14 |
2.25 |
Transport Fabric recorded a higher value than the structural alternative by 0.11 |
|
Mean Integration (Rn) |
0.65 |
0.68 |
0.69 |
Transport Fabric recorded a slight additional increase of 0.01 |
|
Local Integration (R3) |
0.73 |
0.78 |
0.80 |
Transport Fabric recorded a higher local integration value by 0.02 |
|
Network Density |
2.40 |
2.47 |
2.40 |
Structural alternative increased density, while Transport Fabric did not |
|
Mean Choice |
0.346 |
0.347 |
0.350 |
Mean Choice changed only slightly across the scenarios |
|
Choice Concentration |
2.6 |
2.20 |
1.6 |
Transport Fabric produced a stronger reduction in movement concentration |
|
Redundancy |
1–2 |
2–3 |
3–4 |
Transport Fabric produced a higher range of available alternatives |
The Transport Fabric scenario produced stronger results in the same comparison. Mean Connectivity reached 2.25, Local Integration (R3) reached 0.80, Choice Concentration decreased to 1.6, and Redundancy increased to 3–4. The difference is most evident in Choice Concentration and Redundancy: The Transport Fabric scenario reduced movement concentration more clearly and provided a higher range of alternative routes than the structural alternative.
Network Density provides an additional basis for comparison. The structural alternative increased Network Density from 2.40 to 2.47, whereas the Transport Fabric scenario kept Network Density unchanged at 2.40. Therefore, within the modeled scenarios, the Transport Fabric scenario achieved stronger improvement in movement distribution and rerouting capacity without increasing the physical extent of the network.
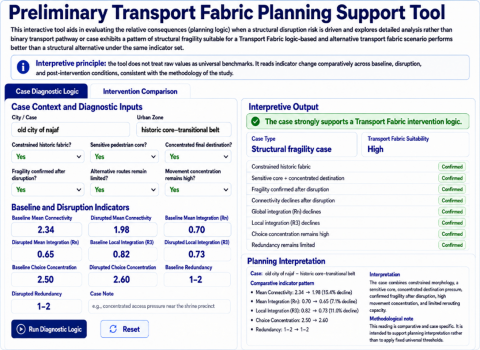
4.6 Applied planning support tool
The Transport Fabric Framework was translated from the comparison of the results and turned into a planning support tool and this tool is not regarded as a universal evaluation method or as a substitute for detailed traffic simulation. The purpose of this tool is to organize the analysis of the chosen indicators in different conditions, disrupted, structural-alternative, and Transport Fabric conditions.
The tool has two functions. First, it helps identify whether the studied movement system shows high movement concentration, limited redundancy, and sensitivity to disruption. Second, it supports comparison between a physical structural alternative and a movement-role reassignment scenario. In this way, the tool helps clarify whether improvement results from adding physical network extent or from redistributing movement across available routes.
The same indicator logic used in the analysis of this tool, which higher Mean Connectivity value, Mean Integration (Rn), and Local Integration (R3) indicate improved accessibility and cohesion, lower Choice Concentration indicates a more balanced distribution of through-movement; and higher Redundancy indicates stronger rerouting capacity. Figure 11 presents the preliminary interface of the planning support tool.
Figure 11. Preliminary interface of the Transport Fabric planning support tool based on the baseline and critical-node disruption values
In this study, the application of the Transport Fabric Framework on the improvement of mobility resilience in the Old city of Najaf has been investigated. The results show that apart from the lack of movement capacity of the study area, the major problem can be seen in the presence of excessive movement through only a few numbers of governing links and transit nodes, along with insufficient redundancies of the routes. The Mean Connectivity, Mean Integration (Rn), and Local Integration (R3) have been found to reduce during the occurrence of disruption, while Choice Concentration has remained high, and Redundancy of 1–2.
The validation and comparative assessment confirmed this design choice with traffic counts during the peak hours. High-choice links recorded the highest average volume, with 2020 veh/h, followed by critical transition nodes with 1480 veh/h, while alternative routes recorded 1100 veh/h. This comparison shows that analytically dominant or sensitive elements also carried higher observed movement pressure in the field, while alternative routes showed lower current loads and potential to support rerouting.
The Transport Fabric scenario achieved measurable improvement across the indicators. Mean Connectivity increased from (2.10 to 2.25), Mean Integration (Rn) from (0.67 to 0.69), Local Integration (R3) from (0.76 to 0.80), and Redundancy from (1–2) to (3–4), while Choice Concentration decreased from 2.5 to 1.6. These enhancing were achieved without increasing in Network Density. Which remained at 2.40. Therefore, the improvement resulted from reassigning movement roles and activating available alternatives rather than from expanding the physical extent of the network.
In comparison to the examined structure-based alternative, the scenario of the Transport Fabric is better in terms of enhancing mobility distribution, and rerouting capability among the tested alternatives. Hence, an important contribution of this research lies in demonstrating that configurational assessment, vulnerability analysis, verification using traffic counts in the field, and evaluation can form an evaluative and quantitative method for the management of historic fabric networks. The case of study area shows that the approach helps formulate interventions to reduce reliance on stressed elements and build alternative routes.
The mobility planning of historic cities must not be based only on physical development and individual capacity based approaches but must be measured using both a structural and an operational perspective with consideration given to the following parameters: Mean Connectivity; Mean Integration Rn, Local Integration R3, Choice Concentration, Redundancy and traffic flows. Such measures must be analyzed comparatively among various situations: baseline, disruption, and intervention.
Future interventions in Old city of Najaf and similar historic fabrics cities must prioritize the re-organization of movement roles within the existing network and that need distinguishing between the pedestrian center, edge transition nodes, vehicular distribution corridors, and alternative routes. Planning actions should aim to reduce dependence on high-pressure links and critical transition nodes, also strengthen local connectivity, and activate lower loaded alternative routes capable of supporting rerouted movement under disruption.
The field traffic count verification should be considered a part of any future usage of the Transport Fabric Framework because Selected traffic counts at links characterized by high choice, important transition nodes, and alternative paths will serve to confirm if the configurationally dominant linkages also carry more traffic volumes, this helps connect the network analysis with actual traffic conditions observed in the field.
Future research may develop the planning framework in this study by linking it to a more advanced planning support tool that is tied to GIS databases, field observations and movement time series. Extensions of the framework could also include other forms of disruption and varying pilgrimage conditions and, where data are available, complementary operational indicators such as travel time or simulation-based performance measures.
[1] Un-Habitat. (2013). Planning and design for sustainable urban mobility: Global report on human settlements 2013. Taylor & Francis.
[2] Banister, D. (2008). The sustainable mobility paradigm. Transport Policy, 15(2): 73-80. https://doi.org/10.1016/j.tranpol.2007.10.005
[3] Rodrigue, J.P. (2020). The Geography of Transport Systems. New York, Routledge.
[4] Babb, C. (2016). The end of automobile dependence: How cities are moving beyond car-based planning. Urban Policy and Research, 34(1): 90-92. https://doi.org/10.1080/08111146.2016.1155194
[5] Mattsson, L.G., Jenelius, E. (2015). Vulnerability and resilience of transport systems – A discussion of recent research. Transportation Research Part A: Policy and Practice, 81: 16-34. https://doi.org/10.1016/j.tra.2015.06.002
[6] Meerow, S., Newell, J.P., Stults, M. (2016). Defining urban resilience: A review. Landscape and Urban Planning, 147: 38-49. https://doi.org/10.1016/j.landurbplan.2015.11.011
[7] Al-Bari, E.S.A., Alrikabi, N.K., Alwan, K.H., Saadoon, R.A. (2025). Digitization of cities and its impact on city sustainability. International Journal of Sustainable Development and Planning, 20(3): 1317-1325. https://doi.org/10.18280/ijsdp.200337
[8] Ali, N.K.M., Ahmed, Z.A. (2021). Planning sustainable environmental neighborhoods is a step towards the direction of sustainable cities. IOP Conference Series: Earth and Environmental Science, 754: 012033. https://doi.org/10.1088/1755-1315/754/1/012033
[9] Fu, J.M., Tang, Y.F., Zeng, Y.K., Feng, L.Y., Wu, Z.G. (2025). Sustainable historic districts: Vitality analysis and optimization based on space syntax. Buildings, 15(5): 657. https://doi.org/10.3390/buildings15050657
[10] Ibrahim, I., Soussi, I., Al Qaysi, H. (2025). A space syntax comparative study on sustainable historic districts: Al-Fahidi, UAE and Al-Darb Al-Ahmar, Egypt. In City, Territory and Architecture, 12: 24. https://doi.org/10.1186/s40410-025-00274-8
[11] Althabhawi, G.J., Al-Khafaji, A.S. (2025). The role of accessibility to achieving sustainable revitalization of historic city centers: A study of the historic center of Al-Kifl City, Iraq. International Journal of Sustainable Development and Planning, 20(4): 1399-1419. https://doi.org/10.18280/ijsdp.200405
[12] Kazmi, S.Q.A., Naqvi, S.A.A., Hussain, E., Ahmed, S. (2023). Resilience assessment framework for an urban road network subjected to disruptions. KSCE Journal of Civil Engineering, 27(12): 5350-5361. https://doi.org/10.1007/s12205-023-1669-5
[13] Hillier, B. (2007). Space is the machine: A configurational theory of architecture. Space Syntax, pp. 1-344. https://discovery.ucl.ac.uk/id/eprint/3881.
[14] Hillier, B., Iida, S. (2005). Network and psychological effects in urban movement. In Spatial Information Theory. COSIT 2005. Lecture Notes in Computer Science, Springer, Berlin, Heidelberg, pp. 475-490. https://doi.org/10.1007/11556114_30
[15] Marshall, S. (2004). Streets and Patterns. Routledge.
[16] Porta, S., Crucitti, P., Latora, V. (2006). The network analysis of urban streets: A dual approach. Physica A: Statistical Mechanics and Its Applications, 369(2): 853-866. https://doi.org/10.1016/j.physa.2005.12.063
[17] Yang, L.X., Jin, Q.Z., Fu, F. (2024). Research on urban street network structure based on spatial syntax and POI data. Sustainability, 16(5): 1757. https://doi.org/10.3390/su16051757
[18] Boeing, G. (2019). Urban spatial order: Street network orientation, configuration, and entropy. In Applied Network Science, 4: 67. https://doi.org/10.1007/s41109-019-0189-1
[19] Karasu, B.M., Kirli Özer, G. (2026). Analyzing the impact of spatial configuration and function on movement patterns of first-time visitors to historic urban areas: A case study of Iznik. SAGE Open, 16(1). https://doi.org/10.1177/2158244026141658
[20] Bergantino, A.S., Gardelli, A., Rotaris, L. (2024). Assessing transport network resilience: Empirical insights from real-world data studies. Transport Reviews, 44(4): 834-857. https://doi.org/10.1080/01441647.2024.2322434
[21] Boeing, G., Ha, J. (2024). Resilient by design: Simulating street network disruptions across every urban area in the world. Transportation Research Part A: Policy and Practice, 182: 104016. https://doi.org/10.1016/j.tra.2024.104016
[22] Alam, T. (2026). Integrating space syntax and bathtub flood modelling to assess accessibility impacts of sea-level rise in Copenhagen’s historic core. Journal of Environmental Management, 397: 128314. https://doi.org/10.1016/j.jenvman.2025.128314
[23] Lyu, Y., Abd Malek, M.I., Ja’afar, N.H.B., Liu, C.Y., Liu, Z.J.Y., Han, Z.Y. (2025). Multi-data driven and space syntax approach to urban heritage revitalization: Insights from Zhongshan Rd. Historic District, China. Ain Shams Engineering Journal, 16(8): 103473. https://doi.org/10.1016/j.asej.2025.103473
[24] Chen, D.R., Wang, R.Q., Xiao, Y. (2025). Enhancing cultural heritage accessibility through space syntax: A case study of the archaeological site of the wooden water gate of southern Yue State. Journal of Asian Architecture and Building Engineering, 1-18. https://doi.org/10.1080/13467581.2025.2607901
[25] Alrikabi, N.K., Almosherefawi, O.J. (2021). Reality analysis of the state of spatial distribution of green areas using geographic information systems (GIS) – The holy city of Najaf as a case study. IOP Conference Series: Earth and Environmental Science, 754: 012009. https://doi.org/10.1088/1755-1315/754/1/012009
[26] Bedewy, B.A.H., Abdulameer, M.H., Asghar, M.S.A. (2024). Improving the quality of the urban environment effectively Sustainable Transport in Najaf/(Najaf-Kufa axis). Journal Port Science Research, 7: 275-289. https://doi.org/10.36371/port.2024.special.23
[27] Taher, S.H., Alkaissi, Z.A. (2024). Analysis the reliability of travel time in urban corridors in Baghdad City. Journal of Engineering, 30(7): 202-217. https://doi.org/10.31026/j.eng.2024.07.12
[28] Albabely, S., Alobaydi, D. (2024). Analyzing movement densities in AlKarkh Districts: A comparative study. Journal of Engineering, 30(4): 134-151. https://doi.org/10.31026/j.eng.2024.04.09