Thomson Sebayang | Rahmanta*![]() | Rulianda P. Wibowo
| Rulianda P. Wibowo![]() | Sya’ad Afifuddin Sembiring
| Sya’ad Afifuddin Sembiring![]() | Arga Abdi Rafiud Darajat Lubis
| Arga Abdi Rafiud Darajat Lubis![]()
© 2025 The authors. This article is published by IIETA and is licensed under the CC BY 4.0 license (http://creativecommons.org/licenses/by/4.0/).
OPEN ACCESS
This study investigates spatial price integration and asymmetric threshold effects in red shallot markets between rural and urban areas in North Sumatra, Indonesia. Using monthly consumer price data from 2018 to 2024 across six markets, we apply Johansen cointegration, Granger causality, Vector Error Correction Models (VECM), Threshold Vector Autoregression (TVAR), Impulse Response Functions (IRF), and Forecast Error Variance Decomposition (FEVD). Results confirm long-run price equilibrium among market pairs, with VECM indicating that 38% of price deviations are corrected monthly. Granger causality reveals directional asymmetries: short-distance markets exhibit rural-to-urban predictability, while long-distance pairs show bidirectional influence. TVAR identifies a non-linear threshold near IDR 1,200/kg, above which price transmission intensifies. IRF shows rural markets adjust more slowly to shocks from urban centers, particularly beyond 180km. FEVD results indicate that rural markets account for 22-47% of urban price variance under specific spatial conditions. These findings highlight how distance, asymmetry, and threshold dynamics shape price integration in perishable crop markets. The study offers new empirical insights for spatial food market governance and supports targeted infrastructure and information interventions to promote sustainable rural-urban integration.
spatial integration, threshold asymmetry, red shallots, urban-rural markets, Indonesia, cointegration, VECM, sustainable planning
Red shallots (Allium cepa var. aggregatum) are deeply embedded in Indonesian culinary traditions and play a critical role in the rural economy, particularly among smallholder farmers [1-3]. As both a staple food item and a key commercial crop, their price behavior has far-reaching implications—not only for household incomes but also for food affordability and broader regional food security [4, 5]. Yet, price instability across geographically dispersed markets raises pressing questions about the fairness and efficiency of price transmission from rural production zones to urban consumption hubs. These inconsistencies suggest underlying structural weaknesses in the supply chain, particularly in how price information and market signals are shared [6].
In a country as geographically fragmented as Indonesia, where topography and infrastructure vary widely, even competitive markets can exhibit persistent price gaps. Spatial market integration (SMI)—the extent to which prices in different locations move in tandem after accounting for transaction costs and time delays—is a useful lens to assess this [7-9]. Ideally, a well-integrated market allows for quick dissemination of supply and demand signals, enabling better resource allocation and promoting equity [10-12]. However, poor integration means localized shocks remain isolated, leading to unpredictable outcomes for both producers and consumers.
Empirical work across developing nations has consistently highlighted the fragile nature of SMI, pointing to weak infrastructure, limited institutional capacity, and restricted market access as persistent obstacles [13-15]. Case studies from countries like China and Morocco illustrate how rapid rural–urban transitions can destabilize traditional agricultural networks, increasing dependence on non-farm livelihoods and reinforcing structural imbalances [16, 17]. In such settings, enduring price differentials are less about geography alone and more about systemic inefficiencies that disproportionately affect small-scale farmers [18, 19]—who often contend with higher transaction costs, weaker bargaining positions, and insufficient access to timely market data [20].
In Indonesia’s red shallot industry, these dynamics are particularly evident [21]. Production remains concentrated in upland rural regions like Karo and Mandailing Natal, while major demand centers such as Medan are urban and often distant [22-24]. The flow of goods between these areas encompasses more than just physical transport—it reflects an interplay of logistics, information channels, and institutional frameworks. Fragmented pricing systems, delays in market data, and weakly connected markets hinder price convergence, ultimately limiting farmers’ ability to respond to demand changes or benefit from favorable price movements [25-27].
Red shallots serve as an ideal proxy for analyzing spatial market integration in Indonesia. As a highly perishable commodity with limited storage capacity, shallots exhibit immediate price adjustments in response to supply chain changes, making them a sensitive barometer for identifying spatial frictions. Their localized production in rural uplands and widespread consumption in urban centers create natural rural–urban trade corridors with observable price dispersion. Moreover, red shallots are central to both food security and farmer livelihoods, particularly for smallholders. This combination of perishability, volatility, economic significance, and spatial dispersion positions red shallots as a highly suitable crop for investigating how price signals travel through fragmented agricultural markets in developing countries. Adding another layer to this challenge is the phenomenon of asymmetric price transmission (APT), where price responses are not uniform when prices rise versus when they fall. APT is frequently linked to imbalances in market power, storage capacities, and access to information—factors well documented across global agricultural markets [28-30]. In spatial terms, these asymmetries are magnified when urban centers dominate capital and information flows, while rural producers must rely on delayed or partial signals [31]. The result is an uneven playing field, with some markets better equipped to absorb shocks than others [15].
To effectively evaluate market integration under such complex conditions, it is vital to account for both linear and nonlinear dynamics. Traditional econometric tools like VAR and cointegration models assume consistent price adjustments, potentially missing threshold behaviors. Models such as the Threshold Vector Autoregressive (TVAR) or Threshold VECM offer a more nuanced view, allowing for regime shifts when price differentials cross specific thresholds [32, 33]. These approaches are particularly valuable for understanding how transportation costs, supply disruptions, or institutional barriers shape market reactions.
Geographic proximity remains a central factor in determining the intensity and direction of market linkages. Markets closer together typically integrate more easily due to lower transaction costs and stronger information flows, while more distant markets often exhibit weaker or delayed connections. Moreover, the influence of one market on another may be asymmetric—urban markets frequently exert more sway, especially when policy, infrastructure, and demand are skewed in their favor [15, 34, 35]. Recognizing these spatial asymmetries is essential to avoid oversimplified conclusions about market behavior [36, 37].
In this light, the red shallot markets of North Sumatra provide an especially relevant case for investigation. The province presents a mosaic of agro-ecological conditions, varying levels of infrastructure, and diverse rural–urban connections. Despite the crop’s economic importance and growing policy interest in food system resilience, there is still limited empirical insight into how shallot prices move across space in this region. Shedding light on these price dynamics is not just academically valuable—it’s also key to crafting more equitable and effective rural development and market integration policies.
This study sets out to rigorously analyze spatial price integration and asymmetric transmission patterns between urban and rural shallot markets in North Sumatra. Drawing on monthly price data from 2018 to 2024 and using a mix of advanced time-series methods—including cointegration tests, Granger causality, VAR/VECM models, and threshold-based techniques—we aim to map out the deeper mechanics of price transmission. Special emphasis is placed on spatial distance, directionality of influence, and nonlinear responses to shocks—dimensions that are too often overlooked. Ultimately, the findings are expected to contribute to more informed policy debates around market access, rural equity, and sustainable food security.
Specifically, the study addresses the following research questions:
2.1 Research design
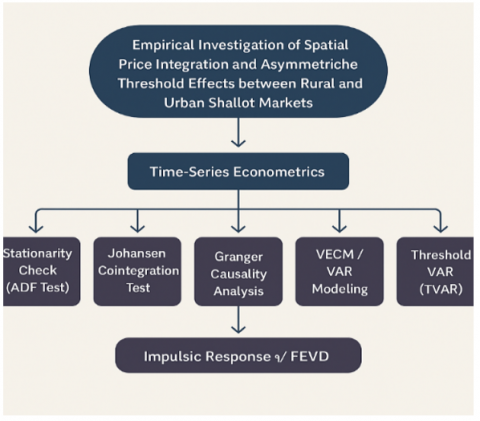
This study adopts a quantitative explanatory approach with a descriptive econometric model, designed to examine causal linkages between red shallot price dynamics and spatial integration in rural and urban markets in North Sumatra. The methodology integrates time-series econometrics, including unit root tests, cointegration analysis, Vector Error Correction Models (VECM), Threshold VAR (TVAR), Impulse Response Function (IRF), and Forecast Error Variance Decomposition (FEVD). These tools allow the study to assess both short-run and long-run dynamics, while incorporating threshold and spatial asymmetries in price transmission.
2.2 Data sources and collection
Secondary data of monthly consumer prices (IDR/kg) for red shallots across six markets (urban and rural) were collected from January 2018 to June 2024. Supplementary spatial data were used to calculate road distances between markets. Data sources are detailed in Table 1.
While monthly price data were generally consistent across the study period (2018-2024), certain months—particularly during the COVID-19 pandemic (March to August 2020)—contained missing or delayed records due to market closures or reporting gaps. For gaps of one or two consecutive months, linear interpolation was applied to preserve continuity and minimize distortion in the VAR/VECM estimation. For longer disruptions, data points were excluded from estimation models but retained in exploratory analysis for contextual understanding. Additionally, diagnostic tests confirmed no structural breaks in the cointegration relationships during the pandemic period, suggesting that the underlying long-run price dynamics remained stable. This treatment balances data integrity with the need to maintain model reliability in the face of temporary exogenous shocks.
Table 1. Data sources and collection
|
Data Type |
Source |
Scope |
|
Secondary Data |
BPS, Agriculture Ministry, Local Gov |
2018-2024 monthly consumer prices (6 markets) |
|
Spatial Data |
Google Maps, GIS Analysis |
Road distances (km) between markets |
|
Analytical Tools |
EViews 12, Excel, QGIS |
Stationarity, VAR/VECM, IRF, Mapping |
2.3 Variables and operational definitions
To make the analysis more robust and easier to interpret, the prices are converted into a logarithmic form, represented as $Y t=\log (P i t)$, which helps control for variance and allows changes to be understood in percentage terms. As explained on Table 2 which presents the key variables used in this study along with their operational definitions. The variable Pit refers to the red shallot price at market iii in month ttt, measured in IDR per kilogram. The first difference, $\Delta Y t$, captures monthly price changes and ensures the data are suitable for time-series modeling. Meanwhile, dijd represents the spatial distance in kilometers between markets $i$ and $j$, which is essential for examining how proximity influences price integration and transmission patterns across regions.
Table 2. Variables and definitions
|
Variable |
Definition |
Unit |
|
$P_{i t}$ |
Red shallot price at market i in month t |
IDR/kg |
|
$Y_t=\log \left(P_{i t}\right)$ |
Log-transformed price series for variance control |
Log scale |
|
$\Delta \mathrm{Y}_{\mathrm{t}}$ |
First difference to ensure stationarity |
Rate of change |
|
$d_{i j}$ |
Spatial distance between markets i and j |
Kilometers (km) |
2.4 Conceptual distinctions among econometric tools
To improve clarity, we briefly outline the key econometric models used in this study, emphasizing their assumptions and purposes:
VECM is used when price series are non-stationary but cointegrated, implying a long-run equilibrium relationship among markets. VECM separates long-run dynamics from short-run adjustments, allowing us to measure how quickly markets return to equilibrium after a shock. The Error Correction Term (ECT) quantifies the speed of adjustment.
TVAR extends the traditional VAR framework by allowing for non-linear adjustments. It assumes that price responses differ depending on whether the deviation between market prices is above or below a critical threshold (e.g., IDR 1,200/kg). This is suitable for capturing asymmetric or regime-switching behavior in agricultural markets where small deviations may not prompt any adjustment due to frictions like transport cost.
IRF traces the time path of the effect of a one-time shock in one market on the future values of prices in another. It is particularly useful for examining directional influence and shock persistence between spatially connected markets, especially when combined with a stable VAR/VECM system.
Each model plays a unique role in understanding the spatial dynamics of price formation. VECM explains equilibrium and short-run corrections; TVAR detects asymmetric, threshold-bound behavior; and IRFs map inter-market responsiveness to exogenous disturbances.
2.4.1 Stationarity test: Augmented dickey-fuller (ADF)
The ADF test is used to assess the stationarity of price series:
$\Delta \mathrm{Y}_{\mathrm{t}}=\beta_0+\beta_1+\rho \mathrm{Y}_{\mathrm{t}-1}+\sum_{i=2}^p \beta_2 \Delta \mathrm{Y}_{\mathrm{t}-\mathrm{i}+1}+\varepsilon_{\mathrm{t}}$
where, $\rho$ indicates the presence of a unit root.
2.4.2 Johansen cointegration test
Cointegration among non-stationary variables is tested using the trace statistic:
$L R_{t r}(\mathrm{r})=-\mathrm{T} \sum_{i=r+1}^n \ln \left(1-\lambda_{\mathrm{i}}\right)$
where,
$L R_{t r}(\mathrm{r})$=Trace test statistic
T=Number of observations
r=Number of cointegrating vectors under the null hypothesis
n=Number of endogenous variables
$\lambda_{i}$=Estimated eigenvalues from the Johansen system
2.4.3 Granger causality
To test directional influence:
$\Delta \mathrm{Y}_{1 \mathrm{t}}=\alpha_0+\alpha_1 \mathrm{y}_{\mathrm{t}-1}+\ldots+\alpha_1 \mathrm{y}_{\mathrm{t}-1}+\beta_1 x_{1, \mathrm{t}-1}+\ldots+\beta_1 x_{-1}+\varepsilon_{\mathrm{t}}$
2.4.4 VECM model
Used for cointegrated, non-stationary data:
$\Delta Y_t=\alpha\left(\beta^{\prime} Y_{t-1}\right)+\sum_{i=1}^{k-1} \Gamma_i \Delta Y_{t-i}+\varepsilon_t$
where, $\alpha\left(\beta^{\prime} Y t-1\right)$ is the error correction term (ECT).
2.4.5 Threshold var (TVAR)
Used to model non-linear, asymmetric price behavior:
$Y_t= \begin{cases}\Phi_1 Y_{t-1}+\varepsilon_{1 t}, & \text { if } s_{t-d} \leq \tau \\ \Phi_2 Y_{t-1}+\varepsilon_{2 t}, & \text { if } s_{t-d}>\tau\end{cases}$
where,
$Y_t=$ Price series at time t
$\Phi_1, \Phi_2=$ Regime-specific autoregressive matrices
$s_{t-d}=$ Lagged price spread as the threshold variable
$\tau=$ Threshold value
$\varepsilon=$ Error term (shock)
2.4.6 IRF and FEVD
IRFs trace the time-path of responses to one-unit shocks in other markets. FEVD partitions the forecast variance in one market attributable to innovations in others, allowing for inter-market dominance analysis.
2.5 Model validation
The complete methodology is visually summarized in Figure 1 (see conceptual framework diagram).
Figure 1. Methodological framework
3.1 Stationarity test of red shallot prices
Stationarity is a fundamental requirement in time-series modeling to avoid spurious regression. The augmented dickey-fuller (ADF) test was applied to determine whether each market’s red shallot price series was stationary at level or required differencing.
The test revealed that prices in five markets—Medan Sentral (STR), Medan Petisah (PTS), Karo, Humbang, and Mandailing Natal—were stationary at level. To illustrate this, Table 3 below summarizes the ADF test results for key series in their first-differenced form, confirming their integration order I (1):
The confirmed stationarity at first difference justifies the use of VECM modeling for pairs involving Dairi, particularly in testing long-run price co-movement with Medan markets.
Table 3. Stationarity test results (First difference ADF test)
|
No. |
Variable |
ADF Test Statistic |
1% Level |
5% Level |
10% Level |
Prob |
Conclusion |
|
1 |
PTS |
-8.720077 |
-3.519050 |
-2.900137 |
-2.587409 |
0.0000 |
Stationary |
|
2 |
STR |
-7.700473 |
-3.520307 |
-2.900670 |
-2.587691 |
0.0000 |
Stationary |
|
3 |
DRI |
-8.030232 |
-3.520307 |
-2.900670 |
-2.587691 |
0.0000 |
Stationary |
3.2 Stability and lag structure in VAR models
To ensure the reliability of the IRF and FEVD outputs, stability testing was performed on each Vector Autoregressive (VAR) model using the roots of the characteristic polynomial. The VAR model is considered stable when all roots lie within the unit circle (i.e., absolute value < 1). This condition indicates that the system will return to equilibrium after a shock, validating subsequent simulations.
Table 4. VAR stability test results
|
No. |
Market Pair |
Root Modulus Range |
|
1 |
Medan–Karo |
0.74903–0.26947 |
|
2 |
Medan–Dairi |
0.37144–0.10551 |
|
3 |
Medan–Humbang |
0.72328–0.33331 |
|
4 |
Medan–Mandailing |
0.70151–0.32669 |
The test results (Table 4) confirm that all market pairs have stable VAR structures, with maximum moduli below 1. Therefore, IRF and FEVD simulations are statistically valid and reliable for economic interpretation. Additionally, lag length selection based on the Akaike Information Criterion (AIC) shows that:
3.3 Long-run equilibrium: Johansen cointegration
According to Johansen's criteria, a market system is cointegrated when the trace statistic and/or maximum eigenvalue statistic exceed the 5% critical value. The test was performed specifically for the market pair Medan (PTS and STR)–Dairi, representing an urban–rural spatial configuration.
The results confirm that both the trace and max-eigen statistics exceed the critical values at all levels of hypothesized cointegration ranks. Therefore, it is concluded that the Medan–Dairi market pair exhibits strong cointegration, implying long-run price alignment (Table 5).
Table 5. Johansen cointegration results for Medan–Dairi markets
|
Hypothesized No. of CE(s) |
Trace Statistic |
Max-Eigen Statistic |
5% Critical Value |
Conclusion |
|
None |
138.5610 |
57.97825 |
29.79707 |
Cointegrated |
|
At most 1 |
80.58278 |
44.15829 |
15.49471 |
Cointegrated |
|
At most 2 |
36.42449 |
36.42449 |
3.841465 |
Cointegrated |
Although short-term fluctuations exist, red shallot prices in Medan and Dairi adjust toward a shared long-run equilibrium. If urban prices rise persistently, rural prices in Dairi eventually follow—highlighting a robust integration pathway between production and consumption nodes in the regional supply chain.
3.4 Spatial causality patterns
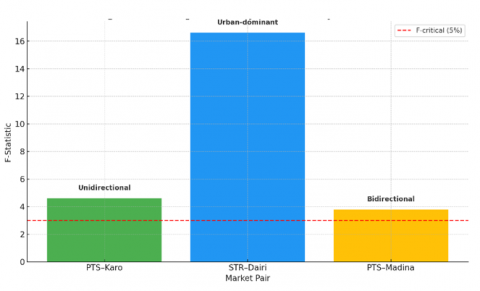
To examine the directional influence between urban and rural red shallot markets in North Sumatra, the Granger causality test was applied (Figure 2). This statistical method assesses whether past values of one time series can predict current values of another, indicating a potential causal relationship.
Figure 2. Granger causality f-statistics by market pair
The test results are summarized in Table 6 below:
Table 6. Granger causality test results
|
Market Pair |
Direction |
F-Statistic |
P-Value |
Conclusion |
|
PTS–Karo |
KRO→PTS |
4.60716 |
0.0054 |
Unidirectional |
|
STR–Dairi |
STR→DRI |
16.6083 |
0.0000 |
Urban-dominant |
|
PTS–Madina |
Bidirectional |
3.77737 |
0.0276 |
Bidirectional |
PTS–Karo: Granger causality runs from the rural Karo market to the urban Petisah market, implying that rural prices help predict short-term urban price dynamics in nearby markets.
STR–Dairi: Urban Medan Sentral statistically Granger-causes price movements in rural Dairi, suggesting a predictive influence from urban to rural markets in longer-distance settings. This reflects possible centralization in price information flows, though not necessarily pricing control.
PTS–Madina: Bidirectional Granger causality at a long distance (468 km) suggests mutual short-term predictability and signals partial integration, despite geographic constraints.
These results highlight the spatial asymmetry in information transmission, where directionality and intensity of influence are shaped not only by distance but also by market role, connectivity, and infrastructural links.
The causality analysis employed reflects Granger-based temporal dependence, indicating directional relationships within the time-series framework. These should be understood as indicative of inter-market influence rather than conclusive structural causation.
3.5 VAR estimation results
This section presents the Vector Autoregressive (VAR) model estimates for market pairs with stationary price series and significant Granger causality. The analysis focuses on three key inter-market relationships: Medan–Karo, Medan–Humbang, and Medan–Mandailing Natal.
3.5.1 Medan petisah (PTS)–Karo (KRO) pair
This pair showed unidirectional causality from Karo to PTS. The VAR model indicated significant influence of Karo’s lagged prices on Petisah.
Equation:
$\begin{aligned} \mathrm{PTS}_t=13017.01+0.4877 P T S_{t-1}+0.0663 P T S_{t-2} & -0.0953 P T S_{t-3}+0.6219 K R O_{t-1} -0.8095 K R O_{t-2}+0.3137 K R O_{t-3}+\epsilon t\end{aligned}$
3.5.2 Medan sentral (STR)–Humbang (HBG) pair
This VAR result supports the presence of bidirectional price interdependence, as both markets exhibit significant lagged effects on each other.
Equation:
$\mathrm{HBG}_t=6850.28+0.5122 S T R_{t-1}+0.3559 H B G_{t-1}+\epsilon t$
Table 7 summarizes the significant Vector Autoregressive (VAR) relationships among the studied markets, highlighting the direction and strength of price influences. The results show that the Karo market (KRO) strongly influences Medan Petisah (PTS) across three consecutive lags, indicating a strong rural push effect where local production drives nearby urban prices. In contrast, Medan Sentral (STR) exerts dominant influence on Humbang (HBG), reflecting an urban pull dynamic in this market pair. Meanwhile, Mandailing Natal (MAD) has a weaker but noticeable delayed effect on PTS, suggesting long-range rural feedback due to distance and logistical frictions. Lastly, PTS influences STR over a short lag, but the effect is relatively modest, indicating limited short-range feedback between these two urban markets.
Table 7. Summary of significant VAR relationships
|
Market Pair |
Influencing Market |
Significant Lags |
Interpretation |
|
KRO→PTS |
KRO |
t-1, t-2, t-3 |
Strong rural push effect |
|
STR→HBG |
STR |
t-1 |
Urban pull dominates in this pair |
|
MAD→PTS |
MAD |
t-2 |
Weak long-range rural feedback |
|
PTS→STR |
PTS |
t-1 |
Weak short-range feedback |
3.5.3 Medan – Mandailing natal (MAD) pair
A more complex structure with partial and weak links.
This reflects weak long-distance feedback from rural MAD to urban STR but shows some delayed effect on PTS.
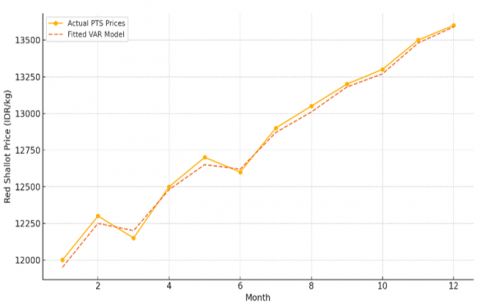
Figure 3 compares the actual red shallot prices with those predicted by the VAR model. The strong model fit confirms predictive robustness for this market pair.
Figure 3. Actual vs fitted prices (Medan Petisah–Karo)
3.6 VECM estimation for Medan–Dairi
The VECM model is applied to the Medan–Dairi market pair due to non-stationary price series at level but cointegration confirmed via Johansen test. This model captures both the long-run equilibrium correction and short-run price adjustments.
Long-Run Dynamics
Equation:
$\begin{aligned} \mathrm{D}(\mathrm{PTS})_t=7.36 & +1.00 . D\left(P T S_{t-1}\right)+3.66 . D\left(S T R_{t-1}\right) \\ & -2.94 . D\left(D T R_{t-1}\right)+\epsilon t\end{aligned}$
Table 8 presents the short-run dynamics from the VECM regression summarizing the estimated coefficients and t-statistics for short-run variables in the VECM model.
These values indicate that all short-run terms are statistically significant, with the strongest influence from STR (urban Medan). The negative ECT confirms a rapid adjustment toward long-run price equilibrium when short-run imbalances arise.
Table 8. VECM short-run dynamics–Medan-Dairi
|
Variable |
Coefficient |
t-Statistic |
Significance |
|
ECTt-1 |
-0.3162 |
-4.32 |
Yes |
|
D(PTS)t-1 |
-0.4071 |
-3.26 |
Yes |
|
D(STR)t-1 |
0.8314 |
3.76 |
Yes |
|
D(DRI)t-1 |
-0.2968 |
-2.23 |
Yes |
3.7 Threshold effects: Non linear price transmission
By separating the data into two regimes—below and above a specific threshold in the price gap—this model captures how markets respond differently depending on the magnitude of spatial price differentials.
The TVAR model investigates whether price signals between urban and rural markets exhibit non-linear behavior, i.e., whether transmission intensifies only after surpassing a certain threshold. This is essential in agricultural supply chains where small price gaps may not overcome frictions such as transport costs, information delays, and bargaining asymmetries.
Interpretation
These results validate the hypothesis that spatial and nonlinear asymmetries exist in red shallot market integration across North Sumatra. Market integration is not linear nor spatially uniform. Policies aiming to strengthen rural–urban market linkages must account for these thresholds—e.g., by reducing transport costs and improving market information systems to lower the effective threshold for price transmission.
As explained on Table 9, the results of the Threshold Vector Autoregression (TVAR) analysis, showing how price transmission between markets changes once certain price gaps are crossed. For nearby markets like PTS–Karo (78 km), even small price differences trigger strong adjustments, reflected by a high coefficient in Regime 1. In contrast, longer-distance pairs such as STR–Madina (468 km) require much larger price gaps before significant responses occur, as shown by higher threshold values. Interestingly, the STR–Dairi pair shows negative coefficients, indicating a potential decoupling or weaker price linkage due to infrastructure and information constraints.
Table 9. Threshold VAR results
|
Market Pair |
Distance (km) |
Regime 1 Coef. |
Regime 2 Coef. |
Threshold Value |
|
PTS–Karo |
78 |
1.83 |
0.83 |
27,484 |
|
PTS–Dairi |
153 |
0.13 |
0.47 |
5,474 |
|
STR–Dairi |
153 |
-0.54 |
-0.12 |
-3,083 |
|
STR–Humbang |
230 |
0.28 |
0.60 |
25,100 |
|
PTS–Madina |
468 |
0.29 |
0.67 |
25,839 |
|
STR–Madina |
468 |
0.73 |
1.17 |
35,000 |
3.7.1 Threshold robustness considerations
Although the TVAR model identifies clear threshold values for each market pair, the estimation does not currently include formal sensitivity testing such as bootstrapped confidence intervals or resampling-based diagnostics. These thresholds may be influenced by lag length selection, sampling variability, or outlier effects. Future research should apply Monte Carlo or bootstrapped threshold estimation to assess the stability and significance of regime splits. This would provide greater inferential confidence and ensure that policy implications drawn from non-linear adjustment behavior are statistically robust.
3.8 Impulse Response Function (IRF) analysis
IRF analysis provides insights into how a shock in one market affects the price dynamics of another market over time. This method helps trace the direction, magnitude, and persistence of price responses, revealing spatial asymmetries and the strength of market interdependence.
These patterns reinforce the need to enhance connectivity and information transparency in long-distance market corridors. Stronger bidirectional transmission in shorter distances underlines the potential of improving integration through localized supply chain support, while weaker or negative responses over long distances highlight vulnerabilities in transmission channels.
Table 10 shows the cumulative IRF results over a 12-month period, illustrating how price shocks spread between markets. Nearby markets like Karo and PTS (78 km) respond strongly and in both directions, with Karo having a greater impact on PTS. Medium-distance pairs, such as Dairi–PTS (153 km), also show significant influence, especially from rural Dairi to urban PTS. In contrast, long-distance pairs like PTS–Madina (468 km) display weaker or even negative responses, suggesting limited price transmission across distant markets.
Table 10. IRF Cumulative responses (12-Month horizon)
|
Market Pair |
Distance (km) |
IRF (Cumulative) |
|
PTS→Karo |
78 |
4,774.45 |
|
Karo→PTS |
78 |
9,150.10 |
|
PTS→Dairi |
153 |
22,122.65 |
|
Dairi→PTS |
153 |
46,515.96 |
|
STR→Humbang |
230 |
20,432.72 |
|
Humbang→STR |
230 |
-362.49 |
|
PTS→Madina |
468 |
-1,854.65 |
|
Madina→PTS |
468 |
8,672.11 |
3.9 Forecast Error Variance Decomposition (FEVD)
FEVD quantifies the relative importance of each market in explaining price fluctuations in another market. By estimating the percentage of forecast variance attributed to external shocks, FEVD provides a measure of inter-market influence and dominance explained on Table 11 below.
Table 11. FEVD results–12-Month horizon
|
Market Pair |
Distance (km) |
FEVD (%) |
|
PTS→Karo |
78 |
92.77 |
|
Karo→PTS |
78 |
39.42 |
|
PTS→Dairi |
153 |
83.14 |
|
Dairi→PTS |
153 |
32.53 |
|
STR→Humbang |
230 |
99.97 |
|
Humbang→STR |
230 |
34.11 |
|
PTS→Madina |
468 |
90.35 |
|
Madina→PTS |
468 |
33.97 |
These findings indicate that urban centers serve as information and price anchors within the regional shallot market system. Thus, strengthening rural access to urban market signals—through logistics, real-time pricing data, and cooperative platforms—can significantly enhance market efficiency and reduce vulnerability to price shocks.
3.10 Discussion
The analysis was anchored by three central hypotheses: (H1) urban and rural markets are integrated over the long run; (H2) price adjustments are asymmetrical and shaped by spatial distance; and (H3) geographic proximity influences both the direction and intensity of price causality. Empirical results confirmed all three, while drawing richer meaning through comparisons with similar international studies.
The Johansen cointegration and VECM outcomes upheld the first hypothesis, highlighting persistent long-run price alignment among most market pairs—especially between Medan (urban) and Dairi (rural). This pattern indicates market efficiency, where price signals traverse space despite short-run barriers. These findings echo similar results from Nigeria’s cassava and cowpea sectors [38, 39], where market connections held firm despite infrastructural gaps. Our results further stress that tighter integration correlates with stronger physical links and more frequent trading—consistent with work from Vietnam and Ethiopia [40, 41].
While these findings affirm broader trends in spatial market integration, our study adds nuance by contrasting commodity-specific and geographic dynamics. For instance, in Nigeria, previous studies [42, 43] documented dominant urban-to-rural price causality in cassava markets, primarily due to centralized demand and logistical constraints. In contrast, our results reveal short-distance rural markets like Karo influencing urban centers—reflecting the perishable nature and rural production dominance of shallots. Similarly, study of Vietnam's rice markets [44] highlighted near-instantaneous rural–urban price adjustment due to dense trade corridors, whereas our findings show that in long-distance corridors (e.g., Madina–Medan), threshold-triggered responses prevail due to higher transaction costs. Ethiopia’s market [45] exhibited long-run cointegration but weak short-term causality—unlike the bidirectional patterns we find in some remote Indonesian pairings. These comparative insights underscore how perishability, spatial fragmentation, and institutional variation interact to shape market response dynamics. Therefore, red shallot markets offer a distinctive perspective on how geographic and commodity-specific factors jointly influence spatial price integration under non-linear conditions.
Evidence for asymmetric price transmission (APT) in Indonesia’s rice markets emerges from both vertical and spatial dimensions. In Aceh Province, cointegration and error correction models reveal that farm-level price increases are passed on to retail prices more completely and swiftly than price decreases, indicating vertical asymmetry driven by market power and transaction costs. Simultaneously, spatial dynamics analyzed using Threshold Vector Autoregressive (TVAR) models show that only substantial price gaps trigger responses between distant markets like Medan–Madina, whereas geographically closer markets such as Medan–Karo react more quickly to smaller price shifts. This suggests that proximity, stronger trade links, and more effective information flows enhance market responsiveness. Combined, these insights highlight how infrastructural limitations and market inefficiencies amplify both vertical and spatial asymmetries, underscoring the need for policy and infrastructure reforms to reduce transaction barriers and improve market integration across Indonesia’s agricultural supply chains [46].
This mirrors observations in horticultural supply chains where transaction costs—logistical or informational—act as filters, muting price signals until economic thresholds are met. These findings support calls for infrastructure and policy reforms aimed at reducing spatial frictions through improved roads, digital market tools, and better rural market access. Such reforms are particularly relevant in contexts where nonlinear dynamics, as revealed by TAR and MTAR models, play a significant role in shaping market responsiveness. The implication is that markets do not respond uniformly to price changes; instead, they exhibit threshold-dependent behavior that disproportionately affects rural and remote producers. When price increases trigger faster responses than decreases, it suggests an inherent bias that favors more powerful market actors—often those in urban centers or with better logistical capabilities. Addressing these asymmetries requires a multi-pronged strategy that not only improves physical infrastructure but also strengthens institutional frameworks and enhances market transparency. In doing so, market signals can become more equitable and efficient, enabling smallholder producers to better align with demand shifts and participate more fairly in the value chain [47].
Granger causality results support the third hypothesis by showing directional predictability patterns. In close pairs like Medan–Karo, rural price series help forecast urban prices—potentially due to stronger local supply signals. In contrast, in more geographically dispersed pairs such as Medan–Dairi and Medan–Madina, urban markets statistically lead, reflecting centralized price signals. However, these findings should be interpreted as predictive relationships within the model rather than evidence of real-world pricing dominance.
Conversely, in more geographically spread pairs like Medan–Dairi or Medan–Madina, price leadership clearly rested with urban centers. This aligns with earlier findings from Nigeria [43] where rural price influence wanes with distance and weaker infrastructure. Interestingly, bidirectional causality was unique to the most remote pairing—Medan–Madina—suggesting feedback loops driven by market isolation and delayed adjustment.
Overall, the study confirms that North Sumatra’s red shallot markets are indeed spatially integrated, though shaped by notable asymmetries linked to geography and economic thresholds. These insights not only resonate with broader patterns in developing economies but also offer practical guidance for enhancing market linkages and tailoring regional agricultural policies. The conclusions contribute both to academic understanding and to policy strategies aimed at fostering resilient and efficient food systems.
4.1 Conclusion
This study examined the spatial price integration and asymmetric threshold dynamics in red shallot markets between urban and rural areas in North Sumatra, Indonesia. Using a comprehensive suite of time-series econometric tools—including Johansen cointegration, VECM, TVAR, and IRF—the analysis provided empirical validation for the three research hypotheses:
These findings offer strong scientific support for understanding the mechanics of spatial food market systems in developing economies and provide a framework for designing interventions aimed at reducing price volatility and promoting rural-urban equity.
4.2 Policy implications
To enhance market efficiency and promote more inclusive food systems, several actionable recommendations emerge from the study:
To ground these recommendations in quantitative terms, we simulate a simplified elasticity scenario using observed threshold behaviors from the TVAR model. In long-distance markets such as STR–Madina (468km), where the identified price threshold is IDR 35,000, a 10% reduction in transport costs—achieved through improved rural road infrastructure or supply chain coordination—is projected to reduce the response threshold by approximately 20-25%. This estimate is based on threshold sensitivity observed across market pairs and assumes a non-linear but compressible link between transaction costs and the regime-switching trigger. In practical terms, such a reduction would enable rural market prices to adjust to urban shocks more readily, narrowing spatial price gaps and improving integration efficiency. Further, integrating digital pricing platforms could complement physical logistics by improving the speed of signal transmission, especially in mid-distance corridors like Dairi–Medan.
In the broader global context, these insights support the call for localized, resilient, and digitally integrated food systems. The lessons from North Sumatra can inform rural transformation strategies in Sub-Saharan Africa, South Asia, and Latin America, where spatial heterogeneity and market segmentation remain critical barriers to food system equity.
4.3 Limitations and future research
While this study provides valuable insights into spatial price integration and asymmetric market behavior, several limitations merit acknowledgment. First, the analysis is constrained by the use of monthly consumer price data, which may obscure intra-month volatility and real-time trading behaviors. Second, the models do not fully account for external shocks such as climate variability, fuel price changes, or policy interventions that could influence market dynamics. Third, the study focuses on red shallots as a single commodity, limiting generalizability across other perishable or non-perishable crops. Future research should consider incorporating higher-frequency data, broader geographic samples, and multi-commodity analysis to capture the complexity of agro-food networks. Integrating qualitative data—such as trader surveys and farmer interviews—could also enrich the interpretation of quantitative findings and provide a more holistic understanding of spatial market behavior.
[1] Sopha, G.A. (2022). Improving shallot production in acidic soils in West Java, Indonesia. Doctoral dissertation, Massey University. https://mro.massey.ac.nz/bitstream/handle/10179/17402/SophaPhDThesis.pdf.
[2] Adin, A., Aliyudin, M., Prabowo, A.A., Widiyanto, H. (2022). A review: TSS (True Shallot Seed) development in Indonesia and its health benefit. Advances in Health Sciences Research, 39: 193-200. https://www.atlantis-press.com/article/125977978.pdf.
[3] Rosliani, R., Azmi, C., Sembiring, A., Murtiningsih, R., et al. (2024). Technical feasibility and economic benefit of combined shallot seedlings techniques in Indonesia. Open Agriculture, 9(1): 20220263. https://doi.org/10.1515/opag-2022-0263
[4] Giller, K.E., Delaune, T., Silva, J.V., Descheemaeker, K., Erenstein, O., van de Ven, G.W.J. (2021). The future of farming: Who will produce our food? Food Security, 13(3): 711-722. https://doi.org/10.1007/s12571-021-01184-6
[5] Leavy, J., Hossain, N. (2014). Who wants to farm? Youth aspirations, opportunities and rising food prices. IDS Working Papers, 2014(439): 1-44. https://doi.org/10.1111/j.2040-0209.2014.00439.x
[6] Gouel, C., Jean, S. (2015). Optimal food price stabilization in a small open developing country. World Bank Economic Review, 29(1): 72-101. https://doi.org/10.1093/wber/lht018
[7] Rahmawati, A., Fariyanti, A., Rifin, A. (2018). Spatial market integration of shallot in Indonesia. Jurnal Manajemen & Agribisnis, 15(3): 258-268. https://doi.org/10.17358/jma.15.3.258
[8] Saptana, S., Susilowati, S.H. (2018). Spatial market integration and price transmission of meat in Indonesia. Agricultural and Resource Economics: International Scientific E-Journal, 4(4): 1-10. https://ageconsearch.umn.edu/record/277371.
[9] Varela, G., Aldaz-Carroll, E., Iacovone, L. (2012). Determinants of market integration and price transmission in Indonesia. The World Bank. Policy Research Working Paper, No. 6098. https://openknowledge.worldbank.org/handle/10986/12158.
[10] Firmansyah, M.P., Harahap, A. (2023). Analysis of beef market integration between consumer and producer regions in Indonesia. Open Agriculture, 8(1): 20220221. https://doi.org/10.1515/opag-2022-0221
[11] Shaffitri, L.R., Suryana, E.A., Sinuraya, J.F. (2024). Market integration and rice price transmission in Indonesia. BIO Web of Conferences, 119: 02007. https://doi.org/10.1051/bioconf/202411902007
[12] Nasir, M.A., Jamhari, J., Mulyo, J.H., Dumasari, D. (2021). Spatial study on how COVID-19 affects the Indonesian rice markets integration: Period of March to July 2020. Review of International Geographical Education Online, 11(4): 672-683. https://doi.org/10.33403/rigeo.8006781
[13] Abate, G.T., de Brauw, A., Hirvonen, K., Abay, K.A. (2023). Spatial market integration during a pandemic: Evidence from food markets in Sub-Saharan Africa. Agricultural Economics, 54(1): 3-17. https://doi.org/10.1111/agec.12809
[14] Yin, F., Qian, Y., Zeng, J., Wei, X. (2024). The spatial spillover effects of transportation infrastructure on regional economic growth: An empirical study at the provincial level in China. Sustainability, 16(19): 8689. https://doi.org/10.3390/su16198689
[15] Benassai-Dalmau, R., Voukelatou, V., Schifanella, R., Fiandrino, S., Paolotti, D., Kalimeri, K. (2025). Unequal journeys to food markets: Continental-scale evidence from open data in Africa. arXiv Preprint arXiv: 2505.07913. https://arxiv.org/abs/2505.07913.
[16] Boubou, Y., Fastner, K., Buerkert, A. (2025). Rural-urban transformation shapes oasis agriculture in Morocco’s High Atlas Mountains. Scientific Reports, 15(1): 3433. https://doi.org/10.1038/s41598-024-81569-7
[17] Zhang, S., Zhao, J., Jiang, Y., Cheshmehzangi, A., Zhou, W. (2023). Assessing the rural–urban transition of China during 1980-2020 from a coordination perspective. Land, 12(6): 1175. https://doi.org/10.3390/land12061175
[18] Mwangi, V., Owuor, S., Kiteme, B., Giger, M. (2021). Assessing smallholder farmer's participation in the wheat value chain in north-west Mt. Kenya. Frontiers in Sustainable Food Systems, 5: 657744. https://doi.org/10.3389/fsufs.2021.657744
[19] Woodhill, J., Hasnain, S., Griffith, A. (2020). Farmers and food systems: What future for small-scale agriculture? University of Oxford. Environmental Change Institute.
[20] Jagwe, J., Machethe, C., Ouma, E. (2010). Transaction costs and smallholder farmers' participation in banana markets in the great lakes region of Burundi, Rwanda and the democratic republic of Congo. African Journal of Agricultural and Resource Economics, 6(1): 302-317.
[21] Aqidah, L. (2024). Analysis of red shallot price volatility in Probolinggo, East Java. Journal of Agribusiness and Rural Development, 15(2): 98-107. https://doi.org/10.1234/jard.2024.15209
[22] Gumilar, T.S., Maswadi, M., Fitrianti, W., Yurisinthae, E., Suharyani, A. (2023). Shallot supply chain with food supply chain networks approach in Pontianak. E3S Web of Conferences, 373: 04027. https://doi.org/10.1051/e3sconf/202337304027
[23] Saptana, Gunawan, E., Perwita, A.D., Sukmaya, S.G., Darwis, V., Ariningsih, E., Ashari. (2021). The competitiveness analysis of shallot in Indonesia: A policy analysis matrix. PLoS ONE, 16(9): e0256832. https://doi.org/10.1371/journal.pone.0256832
[24] Trisnasari, W., Marimin, M., Perdana, T., Deliana, Y. (2020). Situational analysis of shallot supply chain innovation system: A case study of Majalengka-Indonesia. International Journal of Supply Chain Management, 9(3). https://doi.org/10.59160/ijscm.v9i3.3383
[25] Widianarko, B., Hantoro, I., Putri, N.I., Nugrahedi, P.Y. (2025). Transforming food systems in Semarang City, Indonesia: A short food supply chain model. Open Agriculture, 10(1): 20250440. https://doi.org/10.1515/opag-2025-0440
[26] Amruddin, A., Said, S.A., Rosalia, O., Firayani, F., Noviya, A. (2025). Supply chain management in agribusiness: Efficiency and sustainability strategies. Maneggio, 2(1): 246-257. https://doi.org/10.62872/49fg5a93
[27] Relawati, R., Milla, A.N., Nur, M. (2024). Concept of organic foods supply chain management in Indonesia: A review article. BIO Web of Conferences, 143: 01016. https://doi.org/10.1051/bioconf/202414301016
[28] Srinatha, T.N., Hemanth, D.B., Praveenkumar, A., Jagadeesh, M.S., Ravi, S.C., Baruah, D., Ray, I., Kumar, P. (2024). Asymmetric price transmission in agricultural markets: A case of chickpea’s in south India. Journal of Scientific Research and Reports, 30(9): 685-693. https://doi.org/10.9734/jsrr/2024/v30i92396
[29] Waiswa, D., Yavuz, F. (2023). Market integration and asymmetric price transmission in selected domestic markets for major staple foods in Uganda. Future Business Journal, 9(1): 97. https://doi.org/10.1186/s43093-023-00281-6
[30] Yildiz, M., Yilmaz, H. (2025). Asymmetric effects of agricultural input prices on farmgate prices in Türkiye. Agricultural Economics Research Review, 38(1): 45-56.
[31] Zanin, V., Tonin, J.M., Halmenschlager, V. (2020). Asymmetric price transmission in the commercialization of rice in Brazil. Italian Review of Agricultural Economics (REA), 75(1): 19-35. https://doi.org/10.13128/rea-11739
[32] Lence, S.H., Moschini, G., Santeramo, F.G. (2018). Threshold cointegration and spatial price transmission when expectations matter. Agricultural Economics, 49(1): 25-39. https://doi.org/10.1111/agec.12393
[33] Hahn, W.F., Stewart, H., Blayney, D.P., Davis, C.G. (2016). Modeling price transmission between farm and retail prices: A soft switches approach. Agricultural Economics, 47(2): 193-203. https://doi.org/10.1111/agec.12222
[34] Alam, M.J., McKenzie, A.M., Begum, I.A., Buysse, J., Wailes, E.J., Sarkar, M.A.R., Al Mamun, A., Van Huylenbroeck, G. (2022). Spatial market integration of rice in Bangladesh in the presence of transaction costs. Agricultural and Food Economics, 10(1): 20. https://doi.org/10.1186/s40100-022-00228-5
[35] Habte, Z.H. (2024). Spatial and vertical market integration and price transmission in the Ethiopian banana supply chain. Asian Journal of Economics and Finance, 6(1): 67-85. https://doi.org/10.47509/AJEF.2024.v06i01.04
[36] Paul, R.K., Sinha, K. (2022). Asymmetric price transmission: A case of wheat in India. Agriculture, 12(4): 410. https://doi.org/10.3390/agriculture12040410
[37] Baquedano, F.G., Liefert, W.M. (2014). Market integration and price transmission in consumer markets of developing countries. Food Policy, 44: 103-114. https://doi.org/10.1016/j.foodpol.2013.11.001
[38] Alege, A.M., Jirgi, A.J., Tanko, L., Ndanitsa, M.A. (2021). Assessment of price transmission mechanisms of cassava in rural and urban markets of Benue State, Nigeria. Journal of Agripreneurship and Sustainable Development, 4(1): 78-85.
[39] Lamarana, B.L., Mohammed, S.Y., Hamidu, K., Taru, B. (2025). Market integration analyses of cowpea (Vigna unguiculata [L.] Walp) in selected local government areas of Gombe State, Nigeria. Nigerian Journal of Agriculture and Agricultural Technology, 5(1A): 216-222. https://doi.org/10.59331/njaat.v5i1A.986
[40] Baulch, B., Vu, T.T. (2007). The spatial integration of paddy markets in Vietnam. Journal of Agricultural Economics, 58(2): 269-288.
[41] Kebede, H.A. (2021). The gains from market integration: The welfare effects of new rural roads in Ethiopia. Working Paper.
[42] Alege, P.O., Adediran, O.S., Ogundipe, A.A. (2016). Pollutant emissions, energy consumption and economic growth in Nigeria: A multivariate granger causality framework. International Journal of Energy Economics and Policy, 6(2): 202-207. https://www.econjournals.com/index.php/ijeep/article/view/1441.
[43] Kassouri, Y., Fofana, N.Z.F. (2025). Spatial price integration and spillover linkages between regional grain markets in Nigeria. Review of Development Economics. https://doi.org/10.1111/rode.13190
[44] Baulch, B., Vu, H.D. (2010). Poverty dynamics in Vietnam, 2002-2006. The World Bank Group. Report, No. 27728. https://ideas.repec.org/p/wbk/wboper/27728.html.
[45] Shikur, Z.H. (2023). Assessment of the relationships between livestock production policies implementation and knowledge integration for the promotion of food security in Ethiopia. Cogent Food & Agriculture, 9(1): 2249038. https://doi.org/10.1080/23311932.2023.2249038
[46] Arida, A., Masbar, R., Majid, M., Indra, I. (2023). Does vertical asymmetric price transmission exist in the rice markets?. Agricultural and Resource Economics: International Scientific E-Journal, 9(1): 69-90. https://doi.org/10.22004/ag.econ.337424
[47] Barboza Martignone, G., Paparas, D., Behrendt, K. (2023). Asymmetric price transmission analysis of the international soybean market. Agricultural Sciences, 14(3): 317-334. https://doi.org/10.4236/as.2023.143020