Vincentius Rachmadi Parmono![]() | Yerik Afrianto Singgalen*
| Yerik Afrianto Singgalen*![]()
© 2025 The authors. This article is published by IIETA and is licensed under the CC BY 4.0 license (http://creativecommons.org/licenses/by/4.0/).
OPEN ACCESS
Urban expansion in BSD City, Indonesia, has generated major environmental and behavioral shifts. This study employed Landsat 8 surface reflectance imagery (2020–2023) and spatial statistics to assess vegetation cover, built-up growth, land surface temperature (LST), and consumer demand for eco-friendly housing. Preprocessing included atmospheric correction, emissivity adjustment, and cloud masking, while indices were validated with high-resolution imagery to ensure accuracy. NDVI values ranged from –0.125 to 0.375 (peak 0.188), NDBI from –0.219 to 0.094 (peak –0.063), and the Urban Index from 0.188 to 0.500 (peak 0.375), indicating compact urban development with stressed vegetation. LST ranged between 32–68℃, with a dominant mode at 40℃, revealing thermal stress concentrated in urban cores. Spatial heterogeneity was confirmed through coefficient of variation (NDVI max 0.625), Moran’s I (–0.004 to 0.016), and Gi* hotspots (–2.0 to 1.75). Geographically Weighted Regression (GWR) showed localized associations between vegetation decline, built-up intensity, and LST anomalies. Annual reports suggested eco-branding strategies were most effective in greener and cooler districts, linking environmental attributes with housing demand. Findings should be interpreted cautiously since consumer data were aggregated and lacked neighborhood-scale resolution. The study highlights the role of integrating remote sensing, spatial modelling, and behavioral insights in guiding sustainable urban planning and eco-oriented marketing.
sustainable urban planning, geo-informatics, urban heat island, spatial heterogeneity, consumer preferences, sustainable marketing, eco-branding
Urbanization is widely recognized as the primary driver of environmental change in rapidly developing regions. The expansion of built-up areas directly reduces vegetation cover, leading to fragmentation and ecological stress [1]. This process intensifies the vulnerability of tropical metropolitan areas to rising temperatures and the decline of ecosystem services [2]. Scholars argue that rapid urban development is often correlated with increased environmental degradation and social challenges [3, 4]. This link illustrates how urban growth acts as both an economic driver and an environmental risk factor. Therefore, evaluating the impacts of urbanization is fundamental for ensuring sustainable urban planning.
Remote sensing has emerged as an indispensable tool for analyzing changes in the urban environment. Vegetation indices, such as the Normalized Difference Vegetation Index (NDVI), are extensively used to monitor ecosystem health and detect patterns of green cover loss [5]. Built-up indicators, such as the Normalized Difference Built-up Index (NDBI) [6] and the Modified Normalized Difference Water Index (MNDWI) provide insights into land conversion and water dynamics [7]. The remote sensing approach enables a thorough evaluation of the ecological effects of urban development. In addition, the methodological integration of remote sensing enhances the spatial understanding of urban transformation. Therefore, remote sensing provides a scientific foundation for evidence-based planning and environmental management.
The UHI phenomenon represents one of the most critical environmental consequences of land-cover modification. Impervious surfaces trap and re-emit heat, generating higher land surface temperatures than those of surrounding non-urban areas [8]. The UHI anomaly diminishes outdoor comfort and increases the energy demand for cooling systems [9]. Strong associations between UHI intensity and public health risks, such as heat-related illnesses, have been consistently reported. Quantification of temperature variation is vital for understanding urban sustainability challenges. The land surface temperature derived from satellite images is a vital signifier in environmental planning processes.
Complex spatial heterogeneity characterizes urban environments that require localized analysis. Conventional global or regional models often overlook fine-scale vegetation, urban density, and thermal patterns variations. GWR offers a robust framework for capturing local differences within broader urban systems [10, 11]. GWR identifies clusters, hotspots, and gradients with greater accuracy by integrating spatial autocorrelation [12]. The analytical capacity improves decision-making by highlighting context-specific drivers of environmental change. Therefore, GWR strengthens the integration of geo-informatics into SUD.
BSD City in Banten Province, Indonesia, exemplifies rapid urban transformation within the Jakarta metropolitan area. Planned as a satellite city, BSD has expanded by converting agricultural and natural landscapes into residential and commercial complexes [13]. The expansion introduces significant ecological pressures, including vegetation reduction and increased heat stress [14]. Given its strategic metropolitan role, BSD is a critical case study for analyzing urban spatial patterns. Investigating its dynamics provides insights into local and regional sustainability issues. As such, BSD City is a valuable laboratory for testing remote sensing and GWR applications.
The methodological framework is based on established approaches in remote sensing and urban analysis. Studies on land surface temperature retrieval and urban heat island impacts form a solid base for this investigation [15]. The geographically weighted regression's conceptual background enhances the analytical design by facilitating the identification of local spatial differences [16]. Previous research on hedonic pricing and environmental amenities underscores the significance of correlating ecological characteristics with market outcomes in terms of consumer behavior and housing requirements [17-20]. Current uses of spatial regression in urban climate research highlight the merging of environmental and socio-economic factors. Including these viewpoints strengthens the study's theoretical soundness and places it within the context of both traditional and modern scientific discussion.
The trajectory of urban development in planned townships like BSD City is increasingly influenced by consumer preferences. Consumer buying habits are increasingly affected not only by factors like accessibility and infrastructure, but also by environmental concerns and brand stories. Eco-branding, a marketing approach that focuses on environmentally friendly living, thermal comfort, and sustainable surroundings, has a substantial impact on consumer purchasing decisions. Marketing approaches that emphasise ecological benefits strongly appeal to the expectations of environmentally aware consumers. Combining these dimensions with spatial analysis offers a chance to link environmental facts with market trends. As a result, sustainable marketing strategies are seen as both a motivator of consumer choice and a complement to sustainable urban planning.
This investigation examines the spatial variability of vegetation, built-up land, and thermal conditions in BSD City over the period of 2020 to 2023. The indices, including NDVI, NDBI, MNDWI, the urban index, and land surface temperature, are applied to evaluate ecological and urban conditions. Statistics that deal with spatial data, including Moran's I, Geographically Weighted Hotspots, local variance, and Coefficient of Variation, help identify clustering and fragmentation patterns. A gradient analysis was conducted in order to capture transitional boundaries within ecological and urban landscapes. The examination also included consumer preferences and eco-branding strategies in order to associate environmental attributes with sustainable marketing methods. In conclusion, this research further develops the function of geo-informatics in facilitating both sustainable urban growth and environmentally responsible consumer actions.
BSD City is a planned urban township in South Tangerang, Banten Province, covering an area of 6000 hectares within the Jakarta Metropolitan Region. The housing development plays a crucial role in meeting the demands of growing populations and providing suitable housing [21]. Continuous land use conversion has been ongoing in the city, resulting in agricultural areas being transformed into residential and commercial zones. Planners have designed major infrastructure projects to incorporate mixed-use complexes within the central zone itself [22]. These initiatives had a significant impact on the spatial arrangement of cities and ecosystems. BSD City serves as a dynamic setting for tracking changes in land cover and spatial variations.
The city's rapid expansion has been accompanied by substantial growth in economic value and physical assets. Significant areas of land have been designated for development, illustrating the ongoing transformation of peri-urban environments. The expansion has resulted in a decrease of green cover and fragmentation of the ecological areas. Indices obtained through remote sensing, like the NDVI and NDBI, are vital for consistently measuring alterations. Decreasing NDVI values point to the strain being placed on vegetation, whereas rising NDBI values support the expansion of impervious surfaces. The study area therefore offers a suitable environment for evaluating ecological stress associated with urban expansion.
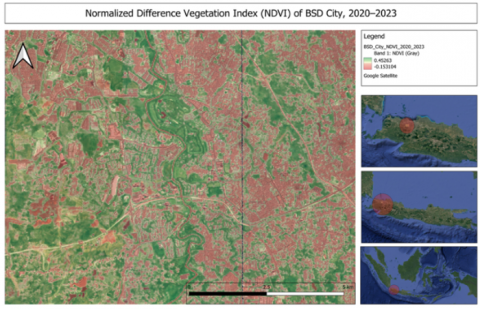
Figure 1. Spatial distribution of vegetation in BSD City derived from the Normalized Difference Vegetation Index (NDVI) for the period 2020–2023
Source: Processed from Landsat 8 imagery (2020–2023) using Google Earth Engine and visualized with QGIS.
Figure 1 shows the spatial distribution of vegetation in BSD City as indicated by NDVI values for the period 2020–2023. BSD City's tropical monsoon climate makes it extremely vulnerable to surface heating due to urbanisation. Built-up intensity has significantly increased the urban heat island effect, with developed areas showing notably higher land surface temperatures. Thermal band data from remote sensing enable the precise mapping of these thermal anomalies. Combining LST analysis with vegetation and urban indices offers insights into localized heating processes. This relationship highlights the dual challenges of urban expansion and environmental sustainability. Therefore, BSD emphasizes the significance of thermal monitoring in urban planning strategies.
Variations in the central and peripheral areas give rise to spatial heterogeneity within BSD City. The urban center is characterised by high-density constructions, in contrast, the peripheral zones preserve agricultural and vegetated land. New residential and commercial projects are now predominantly straining the surrounding areas. The fragmented land-use structure can be effectively analyzed using the COV and local variance. These spatial statistics aid in capturing local variations in ecological stability and resilience. The city thus serves as an optimal example for assessing transformations between natural and metropolitan settings.
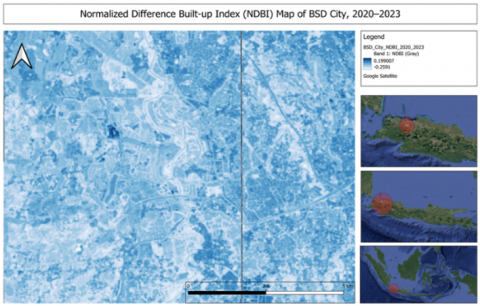
Figure 2. Spatial distribution of built-up density in BSD City derived from the Normalized Difference Built-up Index (NDBI) for the period 2020–2023
Source: Processed from Landsat 8 imagery (2020–2023) using Google Earth Engine and visualized with QGIS.
Figure 2 shows the spatial distribution of built-up density in BSD City as indicated by NDBI values for the period 2020–2023, processed from Landsat 8 imagery using Google Earth Engine and visualized with QGIS. The spatial layout of BSD City is designed to accommodate complex spatial statistical analysis. The Local Moran's I statistic is employed to identify areas of vegetation decline and clusters of urban development. A hotspot analysis revealed substantial concentrations of developed areas and nascent thermal hotspots. Gradient analysis emphasizes the steepness of ecological-urban transitions, whereas distance-based measures focus on compactness near the city's center. These methods expose the interaction between urban expansion and diverse levels of environmental pressure. Consequently, spatial statistical tools are crucial for comprehending the intricate urban dynamics of BSD City.
In summary, BSD City embodies the integration of structured urban development, economic growth, and environmentally conscious initiatives. RSIs combined with ground water recharge provide a framework for analysing the local impacts of development. Economic indicators are consistent with the expansion of an urban footprint, illustrating a connection between financial growth and varying spatial conditions. Incorporating sustainability principles at the same time has helped to balance development with the need for ecological resilience. BSD City serves as a model for urban development and a proving ground for sustainable urban planning strategies. Therefore, this area is highly significant for developing geo-informatics applications in environmental management and spatial planning.
The research used a dual methodology that integrated satellite imagery with additional secondary data sources. Images retrieved from 2020 to 2023 using the Google Earth Engine include those from the Landsat 8 Operational Land Imager (OLI) and Thermal Infrared Sensor (TIRS) [23]. The imagery provided consistent temporal coverage for mapping land cover and tracking thermal changes [24, 25]. Data from secondary sources were collected from the BSD City Annual Reports for the years 2020 and 2024. The reports encompassed financial indicators, land development scope, and sustainable initiatives. Integrating spatial and corporate data enabled a comprehensive approach to examining urban environments.
The initial processing of satellite images was conducted to guarantee the quality and homogeneity of the data. Cloud masking and atmospheric correction procedures led to a decrease in noise and inaccuracy levels. Digital numbers were converted through radiometric calibration to obtain surface reflectance values. The imagery was confined to the administrative limits of BSD City in order to increase its spatial importance. The study excluded scenes with more than 15% cloud cover. The actions taken resulted in the development of reliable datasets, which can be used in subsequent calculations of indices and thermal variables.
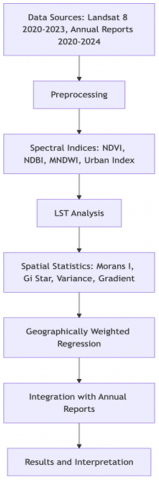
Figure 3. Workflow of data collection, preprocessing, and spatial analysis integrating Landsat 8 (2020–2023) and Annual Reports (2020–2024) for the assessment of urban-environmental heterogeneity in BSD City
Source: Constructed by the authors based on the research workflow.
Figure 3 shows the workflow of data collection, preprocessing, and spatial analysis that integrates Landsat 8 imagery (2020–2023) with Annual Reports (2020–2024) for assessing urban-environmental heterogeneity in BSD City. Indices derived from Landsat imagery included four, representing ecological and urban conditions. NDVI was used to assess vegetation health, whereas NDBI was employed to detect impervious surfaces. The MNDWI provided information on the distribution of surface water and its displacement resulting from urbanization. An Urban Index was also created to measure the relationship between vegetation loss and urban development expansion. Together, these indices provide a comprehensive view of land transformation in BSD City. They served as the main dataset for environmental monitoring purposes.
The urban index was used as the dependent variable in the GWR model, with NDVI, NDBI, MNDWI, and LST as predictor variables. A fixed Gaussian kernel with a bandwidth of 300 m was applied, and the corrected AICc was minimized to optimize the bandwidth. To ensure independence among explanatory variables, multicollinearity diagnostics were conducted using variance-invariant factor analysis. Model performance was assessed using local and global R² values and AICc scores, which provided model fit indicators. The residual spatial autocorrelation was examined using Moran's I to verify the absence of spatial clustering in the residuals. This setup enhanced the regression robustness and improved the interpretability of local parameter estimates.
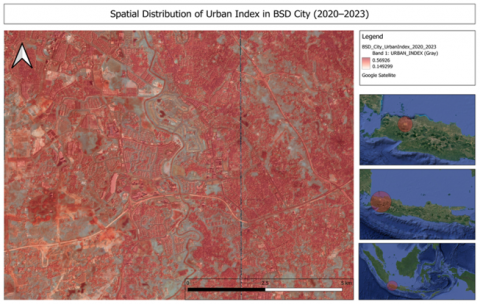
Figure 4. Urban Index map of BSD City generated from Landsat 8 imagery (2020–2023) for methodological illustration
Source: Processed from Landsat 8 OLI/TIRS surface reflectance imagery (2020–2023) using Google Earth Engine and visualized in QGIS.
Figure 4 shows the Urban Index map of BSD City generated from Landsat 8 imagery (2020–2023) as a methodological illustration. The LST was measured using the ST_B10 thermal band from the Level-2 dataset of Landsat 8 Collection 2. The surface reflectance product already incorporated atmospheric correction through the LaSRC algorithm, while cloud contamination was mitigated using the QA band filtering. The brightness temperature was converted into LST values by applying a radiometric rescaling factor (0.00341802) and additive constant (149.0), followed by the conversion of Kelvin to Celsius. Emissivity adjustments were derived from the NDVI threshold methods to differentiate between vegetated and impervious surfaces. The procedure was carried out within the GEE environment to guarantee standard atmospheric correction and the parameterization of emissivity. The adopted workflow reduced noise and allowed the LST dataset to be reproducible across the study period.
Thermal data from Landsat's band ST_B10 were utilised to calculate the Land Surface Temperature (LST). The data were converted into Celsius by applying standard calibration and correction formulas. The LST values were used as indicators of the intensity of the urban heat island within the study area. Analyzing correlations with NDVI and NDBI revealed trade-offs between declining vegetation and rising temperatures. The integration highlighted areas where heat stress is occurring due to the rapid expansion of cities. Therefore, LST offers a crucial aspect for assessing sustainability.
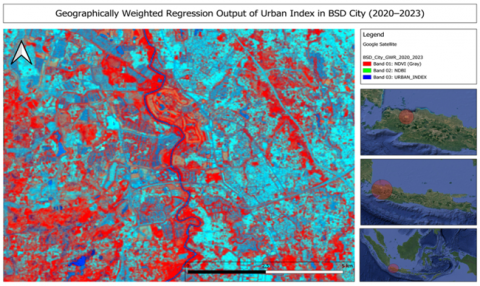
Figure 5. Geographically Weighted Regression (GWR) results for the Urban Index in BSD City (2020–2023) for methodological illustration
Source: Processed from Landsat 8 OLI/TIRS surface reflectance imagery (2020–2023) using Google Earth Engine and visualized in QGIS.
Figure 5 shows the Geographically Weighted Regression (GWR) results for the Urban Index in BSD City (2020–2023) as a methodological illustration. A number of spatial statistics were used to investigate heterogeneity and clustering. Spatial correlation between vegetation and urban indices was detected using Local Moran's I. The Gi* statistic pinpointed notable areas of both urban growth and ecological strain. The coefficient of variation, representing local variance, assesses ecological characteristics. Analyses of gradient and distance-from-center patterns revealed compactness in urban areas. These spatial methods captured detailed variation across BSD City. As a result, they reinforced the interpretation of urban-environmental dynamics.
The analysis of spatial variability in relationships among variables was conducted with Geographically Weighted Regression. The Urban Index was used as the dependent variable, with NDVI, NDBI, MNDWI, and LST functioning as independent predictor variables. The study area was analyzed using a fixed spatial kernel to calculate local coefficients. The outputs included parameter surfaces that highlighted spatial heterogeneity. The GWR findings were linked with Annual Report data, thereby situating the results within the context of economic growth and sustainability agendas. The methodological framework therefore offered a robust integration of spatial evidence and planning realities.
Validation of NDVI, NDBI, and MNDWI calculations was performed using high-resolution Sentinel-2 imagery and Google Earth reference data from 2020 to 2023. Points were randomly selected within the study area and then verified against reference images through visual inspection. The accuracy of classification was measured using an error matrix, which yielded overall accuracy rates exceeding 85% and Kappa statistics higher than 0.70. This confirmed the reliability of spectral indices for representing vegetation, built-up, and water features. Further examination of local variance and coefficient of variation calculations was conducted to minimize scale dependency errors. These steps ensured that spatial metrics derived from Landsat imagery were valid and reproducible for use in subsequent statistical analyses.
The analytical workflow was fully implemented within the GEE platform to guarantee transparency and reproducibility. All codes applied for image preprocessing, index derivation, spatial statistics, and GWR analysis were created within the GEE environment. The outputs were exported in both CSV and GeoTIFF formats, allowing for tabular samples and raster layers, and subsequent validation using external GIS software. Enabling code-based analysis and cloud processing allows the research to be re-run at any time under identical circumstances. Standardized satellite archives guarantee the reproducibility of the datasets in question. This approach guarantees that data and methods can be replicated, thereby meeting the fundamental prerequisites for scientific robustness.
The study's findings are presented in two accompanying sections to offer a complete insight into urban–environmental dynamics in BSD City. The initial section employs spectral indices and spatial statistics to concentrate on the spatial distribution of vegetation cover, urban areas, and land surface temperature. The descriptive analysis reveals clustering patterns, hotspots, and fragmentation, effectively capturing the essential characteristics of urbanization and ecological transformation. The second section employs GWR to examine localised connections between environmental factors and urban growth. The analysis combines descriptive and explanatory methods, showing the patterns and processes behind spatial heterogeneity. These results therefore highlight their significance for sustainable urban planning and environmental management.
4.1 Spatial patterns of vegetation, built-up areas, and land surface temperature
The spatial distribution of vegetation in BSD City demonstrates clear signs of ecological pressure during the period 2020–2023. NDVI values ranged between –0.125 and 0.375, with the highest frequency occurring around 0.188. The pattern indicates moderate vegetation cover dominated by fragmented green spaces rather than continuous patches. Urban expansion has progressively reduced natural vegetation and agricultural land, concentrating green cover in peripheral zones. Such conditions suggest that urban growth is occurring at the expense of ecological resilience. Therefore, NDVI confirms the decline of vegetation in BSD City under rapid urbanization.
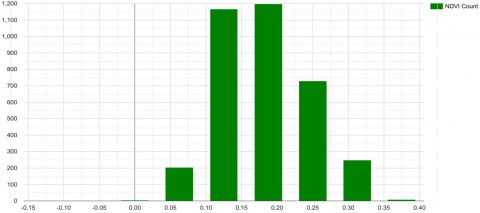
Figure 6 shows the NDVI distribution in BSD City for the period 2020–2023, reflecting mixed-pixel conditions from Landsat 8 imagery at 30 m resolution. In BSD City, the relatively low maximum NDVI value of 0.375 is attributed to the growing prevalence of impervious surfaces, which have increasingly replaced vegetated and agricultural land. Vegetation in dense forests is generally confined to isolated areas near the forest perimeters, which leads to a reduced chance of higher NDVI values. High LST values, reaching as high as 68℃, likely point to variations in emissivity and localised impervious heat storage within densely populated urban areas. The extreme values correspond to thermal anomalies seen in other tropical cities, primarily because of uncertainties in atmospheric and emissivity values. Peak temperatures in moderate land surface temperatures (LST) reach approximately 40℃, indicating more realistic surface heating levels that were prevalent throughout the study area. The clarification emphasizes that the results consider both methodological limitations and the actual degree of urban ecological stress.
Figure 6. NDVI distribution (Data: 2020-2023)
Source: Processed from Landsat 8 imagery in Google Earth Engine. Values reflect mixed-pixel conditions due to 30 m resolution, which may reduce the upper range of vegetation index values in fragmented peri-urban areas.
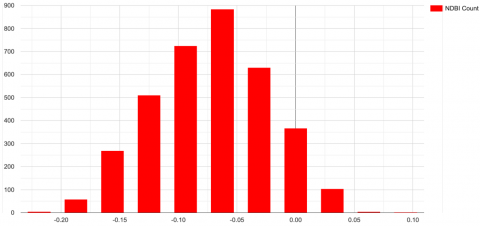
Figure 7. NDBI distribution (Data: 2020-2023)
Source: Derived from Landsat 8 reflectance data using Google Earth Engine. Higher values indicate impervious surfaces, while moderate ranges may be influenced by transitional zones and resolution-induced spectral mixing.
Figure 7 shows the NDBI distribution in BSD City for the period 2020–2023, highlighting impervious surfaces and transitional zones influenced by spectral mixing. The built-up environment is represented by the Normalized Difference Built-up Index (NDBI). The values varied from -0.219 to 0.094, with the highest frequency at -0.063. The predominance of negative to low-positive values reflects a mixture of semi-developed land and dense built-up cores. Clusters of high NDBI values were identified in the central business districts and planned residential complexes. These areas draw attention to the concentration of impervious surfaces causing ecological transformation. The data from NDBI indicate a rise in the built-up density within BSD City.
The measured NDVI values, reaching up to 0.375, suggest that impervious surfaces predominate in BSD City and are constrained by a 30 m spatial resolution. Mixed pixels in peri-urban zones can weaken vegetation signals, leading to a reduced maximum NDVI compared with dense forest ecosystems. Extreme LST values above 60℃ are also attributed to heterogeneity in emissivity, residual atmospheric impacts, and localized heat retention by impervious surfaces. These outliers may not be indicative of actual ground-level air temperature, but they do illustrate the thermal stress found in densely populated city centres. A 300 m kernel radius was selected to strike a balance between capturing local variation and ensuring statistical stability in spatial diagnostics. These clarifications take into account methodological limitations and still confirm that the overall spatial patterns remain consistent with urban ecological stress.
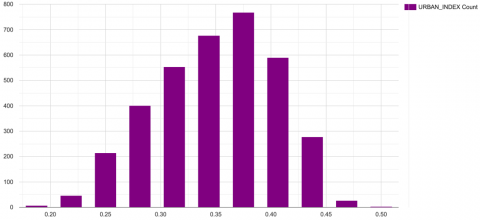
Figure 8 shows the Urban Index distribution in BSD City for the period 2020–2023, calculated from Landsat 8 imagery. The Urban Index, developed as a composite measure of vegetation decline and built-up expansion, revealed strong patterns of land conversion. Index values spanned a range of 0.188 to 0.500, with the highest frequency occurring at 0.375. Higher values were consistently concentrated in central zones, corresponding with compact urban growth. Peripheral areas recorded lower values, reflecting transitional landscapes where vegetation still persists. This gradient illustrates how urban growth radiates outward from the core of BSD City. Thus, the Urban Index confirms the duality of compact urban development and peri-urban transition.
Figure 8. Urban Index distribution (Data: 2020-2023)
Source: Calculated from Landsat 8 imagery (2020–2023) using Google Earth Engine.
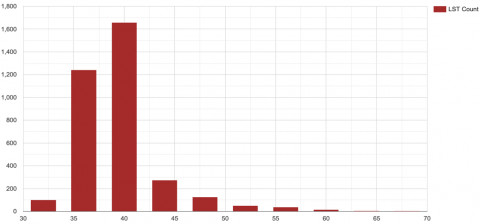
Figure 9 shows the temperature distribution in BSD City for the period 2020–2023, derived from Landsat 8 thermal band (ST_B10) with radiometric calibration and emissivity adjustment. Thermal analysis highlighted the emergence of Urban Heat Island conditions within the study area. Land Surface Temperature (LST) ranged between 32℃ and 68℃, with the most frequent occurrence at 40℃. Hotspots of elevated temperature corresponded closely with areas of high built-up density. Conversely, patches with moderate to low temperatures aligned with remaining vegetated zones. This spatial correlation emphasizes the link between impervious surfaces and surface heating. Consequently, LST reinforces the significance of thermal stress as a by-product of urban expansion.
Figure 9. Temperature distribution (Data: 2020-2023)
Source: Calculated from Landsat 8 thermal band (ST_B10) with radiometric calibration and emissivity adjustment. Extreme values may reflect emissivity heterogeneity and impervious heat retention rather than ambient air temperature.
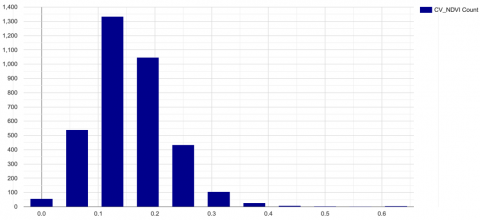
Measures of spatial heterogeneity provided deeper insights into ecological fragmentation. The coefficient of variation for NDVI reached a maximum of 0.625, peaking at 0.125, highlighting uneven vegetation distribution. Local variance of NDVI recorded a maximum of 0.014, confirming fragmentation of ecological patches. Local Moran’s I values ranged from –0.004 to 0.016, with the peak at 0.000, indicating clustering of urban–ecological contrasts. These findings demonstrate that spatial autocorrelation is weak at the global scale but significant at local scales. Therefore, spatial statistics underscore the fragmented nature of BSD City’s landscape.
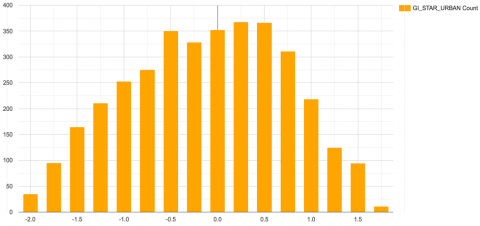
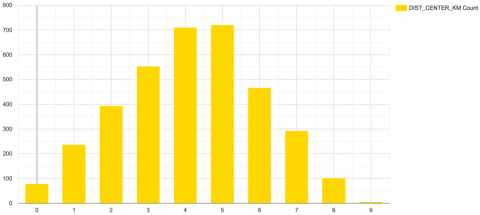
Figure 10 shows the distribution of Gi* Hotspots in BSD City for the period 2020–2023, computed from NDVI and the Urban Index using spatial statistics in Google Earth Engine. Hotspot analysis using the Gi* statistic identified zones of statistically significant clustering. Values ranged between –2.0 and 1.75, peaking at 0.25, with positive hotspots aligned to dense urban cores. Negative clusters corresponded to peripheral vegetated areas, showing clear spatial polarization. Results from a gradient analysis showed significant transitions between green and urban areas. A distance-from-center analysis verified the compactness of development, with peak activity centred within five kilometres of the urban core. Taken together, these spatial statistics demonstrate the uneven and varied nature of urban growth in BSD City.
Figure 10. Distribution of Gi* Hotspot (Data: 2020-2023)
Source: Computed from NDVI and Urban Index using Gi* spatial statistics in Google Earth Engine. Hotspots represent statistically significant clustering; results should be interpreted with caution due to kernel size effects.
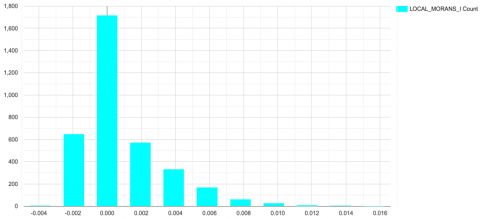
Figure 11. Local Moran’s I (Data: 2020-2023)
Source: Generated from Urban Index in Google Earth Engine. Clusters of positive and negative spatial autocorrelation highlight local anomalies, but values remain sensitive to scale and spatial resolution.
Figure 11 shows the Local Moran’s I results for BSD City (2020–2023), generated from the Urban Index to highlight clusters of positive and negative spatial autocorrelation. The results of a Local Moran’s I spatial autocorrelation analysis indicated significant clustering patterns in BSD City. Areas with high or low urban index values show similar patterns when Positive Moran’s I values are present, indicating a lack of spatial variability. In contrast, small clusters with negative values indicated the presence of local anomalies, where urban density diverged from surrounding regions. Urbanization in BSD City is not a uniform process; instead, it manifests as distinct development clusters. The presence of such clustered dynamics reinforces the evidence for polycentric growth within the township. Moran's I thus confirmed the spatially dependent nature of urban expansion within the study area.
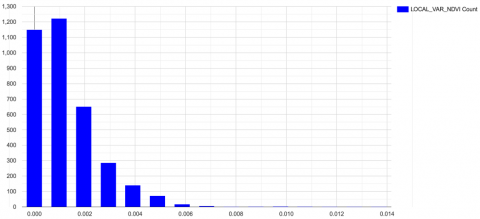
Figure 12 shows the local variance of NDVI in BSD City for the period 2020–2023, calculated from Landsat 8 imagery using Google Earth Engine. Examinations of NDVI, NDBI, Urban Index, LST, Gi* Hotspot, and Local Moran's I indicate the intricate complexity of urban–environmental interactions within BSD City. The research suggests that urbanisation is characterised by the decline of vegetation, growing built-up areas, and increasing surface temperatures, which collectively give rise to the formation of clustered spatial configurations. These descriptive analyses provide a basic comprehension of urban growth patterns, but fail to adequately capture the varied strengths of relationships within specific locations. Geographically Weighted Regression (GWR) was utilised to address this constraint and examine spatial variability throughout the study area [26]. The model enables a more in-depth analysis of the impact of environmental factors on the Urban Index in different spatial contexts [27, 28]. This section delves into spatially varying relationships and provides more in-depth insights into localised urban processes.
Figure 12. Local variance NDVI (Data: 2020-2023)
Source: Calculated from Landsat 8 imagery (2020–2023) using Google Earth Engine.
4.2 Spatial heterogeneity and geographically weighted regression analysis
Geographically Weighted Regression (GWR) was used to assess the localized relationships between environmental variables and the Urban Index. The Urban Index was used as the dependent variable, while NDVI, NDBI, MNDWI, and LST served as independent predictors. This approach enabled the detection of spatial heterogeneity, which is often overlooked in global regression models. Results demonstrated significant variation in parameter estimates across BSD City. Areas of compact urbanization exhibited stronger coefficients compared to transitional peri-urban zones. Therefore, GWR highlighted the non-stationary nature of urban–environmental interactions.
Figure 13. Coefficient of variation (Data: 2020-2023)
Source: Calculated from Landsat 8 imagery (2020–2023) using Google Earth Engine.
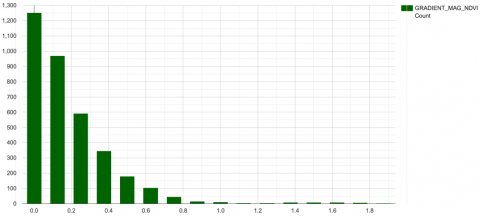
Figure 14. NDVI gradients (Data: 2020-2023)
Source: Calculated from Landsat 8 imagery (2020–2023) using Google Earth Engine.
Figure 13 shows the coefficient of variation in BSD City for the period 2020–2023, calculated from Landsat 8 imagery using Google Earth Engine. The relationship between NDVI and the Urban Index was consistently negative, confirming that vegetation decline is strongly associated with urban growth. Coefficient values were lower in peripheral areas, where vegetation remained more intact. In contrast, central zones displayed stronger negative associations, reflecting a substantial loss of green cover. In addition, Figure 14 shows the NDVI gradients in BSD City for the period 2020–2023, calculated from Landsat 8 imagery using Google Earth Engine. This indicates that vegetation is increasingly displaced as urban expansion intensifies in the city core. Research findings are consistent with international studies that associate urban growth with environmental decline. Hence, GWR provided spatial evidence of vegetation loss as a key driver of urbanization.
The coefficient of NDBI with respect to the Urban Index was positive and spatially clustered in high-density areas. Central business districts and large-scale residential complexes exhibited the strongest positive values. This suggests that built-up density directly contributes to urban compactness and impervious surface expansion. Peripheral areas showed weaker relationships, reflecting transitional landscapes. These results confirm that NDBI is a reliable predictor of built-up concentration in urban environments. Consequently, the GWR model validated the strong contribution of built-up areas to the Urban Index.
Land Surface Temperature demonstrated a positive correlation with the Urban Index, with varying strengths across the study area. Higher coefficients were recorded in urban cores where impervious surfaces are dominant. Peripheral zones displayed moderate associations, reflecting the buffering effect of residual vegetation. This pattern illustrates the strengthening interaction between urban density and surface heating. The spatial distribution of coefficients confirmed that heat stress is most critical in the densest built-up areas. Thus, GWR analysis emphasizes the role of thermal conditions as a direct by-product of urban expansion.
The Modified Normalized Difference Water Index (MNDWI) showed weaker but significant negative relationships with the Urban Index. Negative coefficients were particularly evident in peripheral areas where water bodies have been reduced or fragmented. The construction process has led to the displacement of water features. In central areas, the relationship was less pronounced, reflecting limited water surface availability. Although not as strong as NDVI or NDBI, MNDWI added explanatory power to the overall model. Therefore, GWR demonstrated that water loss is an additional consequence of rapid urban development.
Figure 15. Distance from center (Data: 2020-2023)
Source: Calculated from Landsat 8 imagery (2020–2023) using Google Earth Engine.
The results of the GWR model illustrate the diverse impacts of urban expansion in BSD City. Localized coefficients revealed spatially varying drivers of urbanization, ranging from vegetation decline to heat stress and water loss. These findings support the argument that urban planning must adopt place-based approaches rather than uniform strategies. Spatial heterogeneity suggests that different zones require differentiated policy responses. Integrating these insights into planning can enhance ecological resilience while supporting economic growth. Consequently, GWR findings provide a critical foundation for sustainable urban development strategies in BSD City.
Figure 15 shows the distance from the city center in BSD City for the period 2020–2023, calculated from Landsat 8 imagery using Google Earth Engine. The GWR revealed considerable disparities in how residents of BSD City engage with their metropolitan environment. Urban cores with higher coefficients of the Normalized Difference Built-up Index and Land Surface Temperature show the significant impact of built-up density and thermal stress on driving compact urbanization. In contrast, negative coefficients for NDVI and MNDWI in peripheral areas highlight the persistent importance of vegetation and water bodies in enabling urban growth. Urban processes are shaped by the specific local ecological and spatial settings in which they occur. Studies show that conventional planning techniques are insufficient to handle the complexities of urban development [29, 30]. The GWR findings therefore reinforce the need for context-specific methods that combine environmental durability with urban planning [31].
4.3 Spatial insights into consumer preferences and eco-branding strategies in BSD City
In BSD City, consumer preferences are increasingly favoring residential areas that prioritize sustainability and environmental quality. Eco-branding in property development has become a key factor in consumer purchasing decisions. Annual reports indicate that marketing campaigns with robust sustainability themes tend to achieve better sales results in specific industry groups. Spatial analysis indicates that areas with higher NDVI values and lower LSTs are consistent with consumer demand for eco-friendly housing. Ecological attributes directly influence preferences for urban real estate. Eco-branding thus serves as a tactical link between environmental quality and consumer preference.
Buyer preferences were significantly influenced by vegetation cover, with NDVI values spanning from -0.125 to 0.375. Residential developments near clusters with high NDVI values experienced greater sales success than more densely populated urban zones. The Land Surface Temperature, spanning 32℃ to 68℃, also influenced consumer perceptions of comfort and livability, which in turn were used by eco-branded projects in their marketing efforts. The ability to promote cooler and more environmentally friendly living spaces increased consumer appeal. Ecological quality therefore directly influences the content of sustainable marketing narratives.
The mixed implications for consumer choice were shown by built-up expansion, which is represented by NDBI values spanning from –0.219 to 0.094. Urban areas offered easy access, but they also posed the threat of higher land surface temperatures and less vegetation coverage. The Urban Index peaked at 0.375, indicating that consumers weigh the benefits of city life against their concerns about the environment. This reinforced the image of a consumer living a sustainable and balanced lifestyle. Urbanized regions displayed diverse levels of intensity, resulting in distinct marketing strategies.
Hotspot analysis and Local Moran's I analysis confirmed that compact urban cores were the most vulnerable to ecological stress. Values of the Gi* statistic between -2.0 and 1.75 identified clusters where eco-branding strategies were either critical or less effective. In core zones, sustainable marketing must offset ecological shortfalls by promoting intelligent infrastructure and energy-efficient dwellings. In outlying areas, marketing utilized natural vegetation and reduced thermal stress to promote eco-friendly living benefits. The spatial differentiation in marketing appeal highlights the need for localized marketing strategies. Consequently, eco-branding strategies need to be tailored to the specific spatial settings in BSD City.
Reports from 2020 and 2024 corporate disclosures highlighted a commitment to green infrastructure and environmentally sustainable living practices. The adoption of eco-living products by consumers correlated with financial growth, facilitated by targeted promotional advertising efforts. Expenditures on marketing have been increasingly directed towards projects that are branded as being environmentally sustainable. This is consistent with the GWR findings that environmental quality has a significant impact on consumer preferences across different locations. The study links consumer behavior to ecological realities by combining corporate data with spatial analysis. Sustainable marketing is supported not only by stories but also by scientific evidence of environmental factors.
Annual corporate reports served as the basis for the analysis of consumer preferences, which utilised aggregated housing sales and eco-branding data, in place of neighbourhood-level datasets. Consequently, the spatial alignment between consumer demand and NDVI or LST patterns should be interpreted as indicative rather than conclusive. The absence of micro-scale transaction or survey data limited the ability to establish statistically rigorous causal pathways. Hedonic pricing models, household surveys, or social media mining should be adopted in future studies to provide evidence of finer-scale behavior. The integration of such datasets would enable more robust linkages between consumers’ ecological attributes and housing preferences. This limitation highlights the exploratory nature of this study and suggests promising directions for future research.
Urban planning can learn valuable lessons from the alignment of consumer preferences, eco-branding, and the diversity of needs across different areas. Marketing strategies that are truly environmentally friendly are more effective than those that just pretend to be. Future development must ensure that green branding aligns with quantifiable enhancements in vegetation cover and thermal comfort. Combining remote sensing and consumer data can enhance place-based marketing strategies that appeal to environmentally conscious customers. This integration also boosts the credibility of corporate sustainability promises. Eco-branding subsequently becomes a marketing tool and a driver for sustainable urban development strategies.
This study also emphasizes the differences in consumer groups across various regions, which are influenced by ecological and economic considerations. Regions in the city centre with higher land surface temperatures and lower Normalised Difference Vegetation Indices are already densely inhabited, implying that residents in these areas place a high priority on being close to employment opportunities despite their exposure to heat stress and restricted access to green areas. Residential areas with higher NDVI values and lower levels of LST typically draw consumers who value environmental comfort and ecological amenities above direct economic accessibility. While all property products are still marketable, consumer buying decisions are split into separate groups based on varying motivations, such as access-oriented versus comfort-oriented preferences. The incorporation of ecological factors, such as NDVI and LST, into the analysis of the urban housing market highlights the importance of linking consumer preferences to spatial indicators. This segmentation provides vital information for planning eco-friendly cities and promoting products in an environmentally sustainable way.
Study findings showed that urban growth in BSD City from 2020 to 2023 had quantifiable effects on the environment, climate, and human behaviour. NDVI readings fluctuated between –0.125 and 0.375, with a maximum of 0.188, indicating stressed vegetation, whereas NDBI (–0.219 to 0.094, peak –0.063) and the Urban Index (0.188–0.500, peak 0.375) indicated an increase in built-up density. The Land Surface Temperature varied between 32℃ and 68℃, with a temperature of 40℃ being recorded most often, which indicates increased urban heat exposure. Spatial clustering, which utilized Gi* hotspots (–2.0 to 1.75, peak 0.25) and Local Moran's I (–0.004 to 0.016, peak 0.0), showed compact and localized growth patterns. The integration of Annual Report data also showed that the demand for sustainable housing is being driven by growing consumer preferences, in addition to its ecological and thermal impacts. Data indicates that eco-branding strategies have a significant appeal to consumers in regions with a cooler and more environmentally friendly climate, thereby validating the marketing potential of green features.
Several limitations became apparent during the course of this study. Landsat 8 high-resolution imagery, with a resolution of 30 m, restricted the detection of minor ecological and urban variations. The study period, spanning from 2020 to 2023, limited the capacity to monitor longer-term developmental trajectories. The coefficient of variation (peaking at 0.125 and reaching a maximum of 0.625) and local variance NDVI (with a peak of 0.001) were sensitive to kernel size and scale parameters, which may impact the results. Analysis of distances revealed compactness within 5 km of the city centre; however, socioeconomic data, separated by neighbourhood, were unavailable to verify consumer insights geographically. BSD City's Annual Reports provided valuable insights into eco-branding and marketing, but lacked necessary spatial data for precise calibration. Findings should be generalised with caution beyond the BSD case study.
Although the integration of annual reports with spatial indices highlighted indicative linkages between consumer preferences and ecological attributes, the absence of neighbourhood-level transaction data limited statistical rigor. The results should therefore be interpreted as exploratory rather than definitive, reflecting the aggregated nature of corporate disclosures. Future research must incorporate micro-scale datasets, such as household surveys, social media analytics, or hedonic pricing models, to capture consumer behaviour more accurately. Incorporating this detailed evidence would facilitate more robust verification of connections between spatial and behavioural aspects. It would also provide a firmer basis for testing the influence of ecological amenities on housing demand. Consequently, the marketing dimension remains a valuable avenue for refinement in future investigations.
[1] Li, J.Y. (2024). Evaluating the correlation between impacting factors and land surface temperature via spatial regression model and random forest. The Professional Geographer, 76(6): 740-755. https://doi.org/10.1080/00330124.2024.2398243
[2] Simon, O., Yamungu, N., Lyimo, J. (2022). Simulating land surface temperature using biophysical variables related to building density and height in Dar Es Salaam, Tanzania. Geocarto International, 38(1). https://doi.org/10.1080/10106049.2022.2142971
[3] Fan, Z.Y., Zhan, Q.M., Wang, Y., Shao, Z.F., Fan, Y.L., Zhang, Y.F. (2024). Investigating the effect of spatial patterns of artificial impervious surface on PM₂.₅ at the intra-urban scale. Geo-spatial Information Science, 28(3): 884-903. https://doi.org/10.1080/10095020.2024.2350179
[4] Pan, L.Y., Lu, L.L., Fu, P., Nitivattananon, V., Guo, H.D., Li, Q.T. (2023). Understanding spatiotemporal evolution of the surface urban heat island in the Bangkok metropolitan region from 2000 to 2020 using enhanced land surface temperature. Geomatics, Natural Hazards and Risk, 14(1). https://doi.org/10.1080/19475705.2023.2174904
[5] Moussa Kourouma, J., Eze, E., Negash, E., Phiri, D., Vinya, R., Girma, A., Zenebe, A. (2021). Assessing the spatio-temporal variability of NDVI and VCI as indices of crops productivity in Ethiopia: A remote sensing approach. Geomatics, Natural Hazards and Risk, 12(1): 2880-2903. https://doi.org/10.1080/19475705.2021.1976849
[6] Méndez-Astudillo, J., Caetano, E. (2025). Surface urban heat island distribution and socioeconomic inequalities in a major Latin American agglomeration. International Journal of Digital Earth, 18(1). https://doi.org/10.1080/17538947.2025.2547290
[7] Lin, X.N., Cui, Y.H., Hao, S., Zhu, C.B., Zhang, P.Y., Zhao, H.R. (2024). Influence of urban landscape pattern on summer surface temperature and its spatial scale effects. Geocarto International, 40(1). https://doi.org/10.1080/10106049.2024.2441370
[8] Sumaryana, H., Buchori, I., Sejati, A.W. (2023). Green infrastructure modelling for UHI control to urban thermal comfort: A case study of Temanggung urban area. International Journal of Urban Sciences, 28(2): 211-243. https://doi.org/10.1080/12265934.2023.2253200
[9] Guha, S., Govil, H., Gill, N., Dey, A. (2020). Analytical study on the relationship between land surface temperature and land use/land cover indices. Annals of GIS, 26(2): 201-216. https://doi.org/10.1080/19475683.2020.1754291
[10] Zhang, Y.X., Li, Z.Y., Li, Z.G., Zhai, F.F., Li, H.D. (2024). Study on the spatial accessibility and influencing factors of traditional villages in the Central Plains urban agglomeration of China. Journal of Asian Architecture and Building Engineering, 24(5): 4073-4087. https://doi.org/10.1080/13467581.2024.2390605
[11] Xiong, Q.B., Chen, W.B., He, L., Luo, S.Q., Li, H.F. (2022). Study on the influencing factors and the spatiotemporal heterogeneity of Urban Heat Island effect in Nanchang City of China. Journal of Asian Architecture and Building Engineering, 22(3): 1444-1457. https://doi.org/10.1080/13467581.2022.2085723
[12] Murakami, D., Tsutsumida, N., Yoshida, T., Nakaya, T., Lu, B.B. (2020). Scalable GWR: A linear-time algorithm for large-scale geographically weighted regression with polynomial kernels. Annals of the American Association of Geographers, 111(2): 459-480. https://doi.org/10.1080/24694452.2020.1774350
[13] Arifai, A.M., Arsyad, M.F. (2025). Urban expansion, climate vulnerability, and transportation resilience: Insights for sustainable development. Advance Sustainable Science Engineering and Technology, 7(3): 0250307. https://doi.org/10.26877/zr416x19
[14] Yang, J.Y., Wang, E.X. (2025). Exploring the nonlinear impacts of built environment on urban vitality from a spatiotemporal perspective at the block scale in Chongqing. ISPRS International Journal of Geo-Information, 14(6): 225. https://doi.org/10.3390/ijgi14060225
[15] Guha, S. (2021). Dynamic seasonal analysis on LST-NDVI relationship and ecological health of Raipur City, India. Ecosystem Health and Sustainability, 7(1). https://doi.org/10.1080/20964129.2021.1927852
[16] Chen, V.Y.J., Yang, T.C., Jian, H.L. (2022). Geographically weighted regression modeling for multiple outcomes. Annals of the American Association of Geographers, 112(5): 1278-1295. https://doi.org/10.1080/24694452.2021.1985955
[17] Jussila, J., Franzini, F., Häyrinen, L., Lähtinen, K., Nagy, E., Mark-Herbert, C., Roos, A., Toppinen, A., Toivonen, R. (2023). Consumer housing choices among residents living in wooden multi-storey buildings. Housing Studies, 39(10): 2654-2679. https://doi.org/10.1080/02673037.2023.2217765
[18] Kylkilahti, E., Autio, M., Harvio, V., Holmberg, U., Toppinen, A. (2022). Co-developing sustainability–A consumer-inclusive approach to wooden housing business in Finland. Housing Studies, 39(5): 1219-1238. https://doi.org/10.1080/02673037.2022.2114592
[19] Roos, A., Hoen, H.F., Aguilar, F.X., Haapala, A., Hurmekoski, E., Jussila, J., Lähtinen, K., Mark-Herbert, C., Nord, T., Toivonen, R., Toppinen, A. (2022). Impact of prospective residents' dwelling requirements on preferences for house construction materials. Wood Material Science & Engineering, 18(4): 1275-1284. https://doi.org/10.1080/17480272.2022.2126947
[20] Waszczuk, J. (2024). Behavioural aspects of price expectations and the anchoring effect on the housing market–Polish case study. Housing, Theory and Society, 41(3): 339-359. https://doi.org/10.1080/14036096.2024.2325604
[21] Wang, G.Y., Li, M.H., Li, Y.L., Chen, T., Heng, C.K. (2025). The correlation between watercarbon and urban spatial form in built-up areas: Evidence from Shenzhen City, China. Urban Climate, 59: 102292. https://doi.org/10.1016/j.uclim.2025.102292
[22] Rahma, L.A., Hermawan, R., Rachmawati, E. (2025). Life cycle assessment approach for tracing the impact of recreational activities in green open spaces, South Tangerang - Indonesia. Media Konservasi, 30(1): 23. https://doi.org/10.29244/medkon.30.1.23
[23] Shahfahad, Talukdar, S., Naikoo, M.W., Rahman, A., Gagnon, A.S., Islam, A.R.M.T., Mosavi, A. (2023). Comparative evaluation of operational land imager sensor on board landsat 8 and landsat 9 for land use land cover mapping over a heterogeneous landscape. Geocarto International, 38(1). https://doi.org/10.1080/10106049.2022.2152496
[24] You, N.L. (2025). Identifying priority areas for optimizing the urban thermal environment by considering the impacts of the built environment on outdoor thermal comfort. Journal of Asian Architecture and Building Engineering: 1-17. https://doi.org/10.1080/13467581.2025.2473140
[25] Dilawar, A., Chen, B.Z., Trisurat, Y., Tuankrua, V., Arshad, A., Hussain, Y., Measho, S., Guo, L.F., Kayiranga, A., Zhang, H.F., Wang, F., Sun, S.B. (2021). Spatiotemporal shifts in thermal climate in responses to urban cover changes: A-case analysis of major cities in Punjab, Pakistan. Geomatics, Natural Hazards and Risk, 12(1): 763-793. https://doi.org/10.1080/19475705.2021.1890235
[26] Ferreira, Z., Costa, A.C., Cabral, P. (2023). Analysing the spatial context of the altimetric error pattern of a digital elevation model using multiscale geographically weighted regression. European Journal of Remote Sensing, 56(1). https://doi.org/10.1080/22797254.2023.2260092
[27] Anupriya, R.S., Rubeena, T.A. (2023). Spatio-temporal urban land surface temperature variations and heat stress vulnerability index in Thiruvananthapuram city of Kerala, India. Geology, Ecology, and Landscapes, 9(1): 262-278. https://doi.org/10.1080/24749508.2023.2182088
[28] Modi, T., Ghosh, T., Ali, D., Alarifi, S., Choudhary, N., Kumar, P., Patel, A., Gupta, N., Niazi, P., Yadav, V.K. (2024). Geospatial evaluation of normalized difference vegetation index (NDVI) and urban heat island: A spatio-temporal study of Gandhinagar City, Gujarat, India. Geomatics, Natural Hazards and Risk, 15(1). https://doi.org/10.1080/19475705.2024.2356214
[29] Xu, A.Q., Zhang, C.H., Ruther, M. (2020). Spatial dependence and spatial heterogeneity in the effects of immigration on home values and native flight in Louisville, Kentucky. Journal of Urban Affairs, 43(10): 1513-1535. https://doi.org/10.1080/07352166.2020.1761257
[30] Olabamiji, A., Ajala, O. (2024). Geospatial determinants of urban poverty in Nigeria: An analysis of locally weighted factors. African Geographical Review, 44(4): 393-411. https://doi.org/10.1080/19376812.2024.2402367
[31] Kim, J., Lee, K.J.J., Thapa, B. (2021). Visualizing fairness: Distributional equity of urban green spaces for marginalized groups. Journal of Environmental Planning and Management, 65(5): 833-851. https://doi.org/10.1080/09640568.2021.1915258