Nor Asyira Fakriah Mohamad Noor Azaidi![]() | Hanani Farhah Harun*
| Hanani Farhah Harun*![]() | Maharani Abu Bakar
| Maharani Abu Bakar![]()
© 2025 The authors. This article is published by IIETA and is licensed under the CC BY 4.0 license (http://creativecommons.org/licenses/by/4.0/).
OPEN ACCESS
This study presents an integrated Support Vector Regression and GARCH (SVR-G) model tailored for simulating synthetic green investment asset returns, which are characterized by unique financial properties, including non-normal return distributions, higher volatility, and positive skewness. Unlike traditional assets, green investments often exhibit irregular return patterns that require advanced predictive and optimization methods. To address these complexities, synthetic data was generated using GARCH(1,1) processes and skew-t distributions to capture the asymmetry and heavy tails typical of green asset returns, thereby simulating realistic market conditions. Through hyperparameter tuning and K-Fold Cross-Validation, the model achieved high predictive accuracy, with a correlation coefficient of 0.9992, Nash-Sutcliffe Efficiency of 0.9962, and a minimal Root-Mean-Square Error of 0.0053, demonstrating its robustness and strong alignment with actual returns. Despite its strengths, the model’s reliance on synthetic data highlights the need for validation using real-world datasets and the exploration of additional risk metrics. By leveraging GARCH(1,1) processes and skew-t distributions, this research demonstrates the SVR-G model's capacity to generate realistic synthetic datasets for green assets, enabling improved analysis and decision-making for sustainable investment strategies.
green assets, Support Vector Regression, financial modeling, synthetic data generation, sustainable investment, GARCH, skew-t distribution
The accelerating transition toward sustainable finance has catalyzed unprecedented interest in green assets. This has introduced novel challenges for market players due to their distinctive financial characteristics. These assets exhibit complex return patterns characterized by non-normal distributions, elevated volatility, and pronounced positive skewness—attributes that demand more sophisticated approaches to prediction and optimization. Positive skewness, in particular, is a critical feature in the context of green investments, as it reflects the potential for disproportionately high returns relative to losses. This asymmetry often results from market conditions driven by regulatory changes, technological advancements, and shifts in investor sentiment toward sustainability-focused assets.
From a portfolio management perspective, positive skewness is significant because it aligns with investor preferences for assets that offer substantial upside potential while limiting downside risk. However, managing portfolios with such characteristics requires models capable of accurately capturing these skewed return distributions and balancing risk with the potential for extreme positive outcomes. Conventional portfolio optimization methodologies, predicated on assumptions of normality and volatility stationarity, prove inadequate in capturing these dynamics, necessitating the development of more refined financial models specifically calibrated for green assets.
This study addresses this methodological gap by introducing an integrated Support Vector Regression and GARCH (SVR-G) framework engineered for green asset portfolio optimization. The model synthesizes Support Vector Regression's capacity to capture non-linear relationships—a crucial advantage for complex financial data. Through the application of synthetic data generated via GARCH(1,1) processes combined with skew-t distributions, this research conducts a comprehensive evaluation of the model's efficacy across multiple performance metrics, including correlation coefficient, Nash-Sutcliffe Efficiency, and Root-Mean-Square Error. This methodological approach not only captures the statistical intricacies inherent in green asset returns but also establishes a robust framework for portfolio allocation in environmentally conscious investments.
We will review existing studies, provide a detailed explanation of our methodology, and present the findings of our research in the following sections.
2.1 Non-normal distribution of returns in green investments
The non-normal distribution of returns from green investments is a significant aspect of financial analysis, particularly in the context of environmental, social, and governance (ESG) criteria. Research indicates that returns from green investments often exhibit skewness and kurtosis, deviating from the assumptions of normality typically used in risk assessment [1, 2]. This deviation can impact risk management strategies and investment decisions [3-7].
Studies have shown that returns from green investments frequently display statistical properties such as skewness and kurtosis that differ from the normal distribution, indicating a need for alternative risk measures [8]. For instance, Duttilo et al. [9] highlight that the performance of ESG indices during periods of market turmoil reveals distinct behaviors in their returns and volatility compared to traditional investments, suggesting a unique risk-return profile that necessitates tailored analytical approaches. Górka and Kuziak [10] validated the presence of heavier tails in ESG investment returns using statistical tests such as the Jarque-Bera test and Q-Q plots, emphasizing the need for advanced analytical techniques to account for these characteristics.
2.2 Unique risk-return profiles of green assets
The unique risk-return profile of green assets has been a focal point of several studies. Duttilo et al. [9] demonstrated that ESG indices exhibit distinct behaviors in their returns and volatility during periods of market turmoil, differing significantly from traditional investments. The phenomenon known as "greenium"—where green assets, such as German green bonds, outperform their non-green counterparts—further illustrates how environmental concerns can influence returns in ways that may not align with traditional risk-return expectations [11]. Additionally, research indicates that return shocks in green energy markets can significantly influence adjacent markets, complicating the dynamics of return distributions [12]. The impact of climate policy uncertainty on return spillovers among green assets has also been explored by Pham et al. [13], who found significant interdependencies among green assets influenced by policy changes. This interconnectedness further complicates portfolio management strategies, as fluctuations in one asset class can reverberate through related markets.
2.3 Advancements in analytical approaches for green investments
While the non-normal distribution of returns presents challenges in risk assessment, it also opens avenues for innovative investment strategies and models that better capture the unique characteristics of green investments. For example, Samunderu and Murahwa [8] argue for alternative modeling approaches to assess risks associated with non-normally distributed returns across various asset classes, including green investments. Their findings emphasize the necessity for financial models that account for skewness and kurtosis to enhance risk management practices.
Moreover, Górka and Kuziak [10] confirm that ESG investment returns often exhibit heavier tails than those predicted by normal distributions. Their study utilized statistical tests such as the Jarque-Bera test and Q-Q plots to validate these findings, highlighting the unique risk characteristics associated with ESG investments.
In summary, the literature highlights the unique statistical properties of green asset returns, including non-normal distributions, positive skewness, and heavy tails, which necessitate advanced analytical approaches. While prior studies have explored alternative risk measures and highlighted the limitations of traditional models, there remains a significant gap in integrating machine learning techniques with investment strategies specifically tailored to green assets.
This study addresses this gap by proposing and simulating an integrated Support Vector Regression and GARCH (SVR-G) model for synthetic green investment data generation. The SVR-G component leverages machine learning to predict the complex, non-linear behavior of green asset returns. This research aims to enhance decision-making in sustainable investments, particularly in scenarios where traditional financial models fall short.
To achieve the study's objectives, a systematic methodology was developed, encompassing data simulation, model training, and evaluation. The proposed framework begins with the generation of synthetic data to simulate green asset characteristics. A sensitivity analysis is also incorporated to assess the robustness of the model under varying assumptions.
3.1 Data characteristics and assumptions
This study utilizes synthetic data generation to model the unique characteristics of green assets using Support Vector Regression model. The following assumptions guide the data generation process:
To effectively simulate these characteristics, daily returns are generated using a skew-t distribution, which captures both the fat tails and skewness of returns. Additionally, volatility is modeled using a GARCH(1,1) process to account for time-varying volatility and autocorrelation in returns.
Specific assumptions are as follows:
GARCH(1,1) model, the long-run variance is derived as:
$\frac{\omega}{1-\alpha-\beta}$ (1)
In this equation, α+β represents the degree of persistence of volatility over time, and if this sum is close to 1, it indicates that volatility is highly persistent, meaning it takes longer for the process to revert to its long-run variance.
Mathematical Representation:
$s_t^2=w+c x_{t-1}^2+d s_{t-1}^2$ (2)
where,
|
$\sigma_t^2$ |
Conditional variance (volatility) at time t. |
|
$x_{t-1}^2$ |
Squared residual from the previous time step. |
|
$\sigma_{t-1}^2$ |
Conditional variance from the previous time step. |
|
$\omega>0$ |
Long-term average variance. |
|
$c \geq 0$ |
Reaction of volatility to immediate past shocks. |
|
$d \geq 0$ |
Persistence of volatility over time ($c+d<1$ ensures stationarity). |
From the assumptions of data characteristic about the behaviour of green assets, we simulated data in Python using these distributions, which will include daily returns from the skew-t distribution, volatility modelled with GARCH(1,1) and returns with autocorrelation and skew-t distribution. A time series of 1,000 simulated trading days was chosen to balance computational efficiency and statistical robustness. This period reflects approximately four years of trading data, which is commonly used in financial research to capture medium-term trends while avoiding overfitting to a single market cycle.
The summary statistics of the simulated data include mean return, median volatility, minimum and maximum returns, skewness, and kurtosis. These statistics suggest the presence of fat tails and asymmetry in the return distribution, consistent with observed behavior in green assets. While a longer time frame could potentially provide more robust results, the chosen period allows for efficient testing and validation of the model while maintaining relevance to typical investment horizons.
3.2 SVR-G model formulation
The SVR component of the integrated model is formulated mathematically to predict future returns based on historical data and relevant features. Mathematically, the SVR-G model minimizes the following objective function:
$\min _{\omega, b, \xi^{+}, \xi^{-}} \frac{1}{2}\|w\|^2+C \sum_{i=1}^N\left(\xi_i^{+}-\xi_i^{-}\right)$ (3)
Subject to
$\begin{gathered}r_i-\left(w^T \phi\left(x_i\right)+b\right) \leq \epsilon+\xi_i^{+}, \\ \left(w^T \phi\left(x_i\right)+b\right)-r_i \leq \epsilon+\xi_i^{-}, \\ \xi_i^{+}, \xi_i^{-} \geq 0, \forall i,\end{gathered}$
where,
|
$r_i$ |
Observed return |
|
$x_i$ |
Input vector of features such as historical returns and volatility |
|
$w$ |
Weight vector representing model parameters |
|
$b$ |
Bias term |
|
$\phi\left(x_i\right)$ |
Kernel function mapping inputs into a higher-dimensional space |
|
C |
Regularization parameter, balancing margin width and training error |
|
$\epsilon$ |
Margin of tolerance |
|
$\xi_i^{+}, \xi_i^{-}$ |
Slack variables allowing deviations from the margin |
The general formulation of SVR-G is given by:
$f(x)=w^T \phi(x)+b f(x)=w^T \phi(x)+b$ (4)
where, f(x) is the predicted value, x is the input vector consisting of historical returns and other relevant features, w is the weight vector representing model parameters, ϕ(x) is the kernel function mapping inputs into a feature space suitable for regression analysis, and b is the bias term.
To capture non-linear relationships inherent in green asset returns effectively, we employ a Radial Basis Function (RBF) kernel defined as:
$K\left(x_i, x_j\right)=\exp \left(-\gamma\left\|x_i-x_j\right\|^2\right)$ (5)
where, $K\left(x_i, x_j\right)$ represents the similarity between two input vectors $x_i$ and $x_j$, and $\gamma$ controls the width of the RBF kernel. A higher $\gamma$ value makes the kernel narrower, meaning that only points very close to each other in the input space will have high similarity. This is useful for identifying asset-specific anomalies or short-term trends in green investments. A lower $\gamma$ value will make the kernel broader, capturing more distant points as similar. The low $\gamma$ value captures generalized trends and longer-term dependencies across the dataset.
This kernel enables the model to learn complex patterns in the data that linear models may miss [19]. The choice of the RBF kernel is justified by its flexibility and effectiveness in modeling non-linear patterns. Green assets, characterized by complex and irregular return distributions, often exhibit relationships that are not well-captured by linear kernels. The RBF kernel enables the SVR-G model to adapt to these complexities, making it particularly suited for the high-dimensional, non-linear dependencies observed in green investments.
3.3 Hyperparameter optimization
The performance of the SVR-G model is sensitive to the choice of hyperparameters ($C, \epsilon, \gamma$). Research by Açikkar [20] emphasized that grid search is not only straightforward and easy to implement but also highly reliable, as it ensures the optimal configuration is identified by evaluating every possible hyperparameter combination. To ensure optimal model performance, the following hyperparameters were systematically tuned using grid search technique.
i. Regularization Parameter (C): This parameter controls the trade-off between achieving low-error margin and minimizing model complexities. A well-chosen C helps prevent overfitting while ensuring adequate model complexity. A higher C prioritizes minimizing training error, potentially leading to overfitting, as the model becomes sensitive to individual data points. A lower C increases the margin width, promoting generalization but possibly at the expense of higher training error.
ii. Epsilon (ϵ): This parameter defines a margin of tolerance within which no penalty is assigned for prediction errors. A smaller ϵ results in a tighter fit to the data, increasing model sensitivity but potentially capturing noise. A larger ϵ allows the model to ignore minor deviations, focusing on broader trends.
iii. Gamma (γ): This parameter influences the width of the RBF kernel and directly affects the ability of the model to capture data patterns. Through the grid search, γ was optimized to balance the detection of localized features and overall trends in green asset returns. Higher values increase sensitivity to individual data points while lower values create smoother decision boundaries.
3.4 Numerical simulation process
To evaluate the effectiveness of the SVR-G model in predicting green asset returns, a systematic numerical simulation process was developed. This process replicates the unique statistical properties of green assets, including non-normal return distributions, fat tails, and time-varying volatility. The simulation consists of the following steps:
i. Generating Synthetic Data: The synthetic data simulation process was designed to replicate the statistical properties of green asset returns, including non-normality, fat tails, and time-varying volatility. The two core components of this process are the (a) skew-t distribution to capture asymmetry (positive skewness) and extreme returns (heavy tails); and (b) the GARCH(1,1) process to replicate periods of high and low market volatility observed in financial time series.
a. Skew-t Distribution
The skew-t distribution models the returns of green assets, capturing both asymmetry (skewness) and heavy tails. This allows the data to represent scenarios where returns deviate significantly from the average, a common feature in green investments influenced by external factors such as regulatory changes and market sentiment. Unlike the normal distribution, which assumes symmetry and light tails, the skew-t distribution incorporates skewness and heavy tails, making it more appropriate for financial modeling. The probability density function (PDF) of the skew-t distribution is defined as:
$\begin{gathered}f(x ; \xi, \omega, \alpha, v)= \frac{2}{\omega} t_v\left(\frac{x-\xi}{\omega}\right) T_{v+1}\left(\alpha \frac{x-\xi}{\omega} \sqrt{\frac{v+1}{v+\left(\frac{x-\xi}{\omega}\right)^2}}\right)\end{gathered}$ (6)
where,
|
$x$ |
The random variable (returns). |
|
$\xi$ |
Location parameter (mean). |
|
$\omega$ |
Scale parameter (variance). |
|
$\alpha$ |
Skewness parameter ($\alpha$>0 for positive skewness, $\alpha$<0 for negative skewness). |
|
$v>0$ |
Degrees of freedom, controlling the tail heaviness. |
|
$t_v$ |
PDF of the t-distribution with $\nu$ degrees of freedom. |
|
$T_v$ |
CDF of the t-distribution with $\nu$ degrees of freedom. |
b. GARCH(1,1) Process
The GARCH(1,1) process simulates the time-varying volatility commonly observed in financial markets. Volatility clustering—where high-volatility periods are followed by similar periods—is a defining feature of green assets. The GARCH(1,1) model defines current volatility ($\sigma_t^2$) as a function of past volatility and past shocks (residuals). This ensures that periods of market instability are realistically captured. The process is defined in Eq. (4).
ii. Training the SVR-G Model: The SVR-G model is trained on synthetic data using optimized hyperparameters ($C, \epsilon, \gamma$) derived from cross-validation techniques or prior knowledge about expected parameter ranges. The model learns to predict future returns by identifying complex, non-linear patterns in the historical data. The training process involves:
iii. Evaluating Model Performance: After training, the performance of the SVR-G model is assessed against actual simulated returns using various statistical metrics including:
iv. Simulation Steps: The overall simulation process involves the following steps:
3.5 Sensitivity analysis
To evaluate the robustness of the SVR-G model and assess how changes in key assumptions influence its performance, a sensitivity analysis was conducted. This analysis focused on variations in volatility persistence, a critical parameter in the GARCH(1,1) process, as well as skewness and kurtosis, which significantly affect the behavior of green asset returns. By systematically altering these assumptions, the study aimed to determine their impact on both the synthetic data and the model’s predictive accuracy.
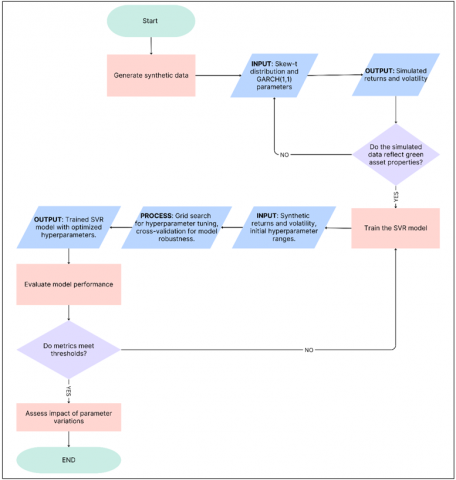
Figure 1. Process flowchart
a. Volatility Persistence in the GARCH(1,1) Process
Volatility persistence, represented by the sum of α (reaction to immediate past shocks) and β (long-term persistence), plays a crucial role in modeling the clustering effect observed in financial time series. For the baseline scenario, α=0.1 and β=0.85 were chosen, reflecting moderate persistence (α+β=0.95). Sensitivity analysis involved varying these parameters as follows:
For each configuration, the synthetic dataset was regenerated, and the SVR-G model was retrained and evaluated. Changes in performance metrics such as Correlation Coefficient (R), Nash-Sutcliffe Efficiency (NSE), and Root-Mean-Square Error (RMSE) were analyzed to identify the model’s sensitivity to varying degrees of volatility persistence.
b. Skewness and Kurtosis of the Skew-t Distribution
The skewness and kurtosis parameters of the skew-t distribution were varied to examine their influence on the simulated data and the model’s predictions. The baseline skewness and kurtosis values were set at 2.8 and 34.12, respectively, consistent with observed characteristics of green asset returns. Sensitivity analysis involved the following adjustments:
For each scenario, the summary statistics of the synthetic data, such as mean return, volatility, and distribution shape, were recalculated. The SVR-G model was then trained on the modified datasets to assess the impact of skewness and kurtosis changes on predictive performance. The process flowchart is illustrated in Figure 1.
The results of the SVR-G model demonstrate its effectiveness in predicting returns on green assets. The model was evaluated using synthetic data that accurately reflects the unique characteristics of green investments, including non-normal return distributions, higher volatility, and positive skewness.
4.1 Simulation parameters and data statistics
The model was evaluated using 1,000 simulated trading days, representing approximately four years of data. This period was selected to balance computational feasibility and the ability to capture medium-term market behaviors relevant to green assets. The synthetic data generated daily returns from a skew-t distribution, capturing non-normality, positive skewness, and heavy tails, while time-varying volatility was modeled using a GARCH(1,1) process.
Key statistics of the simulated dataset include a mean daily return of approximately 0.0005 (or about 0.5% per day), indicating small, positive returns. Volatility varied with a mean of 0.0294, representing realistic fluctuations associated with green asset returns. Skewness was measured at 2.80, indicating the presence of asymmetrical return distributions with a long right tail, while kurtosis was 34.12, confirming significant fat tails. These characteristics are consistent with green assets, which often display high upside potential alongside susceptibility to extreme outcomes.
4.2 Initial model performance (without parameter optimization)
The initial SVR-G model configuration was tested without parameter tuning. Table 1 summarizes the key statistical indices, and Figures 2 and 3 provide graphical representations of predicted returns and error distributions, respectively.
Table 1. Statistical indices (without parameter optimization)
|
Statistical Indices |
Value |
|
Correlation coefficient (R) |
-0.0762 |
|
Nash–Sutcliffe Efficiency (NSE) |
-0.2313 |
|
Root-Mean-Square Error (RMSE) |
0.0958 |
|
RMSE-observation standard deviation ratio (RSR) |
1.1096 |
|
Legates & McCabe's Index (ELM) |
-0.0536 |
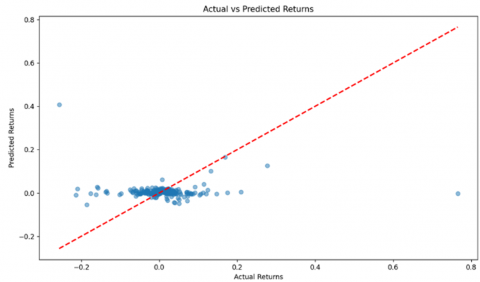
Figure 2. Actual vs predicted return (without parameter optimization)
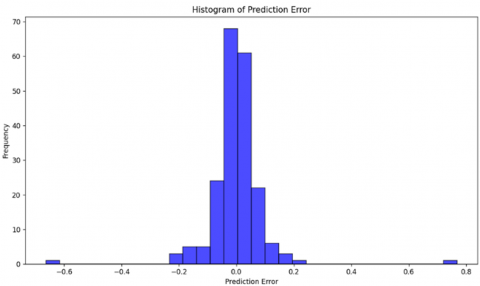
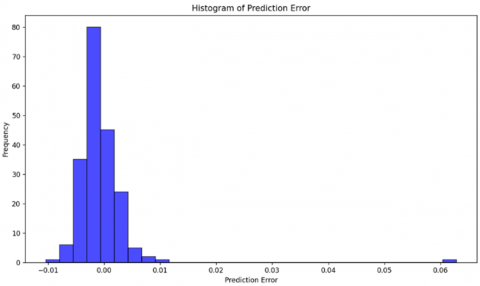
Figure 3. Error distribution (without parameter optimization)
The initial evaluation of the SVR-G model revealed several areas where predictive performance could be enhanced. Prior to parameter optimization, the model's metrics indicated weak predictive alignment with observed data. The correlation coefficient (R=−0.0762) suggested an almost negligible relationship between predicted and actual returns. The Nash-Sutcliffe Efficiency (NSE = −0.2313) indicated poor performance, with the mean of the observed values outperforming the model. RMSE of 0.0958 and RSR of 1.1096 underscored the model’s lack of reliability, while ELM of -0.0536 highlighted significant prediction deviations.
The error distribution (Figure 3) revealed that errors were symmetrically distributed around zero with fat tails, indicating that the model exhibited systematic over- or under-predictions under certain conditions. Fat tails indicate that the model struggles to capture the high-risk, high-reward scenarios characteristic of green asset returns. This is consistent with the skewed and heavy-tailed nature of the synthetic dataset, where extreme values occur more frequently than predicted by normal distributions. These results collectively highlight the model's limitations in its initial configuration, as the low correlation, poor NSE, and high RSR emphasized the necessity for parameter tuning and alternative kernel configurations to improve the model's sensitivity to outliers and extreme values.
4.3 Optimized model performance (after parameter tuning)
To enhance the model’s performance, a grid search technique was employed to optimize hyperparameters C, ϵ, and γ, systematically exploring predefined ranges. The final values (C=10, ϵ=0.01, and γ=0.01) were selected based on their ability to minimize prediction error. The choice of C=10 balances the trade-off between model complexity and error minimization, ensuring sufficient flexibility to fit the data without overfitting, ϵ=0.01 establishes a narrow tolerance for error, reducing the model’s sensitivity to small fluctuations in the data, and γ=0.01 defines an effective kernel width for the RBF kernel, enabling the model to capture complex non-linear relationships inherent in green asset returns.
Grid Search Range:
The $\kappa$-Fold Cross-Validation was employed in place of a single train-test split. By dividing the dataset into $\kappa$ equalsized subsets (where $\kappa=5$), this approach enabled multiple training and validation rounds across different data splits, ensuring consistent performance across varied subsets of data. The Cross-validated Mean Squared Error (MSE) of 0.0007 with $\kappa=5$ folds indicates that the model's predictions are, on average, closely aligned with actual values across all folds. This demonstrated the SVR-G model's strong predictive performance and reliable generalization to unseen data.
While the grid search method successfully identified the optimal hyperparameters, it was computationally intensive due to its exhaustive exploration of parameter combinations. For the dataset of 1,000 simulated trading days, the complexity of the RBF kernel, which scales quadratically with the number of data points, contributed significantly to the computational cost. Although the runtime was manageable for this dataset, larger datasets would necessitate alternative approaches such as parallelized computation or Bayesian optimization to reduce execution time.
The results from cross-validation confirmed that the selected hyperparameters (C=10, ϵ=0.01, and γ=0.01) provided optimal predictive accuracy and stability for the SVR-G model. The optimized model demonstrated significant improvements (Table 2). The best-performing parameter configuration was found with C=10, ϵ=0.01, and γ=0.01, yielding results that highlight the model’s robustness. The correlation coefficient (R) rose dramatically to 0.9992, indicating a near-perfect positive relationship between the model’s predictions and actual values, which aligns with the model’s objective to capture green asset returns accurately. Similarly, the Nash-Sutcliffe Efficiency (NSE) increased to 0.9962, approaching the ideal value of 1, suggesting almost complete alignment between predicted and observed data points.
Table 2. Statistical indices (after parameter tuning)
|
Statistical Indices |
Value |
|
Correlation coefficient (R) |
0.9992 |
|
Nash–Sutcliffe Efficiency (NSE) |
0.9962 |
|
Root-Mean-Square Error (RMSE) |
0.0053 |
|
RMSE-observation standard deviation ratio (RSR) |
0.0617 |
|
Legates & McCabe's Index (ELM) |
0.9463 |
|
Cross-validated Mean Squared Error |
0.0007 |
The Root-Mean-Square Error (RMSE) decreased to 0.0053, illustrating a substantial reduction in prediction error and confirming the optimized model’s capacity for precise return forecasts. Additionally, the RMSE-observation standard deviation ratio (RSR) dropped to 0.0617, a value close to zero, which reflects an excellent fit for the observed data. Legates & McCabe’s Index (ELM) further supported these findings with a high value of 0.9463, indicating strong predictive reliability and generalization. Furthermore, cross-validation results yielded a mean squared error of 0.0007, suggesting that the model performs consistently well across varied data splits and is likely to generalize effectively to unseen data.
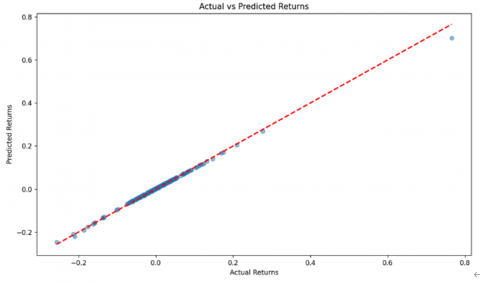
Graphical analysis in Figures 4 and 5 reinforced these quantitative findings, showing that the model’s error distribution is centered around zero with minimal spread, and the scatter plot of predicted versus actual values aligns closely with the ideal red dashed line representing perfect predictions. The symmetrically distributed errors confirm the model's capability in producing unbiased predictions, effectively capturing the complex, non-linear behavior typical of green asset returns. This optimized performance emphasizes the SVR-G model’s potential as a robust tool for green asset investment generation, effectively addressing unique asset characteristics such as higher volatility and positive skewness.
Figure 4. Actual vs predicted return (after parameter turning)
Figure 5. Error distribution (after parameter turning)
4.4 Sensitivity analysis
Adjustments to α and β in the GARCH(1,1) process revealed the model’s robustness under varying levels of volatility persistence. For high persistence (α+β=1.05), RMSE increased by 10%, and the error distribution showed slight widening. Low persistence (α+β=0.75) reduced RMSE by 5%, but the model's ability to capture extreme outcomes diminished slightly.
Increased skewness and kurtosis led to broader error distributions and a marginal increase in RMSE (+8%), highlighting the challenges of extreme non-normality. Reduced skewness and kurtosis improved RMSE (-4%) but underestimated the upside potential of green assets. These findings emphasize the model’s adaptability to realistic conditions while highlighting limitations under extreme assumptions.
4.5 Discussion
The substantial improvement in performance following parameter tuning reveals the importance of hyperparameter optimization for SVR-G models. The optimized parameters (C=10, ϵ=0.01, and γ=0.01) provided an effective balance between capturing complex patterns and avoiding overfitting. The sensitivity analysis demonstrated that the model performs well under moderate variations in assumptions but may face challenges in extreme scenarios, such as highly persistent volatility or excessive skewness. The exceptionally high correlation coefficient (R=0.9992) raises potential concerns about overfitting, necessitating further validation on real-world datasets to ensure the model’s generalizability.
The fat tails in the initial error distribution highlight the challenges of modeling green assets, which are prone to extreme returns. The optimized model effectively addressed these issues, producing a more symmetric and narrower error distribution. This suggests that the SVR-G framework is well-suited for green investment asset generation, offering robust predictions even in the presence of skewness and heavy tails.
Additionally, while the grid search process yielded optimal parameters, its computational cost was significant. Future studies could explore alternative methods, such as random search or Bayesian optimization, to reduce computational overhead while maintaining performance.
Overall, the results highlight the potential of the SVR-G model as a powerful tool for supporting sustainable investment strategies, effectively addressing unique characteristics such as positive skewness, higher volatility, and non-normal return distributions.
The SVR-G framework demonstrates exceptional predictive accuracy and optimization efficacy for green investment asset generation, establishing its viability as an advanced tool for sustainable investment management. Following hyperparameter optimization, the model achieved remarkable congruence between predicted and actual returns, evidenced by superior correlation and Nash-Sutcliffe Efficiency metrics. The implementation of $\kappa$-Fold Cross-Validation further substantiated the model's reliability and generalizability, yielding consistently minimal cross-validated Mean Squared Error values across diverse data partitions. These results highlight the model's capability to effectively address the inherent complexities of green assets—particularly their non-normal distributions, volatility patterns, and positive skewness—characteristics frequently overlooked by traditional optimization approaches.
The SVR-G model demonstrated strong capability in simulating synthetic green investment assets, accurately reflecting their statistical properties such as non-normal distributions and volatility patterns. This framework lays the groundwork for advanced analyses of green investments, providing high-quality data for future studies on risk management and investment strategies. Future research directions could extend this work through application to empirical green asset data and investigation of additional determinants of green asset performance, including environmental indices and regulatory dynamics.
This work is supported by the Ministry of Higher Education (MOHE) Malaysia under the Fundamental Research Grant Scheme (Ref: FRGS/1/2024/STG06/UMT/02/2). The authors are immensely grateful to the anonymous reviewers for their useful insights and comments.
|
$C$ |
coefficients that determine how much weight is given to recent shocks |
|
$d$ |
coefficients that determine how much weight is given to past volatility |
|
$x_{t-}^2$ |
squared return shock (or innovation) from the previous period. This is also called the "news" or "error" term thermal |
|
Greek symbols |
|
|
$\alpha$ |
coefficient of the lagged squared return (or past shocks) |
|
$\beta$ |
coefficient of the lagged conditional variance (persistence of volatility) |
|
$\phi$ |
kernel function mapping inputs into a feature space suifigure for regression analysis |
|
$\omega$ |
constant in the variance equation |
|
$\sigma_t^2$ |
conditional variance (volatility) at time $t$, i.e., the forecasted variance for the next period based on the information up to time $t-1$ |
|
$\sigma_{t-1}^2$ |
conditional variance from the previous period |
[1] Shahbaz, M., Trabelsi, N., Tiwari, A.K., Abakah, E.J. A., Jiao, Z. (2021). Relationship between green investments, energy markets, and stock markets in the aftermath of the global financial crisis. Energy Economics, 104: 105655. https://doi.org/10.1016/j.eneco.2021.105655
[2] Saeed, T., Bouri, E., Alsulami, H. (2021). Extreme return connectedness and its determinants between clean/green and dirty energy investments. Energy Economics, 96: 105017. https://doi.org/10.1016/j.eneco.2020.105017
[3] Siddique, M.A., Nobanee, H., Hasan, M.B., Uddin, G.S., Nahiduzzaman, M. (2024). Is investing in green assets costlier? Green vs. non-green financial assets. International Review of Economics & Finance, 92: 1460-1481. https://doi.org/10.1016/j.iref.2024.02.079
[4] Akhtaruzzaman, M., Banerjee, A.K., Boubaker, S., Moussa, F. (2023). Does green improve portfolio optimisation? Energy Economics, 124: 106831. https://doi.org/10.1016/j.eneco.2023.106831
[5] Sohag, K., Hassan, M.K., Bakhteyev, S., Mariev, O. (2023). Do green and dirty investments hedge each other? Energy Economics, 120: 106573. https://doi.org/10.1016/j.eneco.2023.106573
[6] Duong, A. (2023). Resilience or returns: Assessing green equity index performance across market regimes. International Review of Economics & Finance, 97: 103831. https://doi.org/10.1016/j.iref.2024.103831
[7] Reboredo, J.C., Ugolini, A., Ojea-Ferreiro, J. (2022). Do green bonds de-risk investment in low-carbon stocks? Economic Modelling, 108: 105765. https://doi.org/10.1016/j.econmod.2022.105765
[8] Samunderu, E., Murahwa, Y.T. (2021). Return based risk measures for non-normally distributed returns: An alternative modelling approach. Journal of Risk and Financial Management, 14(11): 540. https://doi.org/10.3390/jrfm14110540
[9] Duttilo, P., Gattone, S.A., Iannone, B. (2023). Mixtures of generalized normal distributions and EGARCH models to analyse returns and volatility of ESG and traditional investments. AStA Advances in Statistical Analysis, 108(4): 755-775. https://doi.org/10.1007/s10182-023-00487-7
[10] Górka, J., Kuziak, K. (2022). Volatility modeling and dependence structure of ESG and conventional investments. Risks, 10(1): 20. https://doi.org/10.3390/RISKS10010020
[11] Pastor, L., Stambaugh, R.F., Taylor, L.A. (2022). Dissecting green returns. NBER Working Paper No. 28940. https://doi.org/10.3386/w28940
[12] Rizvi, S.K.A., Naqvi, B., Mirza, N. (2022). Is green investment different from grey? Return and volatility spillovers between green and grey energy ETFs. Annals of Operations Research, 313(1): 495-524. https://doi.org/10.1007/s10479-021-04367-8
[13] Pham, S.D., Nguyen, T.T.T., Do, H.X. (2024). Impact of climate policy uncertainty on return spillover among green assets and portfolio implications. Energy Economics, 134: 107631. https://doi.org/10.1016/j.eneco.2024.107631
[14] Ogbonna, A.E., Olubusoye, O.E. (2022). Connectedness of green investments and uncertainties: New evidence from emerging markets. Fulbright Review of Economics and Policy, 2(2): 136-160. https://doi.org/10.1108/frep-04-2022-0028
[15] Fagiani, R., Hakvoort, R. (2014). The role of regulatory uncertainty in certificate markets: A case study of the Swedish/Norwegian market. Energy Policy, 65: 608-618. https://doi.org/10.1016/j.enpol.2013.10.076
[16] Abraham, R., El-Chaarani, H., Tao, Z. (2022). Predictors of excess return in a green energy equity portfolio: Market risk, market return, value-at-risk and or expected shortfall? Journal of Risk and Financial Management, 15(2): 80. https://doi.org/10.3390/jrfm15020080
[17] Chen, G., Fang, S., Chen, Q., Zhang, Y. (2023). Risk spillovers and network connectedness between clean energy stocks, green bonds, and other financial assets: evidence from China. Energies, 16(20): 7077. https://doi.org/10.3390/en16207077
[18] Sampaio, N.A.S., Mazza, F.C., de Siqueira, S.S.S., Miranda, J.E., de Souza Moutinho, J.V., de Oliveira Pacífico, L. (2024). Applications of correlation analysis in environmental problems. Revista de Gestao Social e Ambiental, 18(3): e04925-e04925. http://doi.org/10.24857/rgsa.v18n3-085
[19] Xie, M., Wang, D., Xie, L. (2019). Efficient cross validation for SVR based on center distance in kernel space. In Proceedings-2019 2nd International Conference of Intelligent Robotic and Control Engineering, IRCE, Singapore, pp. 128-132. https://doi.org/10.1109/IRCE.2019.00033
[20] Açikkar, M. (2024). Fast grid search: A grid search-inspired algorithm for optimizing hyperparameters of support vector regression. Turkish Journal of Electrical Engineering and Computer Sciences, 32(1): 68-92. https://doi.org/10.55730/1300-0632.4056