Alessandro Franco*![]() | Emanuele Crisostomi
| Emanuele Crisostomi![]() | Matilde Hammoud
| Matilde Hammoud
This article is part of the Special Issue 8th AIGE/IIETA International conference and 18th AIGE Conference
© 2023 IIETA. This article is published by IIETA and is licensed under the CC BY 4.0 license (http://creativecommons.org/licenses/by/4.0/).
OPEN ACCESS
This paper discusses the use of advanced monitoring techniques for optimal control of building management systems (BMS) in public buildings, with the objective of guaranteeing the appropriate air quality, minimizing energy consumption. The paper reviews the current state of BMS technologies, and the challenges associated with reducing energy consumption in public buildings. It then discusses the potential benefits of advanced monitoring techniques and their application in BMS, including improved energy efficiency, occupant comfort, and indoor air quality. The analysis conducted highlights the challenges in establishing a direct relationship between monitoring data and HVAC system control, emphasizing the potential of Machine Learning algorithms in addressing this issue.
building management systems, energy efficiency, advanced monitoring techniques, public buildings, occupancy sensing, indoor air quality, energy disaggregation
COVID-19 pandemic has brought significant attention to the importance of indoor air quality (IAQ) in public shared buildings and on the role of mechanical ventilation systems in maintaining a healthy indoor environment [1, 2].
With the need for increased air exchange rates and filtration to reduce the risk of virus transmission, many buildings have had to make changes to their Heating, Ventilation and Air Conditioning (HVAC) systems to meet new guidelines and regulations [3].
It is now widely recognized that proper ventilation, air filtration, and IAQ monitoring are essential in maintaining a safe and healthy indoor environment, not just during a pandemic, but also for long-term health and productivity of building occupants. These measures have a significant impact on the energy aspect of building operations [4]. Accordingly, it is expected that in the next few years there will be an increased attention to appropriately manage such two contrasting aspects: the need to ensure safe and healthy indoor environments through proper ventilation, air filtration, and IAQ monitoring, and the need to optimize energy consumption in HVAC systems [5].
One way to balance such two objectives is by using advanced building automation systems and artificial intelligence-based algorithms to optimize HVAC system operation based on real-time occupancy and environmental data [6]. These approaches can control the HVAC system to provide optimal indoor air quality while minimizing energy consumption. It will require a holistic approach that considers the interplay between building design, operation, and maintenance to achieve the best balance between indoor air quality and energy efficiency.
Data-driven methods are essential to achieving the balance between indoor air quality and energy efficiency and will become increasingly important as building design and operation become more focused on sustainability and occupant health [7]. There is a wealth of environmental monitoring data available that can be used to optimize building energy efficiency, but often this data is not fully utilized. Many building management systems (BMS) have sensors and monitoring equipment in place to measure parameters such as temperature, humidity, CO2 levels, and energy consumption, but this data is not always analyzed and used in real-time [8, 9].
By adopting machine learning algorithms to analyze data from environmental sensors, it is possible to identify patterns and anomalies that may indicate inefficient building systems or energy waste [10]. For example, machine learning models can be used to identify the most energy-intensive areas of a building or detect equipment malfunctions that are causing excessive energy consumption [11].
Overall, by leveraging the vast amounts of environmental monitoring data available, building managers can gain valuable insights into building performance and energy use, and take action to optimize building systems for energy efficiency and cost savings. Smart monitoring systems can also be used to detect faults or inefficiencies in building systems, enabling early detection and repair. For example, a smart monitoring system might detect a faulty HVAC system, enabling maintenance staff to repair the system before it consumes excess energy or causes occupant discomfort.
The topic of environmental monitoring, through devices connected in an Internet of Things (IoT) framework, and its connection with the usage and real-time control of energy in public buildings is gathering increasing interest, in consideration of the growing energy costs [12].
IoT technologies can be used for both collecting and exchanging environmental data, to inform building users of any anomalous situation and to directly interact with the operation control of the various energy systems active in the building [13].
The topic has become even more relevant in combination with the post-Covid restrictions, which have imposed some additional constraints related to the ventilation of rooms for the mitigation of the spreading of the disease. Concerns about air quality, indoor comfort and the currently high energy prices now make the development of advanced control logics and the definition of optimal operating modes of HVAC and lighting systems an impelling priority in most country. A significant margin of improvement of current HVAC systems is provided by the fact that air conditioning and ventilation systems are usually designed for certain operating conditions and certain levels of occupancy, which in some cases only occur very rarely. This is particularly true in public buildings, where levels of occupancy may greatly change during the day, and the design of energy systems sized respect to the less favorable occupancy conditions may lead to significant wastes of energy most of the day.
In this paper, we first overview the research topic, with a particular reference to recently carried out monitoring activities in public buildings. Then, we present the development and implementation of a new monitoring system, based on the use of sensors capable of monitoring 9 different environmental variables, namely, lighting, CO2, VOC, noise, gas, temperature, humidity, particulate matter, occupancy). In combination with classic contact sensors (to be aware of the opening of windows and door), we describe how they can be adapted to a specific context, with the purpose of optimally regulating the operation of air conditioning systems.
The idea presented by the authors is indeed to demonstrate the potential of smart monitoring methods, specifically those based on CO2 concentration analysis, in shared-public buildings with non-regular occupancy patterns, such as academic buildings, in which traditional BMS may not be effective, as they rely on fixed schedules and occupancy patterns that do not account for the dynamic and unpredictable nature of such a kind of shared-public buildings.
Smart monitoring systems based on CO2 concentration analysis can provide for example real-time data on occupancy levels and ventilation rates, allowing building managers to adjust heating, cooling, and ventilation systems accordingly [14].
Overall, the authors suggest that smart monitoring systems have great potential to improve energy efficiency and sustainability in shared-public buildings where occupancy patterns can be especially complex and unpredictable.
The methods of Artificial Intelligence (AI) and the various data collection methodologies can be interesting for modelling the complex and non-linear interaction between the different variable [15, 16]. Although there are many research studies and literature available on the use of artificial intelligence in Smart Buildings, only a limited number of recent studies have practically implemented machine learning techniques to optimize the HVAC operation for energy efficiency and indoor environment control. These studies [17, 18] have primarily focused on specific elements related to thermal comfort and building control, which can have substantial impacts on building energy consumption. However, there remain open questions regarding the integration of safety measures.
The paper is organized as follows: after the introduction in which the importance of reducing energy use in public buildings and the role of building management systems (BMS) in achieving this goal, the following sections introduces the concept of advanced monitoring techniques as a means to optimize BMS control. In the second section, the existing literature on the challenges associated with reducing energy use while maintaining occupant comfort and indoor air quality is discussed, and the current state of the art in BMS technology and on advanced monitoring techniques, including sensor technologies, data analytics, and machine learning algorithms is also briefly recalled. The third section describes the methodology used in the study, including the types of sensors and monitoring equipment used, the data collection process, and the analysis methods employed. In the fourth section we present the results of the study, including any insights gained from the data collected and the analysis performed in a specific context. Section includes visualizations such as charts, graphs, and maps. Then the possible implications of our results and their significance for reducing energy use, the limitations of our study and areas for future research are discussed. The final section summarizes the key findings of the study, emphasizing the significance of advanced monitoring techniques in optimizing BMS control for public buildings. The section also highlights the potential role of Machine Learning algorithms in this context, underscoring their possible use for achieving optimal energy efficiency and indoor environmental quality.
Energy consumption in buildings for ventilation and climatization is significant. It is estimated that buildings consume up to 40% of the world's energy and are responsible for approximately 30% of greenhouse gas emissions [19]. HVAC systems are the primary energy consumers in buildings, accounting for up to 60% of a building's energy use. IAQ is also very relevant for internal building environments today.
However, ventilation can be energy-intensive, particularly in buildings with high occupancy levels or where air quality is poor. There are several types of HVAC systems that can be used for public buildings. The type of system used depends on factors such as the size of the building, the number of occupants, the local climate, and the energy efficiency goals of the building owners. Building managers can use advanced monitoring techniques such as occupancy sensing and energy disaggregation to optimize HVAC system performance and reduce energy consumption while maintaining good IAQ. For example, by using occupancy sensors to detect when rooms are unoccupied, HVAC systems can be adjusted to reduce ventilation rates and save energy [20].
Correct regulation of HVAC systems can be challenging, especially in buildings with varying occupancy levels. In such cases, it is important to adopt demand-controlled ventilation systems, which can adjust the ventilation rates based on the actual occupancy of the zones [14]. This can be achieved using direct and indirect occupancy sensors, like CO2 sensors, that can detect the occupancy level and adjust the ventilation rates accordingly.
Typical energy end-uses in shared buildings are shown in Figure 1. Those values range from about 25% for buildings dedicated to Lodging to over 60% for buildings dedicated to public assembly [21].
Figure 1. Energy end-uses in shared buildings
Educational and healthcare buildings are highly significant within the realm of public shared buildings due to their substantial energy consumption, making them a focal point for analysis and investigation [22, 23]. In such buildings, the HVAC share is always greater than 50%, representing the strong influence of these systems on the overall energy consumption. Accordingly, while it is crucial to prioritize the principles of sustainable architecture in new constructions [24] existing buildings often face limitations in implementing such principles a specific attention must be given to the HVAC system in the stages of design and operation of the building, and actions must be undertaken to rationalize the energy use.
The energy waste in public buildings is often attributed to the HVAC system operating at maximum capacity during phases of reduced occupancy. One solution to this issue is to implement smart monitoring systems that can adjust the HVAC system based on real-time occupancy data. This would ensure that the HVAC system only operates at the necessary capacity, reducing energy waste and costs.
Data-driven models can provide more accurate and reliable predictions for building energy management compared to physically based theoretical analysis alone. This is because data-driven models can capture the complex and often non-linear relationships between different variables. By using real-time monitoring data to train and update the model, it can adapt to changing conditions and improve its predictions over time. Therefore, incorporating data-driven models into energy management strategies can help to optimize energy use, reduce costs, and improve indoor comfort and air quality. BMS are automated systems that are used to control and monitor various building functions, including HVAC, lighting, and energy use (Figure 2). The main goal of BMS is to optimize building performance while reducing energy consumption and minimizing operational costs. BMS can be especially effective in public buildings, where energy costs are often high and occupancy levels can vary greatly throughout the day.
BMS work by collecting data from various sensors throughout the building, such as temperature sensors and occupancy sensors, and using that data to make decisions about how to optimize the building's performance. For example, the BMS might adjust the HVAC system based on occupancy levels in different areas of the building or adjust the lighting system based on the amount of natural light available.
Figure 2. Example of building energy management system
BMS can also be used to identify areas where lighting is being used unnecessarily or identify equipment that is consuming excessive amounts of energy.
This section describes the methodology used in the study, including the types of sensors and monitoring equipment used, the data collection process, and the analysis methods employed. The proposed approach involves utilizing temperature sensors to gather data on energy needs and CO2 sensors to monitor ventilation requirements, in order to support the operation of the HVAC system.
3.1 CO2 concentration and connection with occupancy
Monitoring CO2 levels indicates indoor air quality and ventilation system effectiveness in maintaining good IAQ and preventing airborne transmission. CO2 levels can be used to identify poorly ventilated areas, which can increase the risk of airborne transmission of infectious diseases like COVID-19. A consistent indoor air concentration of less than 800 ppm CO2 is likely to indicate that a space is well ventilated, while an average of 1500 ppm CO2 concentration over the occupied period in a space can be considered an indicator of poor ventilation [25]. In areas with continuous talking, singing, or high levels of physical activity, higher levels of ventilation may be required to keep CO2 levels below 800 ppm, given the higher risks of transmission.
It is important to take CO2 measurements at different times and with different occupancies to get a better indication of how the ventilation system is working under different conditions. However, there are some situations where CO2 monitoring may be less informative, such as areas that rely on air cleaning units or large open spaces with high ceilings. Overall, consulting with a ventilation engineer or occupational hygienist can help determine whether CO2 monitoring is required and which type of monitor is best suited for a particular situation. By monitoring CO2 levels, building managers can take appropriate measures to optimize ventilation and reduce the risk of airborne transmission of infectious diseases. In a closed volume the rise of CO2 concentration $\left(\mathrm{C}_{\left\{\mathrm{CO}\,_2\right\}}\,\right)$ depends on the number of occupants. Using an estimate of the production rate $\dot{\mathrm{r}}$, expressed in l/min (e.g., using the production rate as a function of the activity of the individual), knowing the volume V of the room, and measuring the CO2 concentration variation with time $\left(\frac{\mathrm{dC}_{\left\{\mathrm{CO}\,_2\right\}}\,\,\,\,(\mathrm{t})}{\mathrm{dt}}\right)$, then Eq. (1) may be used to estimate the number of occupants, nocc:
$\mathrm{V} \frac{\mathrm{dC}_{\left\{\mathrm{CO}\,_2\right\}}\,\,\,\,(\mathrm{t})}{\mathrm{dt}}=\dot{\mathrm{r}} \mathrm{n}_{\mathrm{occ}}$ (1)
Eq. (1) can be also reformulated in terms of the volume available for each person (V/nocc), which can be considered an accurate variable as long as the height of the room does not exceed the other two dimensions:
$\frac{\mathrm{V}}{\mathrm{n}_{\mathrm{occ}}}=\dot{\mathrm{r}} \frac{1}{\frac{\mathrm{dC}_\,{\left\{\mathrm{CO}\,_2\right\}}\,(\mathrm{t})}{\mathrm{dt}}}$ (2)
From Eq. (2), it is easy to understand how the variation of CO2 concentration can be related to the number of occupants if the rate of generation, strongly correlated with age, activity, and occupant’s behavior, is known. If air ventilation is also considered, then the air ventilation rate Q can be imposed with a mechanical device (or may correspond to the one available under natural conditions, for instance if windows or doors are open), and the new equation becomes:
$\mathrm{V} \frac{\mathrm{dC}_{\left\{\mathrm{CO}\,_2\right\}}\,\,\,\,(\mathrm{t})}{\mathrm{dt}}=\dot{\mathrm{r}} \mathrm{n}_{\mathrm{occ}}-Q\left(\mathrm{C}_{\left\{\mathrm{CO}\,_2\right\}}\,(\mathrm{t})-\mathrm{C}_{\mathrm{ext}}\right)$ (3)
where: Q is the air flow rate due to ventilation (mechanical of natural), in m3/s, and Cext is the outdoor CO2 concentration.
CO2 concentration variation in the room can be written in explicit form, and thus its value at time t, can be estimated as:
$\mathrm{C}_{\left\{\mathrm{CO}_2\right\}}(\mathrm{t})=\mathrm{C}_0(\mathrm{t}=0) \exp \left(-\frac{\mathrm{Q}}{V} \mathrm{t}\right) +\left(\mathrm{C}_{\text {ext }}+\frac{\dot{\mathrm{r}}\, \mathrm{n}_{\mathrm{occ}}}{Q}\right)\left(1-\exp \left(-\frac{Q}{V} \mathrm{t}\right)\right)$ (4)
In all the equations, a fundamental role is played by the CO2 production rate $\dot{\mathrm{r}}$, which depends on different elements (age, weight, and type of activity); typical values of exhalation per person for some typical indoor activities, obtained according to the values [26], where major details about the synthetic description summarized in Eqs. (1)-(4) can be obtained. The idea is to define the appropriate value of ACR, Q, to maintain a maximum value of CO2 concentration in the room. In this way, after a first phase of increase of CO2 concentration, an equilibrium condition is reached. If students are not in the room, the concentration decreases according to:
$\mathrm{C}_{\left\{\mathrm{CO}_2\right\}}(t)=C_0+\left(C_0-C_{\text {ext }}\right) \cdot e^{-\frac{Q}{V} t}$ (5)
In real-world conditions, there are many variables that can affect indoor air quality and the concentration of carbon dioxide (CO2) in a public shared building, including the number of occupants, their activity level, the ventilation rate, and other factors such as opening doors or windows and so on. This complexity can make it difficult to accurately predict changes in CO2 concentrations in real-time conditions using a physically based model alone [27]. In a controlled and closed room environment, a physical model can provide reasonably accurate predictions of the trend of CO2 concentration over time. Factors such as the room's geometry, the number of occupants, and the air flow rate can be incorporated into the model to estimate CO2 levels. However, in real conditions, there are numerous variables that are challenging to control or accurately measure. These can significantly impact CO2 concentrations and render a purely physical model inadequate.
3.2 Sensors for smart monitoring
Measurements in the internal environment of buildings are indeed common and widely conducted for various purposes [28]. Monitoring and measuring different parameters within indoor spaces provide valuable insights into the performance, comfort, and safety of the built environment. The three most common measurements in indoor spaces are:
New sensors for measurements in indoor spaces include some additional measures like:
For the measurement carried out, two sensors, in particular the 4-in-1 and 9-in-1 SmartDHome sensors has been tested (Figure 3).
Those are environmental sensors that can monitor multiple parameters related to IAQ and provide real-time data for smart automation systems thanks to a specific software used. The last appears to be particularly interesting: the 9 parameters that it can monitor include Temperature, Humidity, Light intensity, Noise level, Air pressure, CO2 level, TVOC (Total Volatile Organic Compounds), PM2.5 (Fine Particulate Matter), PM10 (Coarse Particulate Matter).
Figure 3. Smart monitoring sensors used for measurements
3.3 Real time monitoring data and ML algorithm
Collecting data from monitoring analysis involves using sensors and other devices to continuously monitor different parameters such as temperature, humidity, occupancy, lighting, and energy consumption in buildings. The collected data can be used to identify patterns, trends, and anomalies in the building's performance, which can be analyzed to determine where improvements can be made to increase energy efficiency and reduce waste. However, the interconnected nature of these data poses challenges in their direct utilization. However, real time monitoring combined with machine learning algorithms can help overcome these challenges by analyzing large amounts of data and identifying complex patterns and relationships between different variables in the different context. By training machine learning models on data from sensors that measure indoor air quality and other environmental factors. For example, machine learning models can be trained to identify the relationship between CO2 levels and occupancy, activity level, and ventilation rate (induced in mechanical or natural mode) in a particular building. By using this information, the model can predict how CO2 levels are likely to change under different conditions, such as changes in occupancy or ventilation rates.
Moreover, machine learning has the potential to greatly enhance our understanding of indoor air quality and improve our ability to optimize building systems for both energy efficiency and human health. Machine learning methods can be helpful for controlling indoor air quality in several ways:
Predictive modeling: Machine learning algorithms can analyze historical indoor air quality data and predict future air quality levels. This can help building managers proactively identify potential issues and take preventive measures.
Real-time monitoring: Machine learning can process real-time data from sensors to continuously monitor indoor air quality. Algorithms can identify patterns and anomalies in the data and provide alerts to building managers if air quality falls outside of acceptable levels.
Adaptive control: Machine learning algorithms can learn the relationship between air quality, building occupancy, and HVAC system performance. Based on this learning, the algorithms can adjust the HVAC system to optimize indoor air quality while minimizing energy use. Fault detection and diagnosis: Machine learning algorithms can detect faults in the HVAC system that may contribute to poor indoor air quality. The algorithms can then diagnose the root cause of the problem and provide recommendations for corrective action.
The relationship between carbon dioxide and occupancy is straightforward in closed rooms with a fixed number of occupants, but it becomes challenging in real scenarios if the number of occupants is variable like the external conditions. To elucidate the effects of multiple parameters in determining a demand-controlled ventilation strategy, a specific test case has been selected for examination. The initial step entails constructing a dataset that will serve as the foundation for elaboration and analysis.
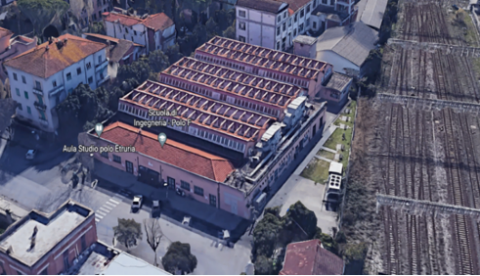
Data were gathered during regular academic activities in a university building. The building is a didactic structure of the University of Pisa and located in Pisa (1694 Heating Degree Days). The building has a floor area of about 2100 m2 and a total volume of 11500 m3. Figure 4 provides a photo in which the buildings object of the analysis is represented.
Figures 5 and 6 provide some details about the classroom where the tests have been performed, while Table 1 summarizes the main geometrical data of the same classroom.
Figure 4. The building object of the analysis
Figure 5. A photo of the classroom from the bottom side
The data presented in the graphics corresponds to the measurements obtained from the sensor 9 in 1, represented in the right part of Figure 3, which was positioned on the desk near the blackboard in the teacher's location, as indicated by the red circle. However, it's important to note that there were also other sensors placed in three different positions within the classroom. The positions are represented by the yellow, green and blue circles in Figure 6.
Table 1. Characteristics of the classrooms for the analysis
|
Maximum Occupancy (Pers) |
Area (m2) |
Height (m) Min-max |
V (m3) |
V for Student at Maximum Occupancy (m3) |
|
140 |
131 |
3.05-3.55 |
438 |
3.13 |
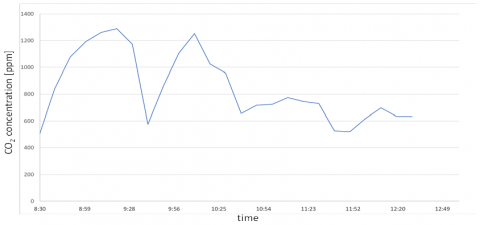
Our measurements of a single classroom across six different days in the period between 18/04 and 9/05 shows that even when the sequence of lessons and climatic conditions and occupancy profile remained consistent, the CO2 concentration levels varied significantly (see Table 2 and Table 3 for the details on the various experiments). This highlights the complexity of relying solely on physical models for predicting and optimizing indoor air quality and energy use and emphasizes the importance of real-time monitoring data. Figures 7-12 provide the results of a test case carried out in the period from 18/04 to 9/05 in six different cases of the same lessons, for what concerns CO2 concentration trend. Though if the room used for the tests was the same and the number of occupants similar (from 100 to 120 in the first lesson of two hours from 8:30 to 10:30 and a number variable between 70-80 in the second lesson from 10:30 to 12:30) the operating conditions were different.
Figure 6. A plan of the classroom including lateral sections (the circular point represents the position of the sensors)
Considering the results exposed in Figures 7-12, observing the results provided in Figure 9, i.e., the one in which mechanical ventilation was active at 100%, the maximum level of CO2 concentration is below the limit level of 1500 ppm, in particular below 1300 ppm. All the other cases mechanical ventilation was not in action, but windows and doors were closed or partially open. As it can be observed, the results are all different. The maximum CO2 concentration level range from 1400 ppm (Figure 11) up to 3300 ppm (Figure 10).
Table 2. Occupancy and ventilation in the tested cases
|
Case |
Number of Occupants 8:30-10:30 |
Number of Occupants 10:30-12:30 |
Mechanical Ventilation |
|
18/04 |
120 |
80 |
NO |
|
21/04 |
100 |
75 |
NO |
|
28/04 |
106 |
77 |
YES |
|
2/05 |
105 |
75 |
NO |
|
5/05 |
105 |
77 |
YES |
|
9/05 |
105 |
70 |
YES (after 10:30) |
The maximum level is observed if all the windows and doors are closed, but when natural ventilation is active, because just one door or one windows is open, in connection with an occupancy level of 50-60% of the maximum this could be sufficient to maintain the level of CO2 concentration below 1200 ppm.
Table 3. More detailed description of the tested cases
|
Case |
8:30-10:30 |
10:30-12:30 |
|
18/04 |
Pause 9:35-9:45 Windows open after 9.45 T = 20.4 - 25.2℃ |
Pause 11:20-11:40 Windows always open T = 24.8 - 26.0℃ |
|
21/04 |
Pause 9:30-9:40; Windows open after 9:40. T = 20.2 - 24.7℃ |
Pause 11:15:11:30 Windows are open T = 24.7 - 25.6℃ |
|
28/04 |
Pause 9:25 - 9:35 Windows open 9:25- 9:30 Windows open 10:15-10:30 T = 19.4 - 25.3℃ |
Pause 11:35 - 11:45 Windows closed T = 25.2 - 25.7℃ |
|
2/05 |
Pause 9:30 - 9:40 A window open at 9:40 T = 20.4 - 25.7℃ |
Pause 11:30 - 11:40 Windows open T = 25.0 - 26.1℃ |
|
5/05 |
Pause 9:30-9:40 Windows open after 9:40 T = 21.0 - 26.3℃ |
Pause 11:15 – 11:35 Windows always open T = 26.0 - 26.9℃ |
|
9/05 |
Pause 9:35- 9:45 Windows open 9:35-9:45 T = 22.2 - 27.7℃ |
Pause 11:15-11:30 Windows always open T = 27.5 - 27.7℃ |
The analysis of the results in the graphs reveals interesting patterns related to the behaviour of occupants and the presence of openings in the classroom. During the first interval, which had a higher occupancy of more than 100 people, we observe a gradual increase in CO2 concentration over time.
In the second time interval, with a lower occupancy of about 80 people, we observe a different trend in the CO2 concentration. The initial CO2 concentration is lower compared to the previous interval, suggesting that the lower occupancy has resulted in lower CO2 generation. Additionally, there are fluctuations in the CO2 concentration, which could be attributed to the opening and closing of doors or windows during this time interval. These openings allow for natural ventilation and the exchange of air with the outdoor environment, leading to temporary reductions in CO2 concentration.
These results highlight the importance of considering occupant behavior and the presence of openings in the analysis of CO2 concentration and ventilation effectiveness. It emphasizes the need for dynamic control strategies that adapt to varying occupancy levels and take into account the impact of openings on indoor air quality.
Based on the analysis of monitoring data collected under similar conditions, it appears that relying solely on physical models for analysis can be challenging.
The analysis conducted on the monitored data provides valuable insights into the limitations of physical-based models in evaluating indoor air quality (IAQ) and comfort parameters. One of the key findings is the complexity involved in accurately predicting IAQ and comfort solely based on physical models. Physical models typically rely on simplified assumptions and equations that consider factors such as room dimensions, occupancy and ventilation rates. Moreover, these models often struggle to capture the dynamic nature of IAQ and comfort conditions in real scenarios, because they may not adequately account for variations in occupant behavior, changes in outdoor air conditions, and the impact of openings or airflow patterns within the building.
By comparing the monitored data with the predictions of physical models, it becomes evident that there are discrepancies between the two. The measured IAQ and comfort parameters exhibit variations and trends that cannot be fully explained by the physical models alone. This highlights the limitations of relying solely on these models to evaluate IAQ and comfort. The complexities and interactions among different variables, such as occupancy, ventilation rates, pollutant sources, and thermal conditions, make it challenging to accurately capture the actual IAQ and comfort levels using physical models. This underscores the need for alternative approaches, such as data-driven modeling and machine learning, which can leverage the abundance of monitoring data to provide more accurate and nuanced evaluations of IAQ and comfort parameters.
Figure 7. Test of 18/04/2023 (no mechanical ventilation)
Figure 8. Test of 21/04/2023 (no mechanical ventilation)
Figure 9. Test of 28/04/2023 (ACR fixed at 3 Vol/h)
Figure 10. Test of 2/05/2023 (no mechanical ventilation)
Figure 11. Test of 5/05/2023 (ACR fixed at 3 Vol/h on)
Figure 12. Test of 9/05/2023 (no mechanical ventilation)
CO2 measurement is indeed an interesting approach as it provides an indirect measure of occupancy in indoor spaces. Since humans’ exhale CO2, the concentration of CO2 in the air can be used as an indicator of the number of people present in each space. By monitoring CO2 levels, it is possible to estimate occupancy density and make informed decisions regarding ventilation requirements. CO2 levels are influenced by other factors in addition to occupancy, such as the ventilation rate, outdoor air quality, and indoor sources of CO2. Therefore, it is important to collect data on other variables such as temperature, humidity, and air flow rates, to accurately assess indoor air quality and make informed decisions for building management. Advanced data analytics techniques, such as machine learning algorithms, can be used to identify patterns and relationships between different variables and provide insights for optimizing building performance.
Optimizing energy use in public shared buildings through data monitoring is indeed a quite complex task. It requires the collection of a large amount of data from various sensors and sources, such as occupancy sensors, temperature sensors, humidity sensors, lighting sensors, CO2 sensors, and HVAC system sensors. To make sense of this data, advanced analytics techniques can be applied, such as machine learning and artificial intelligence algorithms. These techniques can identify patterns and correlations among the different variables and create models that can predict the energy consumption based on different scenarios.
Indeed, the prediction of energy consumption through machine learning algorithms has a number of significant advantages. First, energy consumption may be optimized not merely instantaneously on the basis of current real-time data, but also in a future horizon of time, based on predicted occupancy levels, weather conditions, and other factors. Solutions obtained in a future horizon of time can conveniently exploit periodic patterns (e.g., daily or weekly patterns), and provide more convenient solutions in terms of energy consumption. Also, such predictions may be used to select between two possible control actions, predicting their future impact (e.g., choosing between natural or mechanic ventilation). Second, machine learning algorithms can be used to identify the occurrence of non-correct or non-nominal environmental conditions and recommend corrective actions to mitigate energy consumption. Examples may be represented by windows that are left open in winter time, which could be conveniently closed; or rooms that are unexpectedly empty, so that mechanic ventilation may be switched off.
The realization of such techniques requires the availability of a robust data management system in place to collect, store, and process the data from various sensors and sources. In order to optimize HVAC performance using monitoring data, it is crucial to have skilled experts who can analyze the data and develop strategies to minimize energy consumption without compromising indoor air quality and occupant comfort. However, this task can be expensive and time-consuming, especially for organizations like universities with diverse structures and campuses. In this scenario, Artificial Intelligence (AI) can play an important role in collecting and processing data from various sensors that measure different variables in indoor spaces, such as the number of occupants, the opening and closing of doors and windows, and the operation of the ventilation system. By analysing this data, AI algorithms can identify patterns and correlations that are difficult to detect, providing insights that can help to optimize energy use. In this way, AI can help building managers make informed decisions about when to adjust HVAC settings, when to open or close windows, and how to optimize the use of lighting and other energy-consuming systems. In particular we refer to Machine Learning (ML) as a subset of AI that refers to the ability of a computer or a machine to learn from data and improve its performance on a specific task without being explicitly programmed for the purpose. In particular the acquired data can be utilized to instruct the Machine Learning algorithm, enabling us to evaluate its performance under various conditions. This includes analyzing its response to factors such as the number of occupants, individual volume available, ventilation rate, and external conditions like temperature and CO2 levels.
The paper highlights the potential benefits of utilizing environmental monitoring data for optimizing building energy efficiency, because such data are often underutilized due to various technical, financial, and institutional challenges.
The importance of leveraging data-driven approaches to optimize building management systems and achieve energy efficiency goals while prioritizing occupant well-being has been emphasized. A building located at the University of Pisa served as the test case for evaluating the potential for connecting monitoring data and operation.
Through the analysis of monitoring data, it has become evident that relying solely on physical models for predictions and decision-making is challenging. The interplay and complexity of multiple variables necessitate more advanced techniques, such as machine learning, to capture intricate relationships and patterns.
Overall, the combination of smart monitoring today available through simple and economic devices, data connectivity, and machine learning presents a promising avenue for achieving sustainable and energy-efficient buildings that prioritize occupant well-being and contribute to healthy environment. The authors of this study are focusing attention on developing a specific machine learning algorithm tailored to interact with the HVAC plant. The goal is to create an intelligent system that can optimize the operation of the HVAC system based on real-time data and predictive modeling.
The Authors gratefully acknowledge the financial support of the Tuscany Region, in the framework of the Research Project “Riaperture in Sicurezza post-Covid: monitoraggio Ambientale e modelli organizzativi innovativi integrati nel sistema TOSCANA financed in the general program RE-START TOSCANA (BANDO RICERCA COVID 19 TOSCANA, Bando pubblico regionale per progetti di ricerca e sviluppo) – CUP. I55F21002530002”.
|
A |
Floor area of the classroom [m2] |
|
|
ACR |
Air Change Rate [l/s] |
|
|
ACRH |
Hourly Air Change Rate [Vol/h] |
|
|
C |
Concentration in the environment [ppm] |
|
|
nocc |
number of occupants of indoor space [-] |
|
|
Q |
Volumetric air change rate [m3/s] |
|
|
r ̇ |
CO2 generation rate for person [l/min] |
|
|
t |
time interval [s] |
|
|
T |
Temperature [℃] |
|
|
V |
Volume of the room or of the structure [m3] |
|
|
Subscripts |
||
|
0 |
Initial value |
|
|
ext |
External value |
|
[1] Megahed, N.A., Ghoneim, E.M. (2021). Indoor air quality: Rethinking rules of building design strategies in post-pandemic architecture. Environmental Research, 193: 110471. https://doi.org/10.1016/j.envres.2020.110471
[2] Ding, J., Yu, C.W., Cao, S.J. (2020). HVAC systems for environmental control to minimize the COVID-19 infection. Indoor and Built Environment, 29(9): 1195-1201. https://doi.org/10.1177/1420326X20951968
[3] Guo, M., Xu, P., Xiao, T., He, R., Dai, M., Miller, S.L. (2021). Review and comparison of HVAC operation guidelines in different countries during the COVID-19 pandemic. Building and Environment, 187: 107368. https://doi.org/10.1016/j.buildenv.2020.107368
[4] Asim, N., Badiei, M., Mohammad, M., Razali, H., Rajabi, A., Chin Haw, L., Jameelah Ghazali, M. (2022). Sustainability of heating, ventilation and air-conditioning (HVAC) systems in buildings—An overview. International Journal of Environmental Research and Public Health, 19(2): 1016. https://doi.org/10.3390/ijerph19021016
[5] Kong, M., Dong, B., Zhang, R., O'Neill, Z. (2022). HVAC energy savings, thermal comfort and air quality for occupant-centric control through a side-by-side experimental study. Applied Energy, 306: 117987. https://doi.org/10.1016/j.apenergy.2021.117987
[6] Cho, J.H., Moon, J.W. (2022). Integrated artificial neural network prediction model of indoor environmental quality in a school building. Journal of Cleaner Production, 344: 131083. https://doi.org/10.1016/j.jclepro.2022.131083
[7] Zhang, W., Wu, Y., Calautit, J.K. (2022). A review on occupancy prediction through machine learning for enhancing energy efficiency, air quality and thermal comfort in the built environment. Renewable and Sustainable Energy Reviews, 167: 112704. https://doi.org/10.1016/j.rser.2022.112704
[8] Ahmad, M.W., Mourshed, M., Mundow, D., Sisinni, M., Rezgui, Y. (2016). Building energy metering and environmental monitoring–A state-of-the-art review and directions for future research. Energy and Buildings, 120: 85-102. https://doi.org/10.1016/j.enbuild.2016.03.059
[9] Martín-Garín, A., Millán-García, J.A., Baïri, A., Millán-Medel, J., Sala-Lizarraga, J.M. (2018). Environmental monitoring system based on an Open Source Platform and the Internet of Things for a building energy retrofit. Automation in Construction, 87: 201-214. https://doi.org/10.1016/j.autcon.2017.12.017
[10] Himeur, Y., Elnour, M., Fadli, F., Meskin, N., Petri, I., Rezgui, Y., Bensaali, F., Amira, A. (2022). AI-big data analytics for building automation and management systems: A survey, actual challenges and future perspectives. Artificial Intelligence Review, 54: 4929-5021. https://doi.org/10.1007/s10462-022-10286-2
[11] Rafati, A., Shaker, H.R., Ghahghahzadeh, S. (2022). Fault detection and efficiency assessment for HVAC systems using non-intrusive load monitoring: A review. Energies, 15(1): 341. https://doi.org/10.3390/en15010341
[12] Mazhar, T., Malik, M.A., Haq, I., Rozeela, I., Ullah, I., Khan, M.A., Adhikari, D., Othman, M.T.B., Hamam, H. (2022). The role of ML, AI and 5G technology in smart energy and smart building management. Electronics, 11(23): 3960. https://doi.org/10.3390/electronics11233960
[13] Franco, A. (2022). An ICT platform based on a multi-objective control systemic approach for reducing energy use in public buildings. In IOP Conference Series: Earth and Environmental Science, 1106: 012002. https://doi.org/10.1088/1755-1315/1106/1/012002
[14] Franco, A., Schito, E. (2020) Definition of optimal ventilation rates for balancing comfort and energy use in indoor spaces using CO2 concentration data. Buildings, 10(8): 135. https://doi.org/10.3390/buildings10080135
[15] Baduge, S.K., Thilakarathna, S., Perera, J.S., Arashpour, M., Sharafi, P., Teodosio, B., Mendis, P. (2022). Artificial intelligence and smart vision for building and construction 4.0: Machine and deep learning methods and applications. Automation in Construction, 141: 104440. https://doi.org/10.1016/j.autcon.2022.104440
[16] Merabet, G.H., Essaaidi, M., Haddou, M.B., Qolomany, B., Qadir, J., Anan, M., Al-Fuqaha, A., Abid, M.R., Benhaddou, D. (2021). Intelligent building control systems for thermal comfort and energy-efficiency: A systematic review of artificial intelligence-assisted techniques. Renewable and Sustainable Energy Reviews, 144: 110969. https://doi.org/10.1016/j.rser.2021.110969
[17] Yang, S., Wan, M.P., Chen, W., Ng, B.F., Dubey, S. (2020). Model predictive control with adaptive machine-learning-based model for building energy efficiency and comfort optimization. Applied Energy, 271: 115147. https://doi.org/10.1016/j.apenergy.2020.115147
[18] Walker, S., Khan, W., Katic, K., Maassen, W., Zeiler, W. (2020). Accuracy of different machine learning algorithms and added-value of predicting aggregated-level energy performance of commercial buildings. Energy and Buildings, 209: 109705. https://doi.org/10.1016/j.enbuild.2019.109705
[19] IEA Global Status Report for Buildings and Construction 2019, IEA, Paris. (2019). https://www.iea.org/reports/global-status-report-for-buildings-and-construction-2019.
[20] Franco, A., Miserocchi, L., Testi, D. (2021). HVAC energy saving strategies for public buildings based on heat pumps and demand controlled ventilation. Energies, 14(17): 5541. https://doi.org/10.3390/en14175541
[21] Odyssee-Mure Energy Efficiency Trends and Policies in the Household and Tertiary Sectors - an Analysis Based on the ODYSSEE and MURE Databases. (2015). https://www.odyssee-mure.eu/publications/archives/energy-efficiency-trends-policies-buildings.pdf.
[22] Marino, C., Minichiello, F., Ronga, P. (2016). Thermal-Hygrometric and energy performance analysis of HVAC systems for educational buildings in southern Europe. International Journal of Heat and Technology, 34(S2): S573-S580. https://doi.org/10.18280/ijht.34S253
[23] Alsawaf, E.S., Albadry, A.M. (2022). Principles for the sustainable design of hospital buildings. International Journal of Sustainable Development & Planning, 17(6): 1797-1808. https://doi.org/10.18280/ijsdp.170614
[24] Altuhaf, A.A., Mahmoud, K.F., Alaane, T.I. (2023). Strategies of employing the principles of sustainable architecture in modern buildings. International Journal of Sustainable Development & Planning, 18(4): 1007-1015. https://doi.org/10.18280/ijsdp.180403
[25] Khovalyg, D., Kazanci, O.B., Halvorsen, H., Gundlach, I., Bahnfleth, W.P., Toftum, J., Olesen, B.W. (2020). Critical review of standards for indoor thermal environment and air quality. Energy and Buildings, 213: 109819. https://doi.org/10.1016/j.enbuild.2020.109819
[26] Emmerich, S.J., Persily, A.K. (2001). State-of-the-art review of CO2 demand controlled ventilation technology and application. National Institute of Standards and Technology Internal Report.
[27] Franco, A., Leccese, F. (2020). Measurement of CO2 concentration for occupancy estimation in educational buildings with energy efficiency purposes. Journal of Building Engineering, 32: 101714. https://doi.org/10.1016/j.jobe.2020.101714
[28] Anastasi, G., Bartoli, C., Conti, P., Crisostomi, E., Franco, A., Saponara, S., Testi, D., Thomopulos, D., Vallati, C. (2021). Optimized energy and air quality management of shared smart buildings in the COVID-19 scenario. Energies, 14(8): 2124. https://doi.org/10.3390/en14082124