Glenda Guadalupe-Méndez![]() | Julio Vargas-Jiménez
| Julio Vargas-Jiménez![]() | Fernando Morante-Carballo
| Fernando Morante-Carballo![]() | Joselyne Solórzano
| Joselyne Solórzano![]() | Josué Briones-Bitar*
| Josué Briones-Bitar*![]() | Paúl Carrión-Mero
| Paúl Carrión-Mero![]()
© 2023 IIETA. This article is published by IIETA and is licensed under the CC BY 4.0 license (http://creativecommons.org/licenses/by/4.0/).
OPEN ACCESS
Obtaining dynamic soil parameters is key to assessing hazards in civil works. Soil characterisation contemplates field measurements and interpretations that require a comprehensive analysis for the design to offer guarantees. The Palestina-Ecuador canton is affected by heavy rains in winter, cutting off more than 16,000 inhabitants. The integral study of effective techniques for constructing bridges is a priority for the sector's economic development. This work aims to obtain dynamic parameters through the correlation of tests (Standard Penetration Test) SPT and seismic refraction for the characterisation and viable design of civil works in the Palestina-Ecuador canton. The research methodology consists of three phases: 1) Approach to fieldwork by gathering basic information; 2) Field measurements (SPT tests and seismic lines) and laboratory; 3) Correlation and analysis P-wave seismic velocity (Vp) and SPT for determination of dynamic parameters. The subsoil presents Quaternary alluvial sediments, where soft clays and loosely compacted silts predominate. The execution of 140 SPT tests in the laboratory of eight perforations allowed the correlation with six seismic refraction lines in the four precincts of interest for the construction of bridges: El Carmen, La Corona, Las Peñas, and Lagarto estuary, the field tests were distributed. The technical analysis resulted in a linear regression equation that correlates N60-Vp and the establishment of in-situ dynamic parameters (Cohesion and internal friction angle). These calculations made it possible to formulate a correlation equation that presents a validated method for this canton, due to data correlation; providing a tool that allows a detailed and economic characterisation for the rural sector. However, it is necessary to establish other places of analysis to strengthen the proposed equation.
geotechnical characterisation, applied geophysics, soil dynamic parameters, soil analysis, regression equation
Given the complex geological and geotechnical conditions, construction areas and buildings require various design techniques to ensure their reliability and meet the requirements and construction time expectations [1, 2]. Geotechnical engineering deals with applying science and technology within civil engineering concerning multiple aspects of the terrain, such as the nature of the materials on the earth's surface (soil or rocks) [3, 4]. Geotechnics has an essential role in the control of several geotechnical problems in the field, such as differential settlements [5, 6], landslides or rockfall [7-9] and infiltrations [10]. Therefore, it is necessary to have a comprehensive study of detailed information on the subsoil and evaluate its geological characteristics before any construction.
The distribution and characteristics of the subsoil vary from one place to another. There are two types of exploration for carrying out the geotechnical studies of a project, such as destructive and non-destructive methods [11]. Among the destructive methods are tests such as test pits [12, 13]; Static cone (CPT) [14] or dynamic (DCP) [15]; Dilatometer [16, 17]; and the Standard Penetration Test (SPT) [18, 19]. Non-destructive methods are geophysical tests widely used in engineering fields to study the subsoil [20]. These use different techniques and properties materials regarding wave speed [21], electrical resistivity [22], radioactivity [23], and gravity [24].
Implementing geophysical techniques and the direct test is a global standard approach in field research [25]. Among the geophysical methods, several researchers have shown that the seismic refraction (SR) test is an efficient alternative; since it consumes less time and is profitable [26-28]. SPT is a method that was developed in the United States in 1925 [29]. It consists of a mechanical set that, by using a hammer (63.5 kg and 0.76 m drop), samples a quantity of soil material (15-30cm) [30]. The SR is suitable for exploration on the surface or deep underground to obtain a subsurface profile [31]. In addition, seismic velocity profiles can be obtained from the travel times of seismic waves (e.g., P-waves) [32]. Likewise, among the most used direct tests in conjunction with the SR is the Standard Penetration Test (SPT) [20, 21, 33]. Since the last decades, interest in combining these two assays has increased, as it provides better accuracy in lithology and subsurface structures.
Ecuador is a country constantly threatened by geological and geomorphological phenomena, such as earthquakes [34]; liquefaction [35]; landslides [36]; subsidence [37]. Due to these threats, there have been significant human and economic losses and damage to civil structures (bridges, buildings, roads) and emergency civil works (such as Hospitals and Schools). For this reason, the Ministry of Urban Development and Housing (MIDUVI) in 2014 [38] mentions that for a correct and complete characterisation of the subsoil within any civil works project, it is necessary to include field exploration methods such as a) Direct or destructive; and b) Indirect or non-destructive.
In the Palestina canton, in the community of Macul, the Public Works Ministery (due to the needs of the community) planned the construction of four bridges in the area: El Carmen, La Corona, Las Peñas, and Lagarto estuary. Due to the presence of expansive and plastic clay, the soil presents low permeability characteristics. This type of material makes the soil very prone to the accumulation of water on the surface, which makes it difficult to drain and favours the easy flooding of the lowlands. This accumulation of water in the winter season affects the main economic source of the canton, agriculture, closing roads and making communication with nearby provinces difficult. Therefore, the soils' characterisation for the four bridges' construction is of such importance that the design offers guarantees by current regulations (Ecuadorian Construction Standard-NEC [38]).
Around the world, there are several studies on a theoretical relationship or correlation between destructive methods (e.g., SPT) and non-destructive methods (e.g., SR). Moreover, since the last decades, the interest of several authors increased in proposing a theoretical relationship to correlate geotechnical data (e.g., SPT) and geophysical data (e.g., seismic refraction) in-situ:
In Palestina (Ecuador), in the rural part, a study that empirically relates these methods and allows obtaining the dynamic parameters of the subsoil would be of great importance. In addition, there is a lack of studies regarding P-wave velocity and SPT hit count in Quaternary alluvial soils of tropical countries. Therefore, the study would help geotechnical engineers interpret subsurface information based on seismic refraction method data.
Therefore, the following question arises: How to establish a relationship between SPT and Seismic Refraction tests, to obtain dynamic parameters in soils of the Palestina Canton? Therefore, the present study aims to obtain images of the soil profile and dynamic parameters by correlating the data of P-wave seismic velocity (Vp) and SPT tests to determine the lithology and soil characteristics that allow the characterisation and design of civil works.
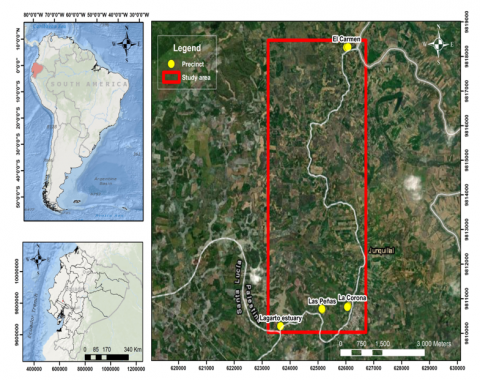
Palestina, a canton of the Guayas province (Ecuador), is located 80 km from Guayaquil and approximately 17 km from the cantonal head on the road to Vinces (Figure 1). The temperatures in the study area oscillated between 20-35℃ throughout the year [42].
There are approximately 16,100 inhabitants in the study sector, with 68% actively economic persons (acronym in spanish PEA). The main economic activities are agriculture, livestock, and crafts [43]. According to the National Institute of Statistics and Census (acronym in spanish INEC), 49.4% of people belong to rural areas, and 44.2% are young people between 18-20 years old. In large part of the Palestina canton are rice mills, cheese-making places, and craft stalls (elaboration of mounts, home furniture with fine woods such as teak, laurel and guayacan).
Figure 1. The geographical location of the study area. Source: modified from [44]
In the project area, the subsoil comprises Quaternary alluvial sediments from the constant flooding of rivers and their estuaries, where soft clays and loosely compacted silts predominate. Currently, the soils of the El Carmen, La Corona, Las Peñas, and Lagarto estuary precincts present loosely packed silty sands or rigid over-consolidated clays. Due to the rain, these rural sectors lose communication, product output, and lack of communication between communities.
The research development consisted of reconnaissance visits and field tests; In addition, the analysis of soil samples under laboratory conditions in four (4) points of the Palestina canton (El Carmen, La Corona, Las Peñas and Estero Lagarto). With this, it was possible to propose an empirical correlation between geophysical data (Vp) and geotechnical data (SPT), in addition to relating dynamic parameters (cohesion-C and phi-Φ). Implementing these methodological steps will allow for finding an equation, which with the seismic refraction data, can give an idea of the geotechnical characteristics of the soil based on the relationship generated with the data in four sites of Palestina.
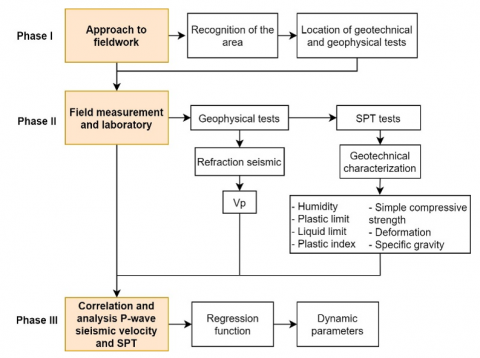
The field, laboratory and office activities were planned to obtain results and respond to the stated aim. Figure 2 schematics the executed methodological framework.
Figure 2. Methodological scheme and activities carried out in this work
3.1 Phase I: Fieldwork proposal
This phase focused on collecting and processing geographic and geological information on the site and its surroundings. The base information came from online searches (e.g., Scopus), institutional repositories (e.g., Universidad Técnica de Babahoyo-UTB) and public institutions (e.g., INEC).
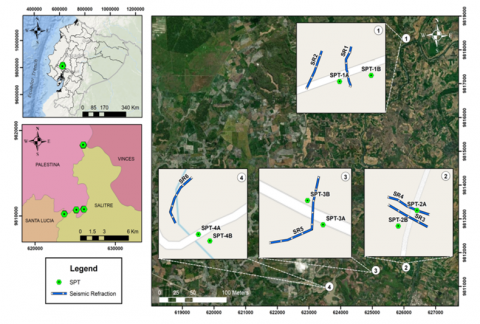
The general information of the study site gave way to the planning of the fieldwork. Prior recognition of the place (in-situ) was necessary to determine the tests' strategic points (sites). Figure 3 shows the location of the geotechnical and geophysical tests. Table 1 shows the coordinates of the center of each seismic line, where the equipment (Terraloc Pro-2) was placed, and the coordinates of the SPTs. SR1 and SR2 correspond to the El Carmen precinct, SR3 and SR4 to the La Corona precinct, SR5 to the Las Peñas precinct, and SR6 to the Lagarto estuary.
Figure 3. Fieldwork location map (SPTs and SR)
Table 1. The geographical location (X, Y) of the fieldwork
|
Seismic refraction (SR) |
SPTs |
|||||
|
# Test |
Midpoint coordinates |
# Test |
Coordinates |
|||
|
X |
Y |
X |
Y |
|||
|
SR1 |
626039 |
9818287 |
SPT-1A |
626027 |
9818263 |
|
|
SR2 |
625984 |
9818281 |
SPT-1B |
626012 |
9818273 |
|
|
SR3 |
626068 |
9810779 |
SPT-2A |
626082 |
9810787 |
|
|
SR4 |
626069 |
9810792 |
SPT-2B |
626054 |
9810765 |
|
|
SR5 |
625148 |
9810689 |
SPT-3A |
625156 |
9810690 |
|
|
SPT-3B |
625145 |
9810706 |
||||
|
SR6 |
623637 |
9810242 |
SPT-4A |
623659 |
9810209 |
|
|
SPT-4B |
623670 |
9810203 |
||||
3.2 Phase II: Field and laboratory measurements
3.2.1 Geotechnical characterisation
For the geotechnical characterisation, it was possible to carry out eight Standard Penetration Tests (SPTs) (in the field) (ASTM-1586-11) [45], obtaining representative soil samples in each meter (1.00) of drilling (up to 5 meters deep) and then every 1.50 meters (until the end of the perforation). These samples are then tested under laboratory conditions to obtain geotechnical parameters (e.g., moisture content, No. 200 pass, liquid limit, plastic limit, plastic index, and soil classification) as described in Table 2. Table 2 lists the standards used in each of these tests. In this research, ASTM standards were used.
Table 2. Laboratory parameters obtained from soil samples from Palestina
|
Test |
American Society for Testing and Materials (ASTM) standards |
|
Moisture content |
ASTM–D–2216-19 [46] ASTM–D–2974-14 [47] |
|
Material finer than sieve No. 200 |
ASTM–D–1140 -00 [48] |
|
Liquid limit, Plastic limit and Plastic index |
ASTM–D–4318 -17 [49] |
|
Soil classification |
ASTM–D–2487-17 [50] |
The moisture content test determines the water content per mass of material (e.g., soil and rock) [46, 47, 51]. Material finer than No. 200 is determined by the amount that passes the 75 µm sieve [48]. The liquid limit of soil is the moisture content (in percentage) when it is in the limit between plastic and liquid state [49, 52]. The plastic limit of soil is the moisture content (in percentage) when it is on the limit between plastic and semisolid state [49]. The plasticity index is the water content (in percentage) in which soil behaves plastically [49, 53]. Finally, soil classification allows to know the soil type for engineering purposes based on their characteristics (e.g., particle size, liquid limit, and plasticity index) [50, 54].
3.2.2 Geophysical tests
For the determination and correlation of lithology data in the study area, the geophysical tests consisted of six (6) seismic lines to determine P-wave (Vp) seismic velocity data (ASTM-D-5777-18) [55] (Figure 4).
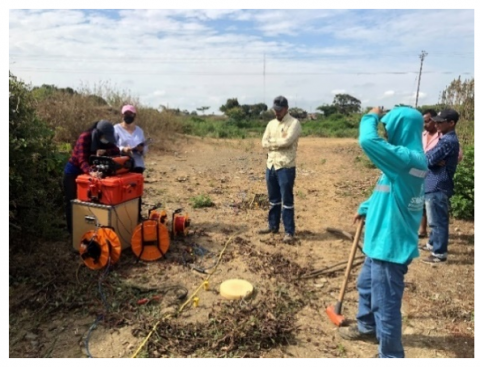
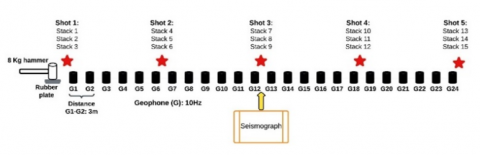
All seismic lines are 69 meters long, with a separation between geophones (10Hz) of three (3) meters, and a seismic line of 24 meters, with a separation between geophones of one (1) meter. The energy source used to produce the seismic waves was an eight (8) kg hammer. This weight struck five (5) points within each seismic line. Making three (3) shots (stacks) with the hammer was necessary for each of the five points (Figure 5). The data storage was automatic in the ABEM Terraloc Pro-2 seismograph, and the processing through the IXREFRAX software allowed the interpretation of results [56].
Figure 4. Field data collection of seismic line 1 (SR1)
Figure 5. Seismic line data collection scheme
3.3 Phase III: Vp and SPT correlation and analysis
Data correlation between P-wave velocity values and subsurface geology was possible from SPT geotechnical results (Table 1). For this, the linear or polynomial regression arose with the field and laboratory data obtained in the Excel program. According to the different trends in the equations obtained, R2 shows the equation with the best correlation. According to Yusof & Zabidi [57] and Taylor [58], the correlation coefficient (R2) represents the degree of linear association between two variables. A relationship between 0.7< R2<1.0 is considered a strong one.
The literature review allowed the search for correlations between the geophysical data (Vp) and geotechnical dynamic parameters (cohesion-c and phi-Φ) in the available databases (Scopus) and a search engine (Google scholar).
4.1 Laboratory analysis
Table 3 presents the results of the geotechnical properties of the eight (8) SPTs carried out (Figure 3 and Table 1). According to the SUCS (Unified Soil Classification System) classification, the surface layer (from 0.0 to 6.5 meters deep) has SM (silty sand) and ML (silt) soils. Other results of these silty soils are: i) Moisture (%): 25.3-58.4; ii) Liquid Limit (LL) (%): 26.0-45.0; iii) Plastic limit (PL) (%): 26.0-36.0; iv) Plastic index (PI) (%): 5-14; and v) #200 (%): 59-97.
While according to the SUCS, the deepest layers (from 6.0 to 12.5 meters deep) are HM (high plasticity silt) and CH (high plasticity clay) soils. The results of the laboratory tests of these soils are: i) W (%): 35.5-153.0; ii) LL (%): 50-138; iii) PL (%): 26-65; iv) PI (%): 12-73; and v) #200 (%): 55-100.
Table 3. Summary of the laboratory test results, and the samples obtained in the different SPT
|
SPT |
Deep (m) |
SUCS |
PI (%) |
#200 (%) |
|
1A |
0.0-6.5 |
SM |
6-8 |
66-88 |
|
6.5-11.0 |
SM |
Not plastic |
9-25 |
|
|
1B |
0.0-6.5 |
SM |
5-8 |
89-97 |
|
6.5-12.5 |
SM |
Not plastic |
30-34 |
|
|
2A |
0.0-4.0 |
SM-ML |
Not plastic |
32-51 |
|
4.0-12.5 |
CH |
51-89 |
96-99 |
|
|
2B |
0.0-4.0 |
SM-ML |
Not plastic |
59-89 |
|
4.0-12.5 |
MH-CH |
29-51 |
76-97 |
|
|
3A |
0.0-3.0 |
MH |
33-37 |
84-92 |
|
3.0-12.5 |
MH |
8-32 |
55-94 |
|
|
3B |
0.0-3.0 |
SM |
35-36 |
78-89 |
|
3.0-12.5 |
MH |
12-27 |
85-99 |
|
|
4A |
0.0-2.85 |
SM |
11-14 |
68-76 |
|
2.85-11.0 |
MH-CH |
28-73 |
90-100 |
|
|
4B |
0.0-2.0 |
SM |
Not plastic |
35-80 |
|
2.0-11.0 |
MH-CH |
32-53 |
77-100 |
(a)
(b)
(c)
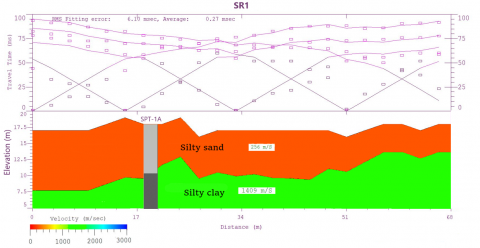
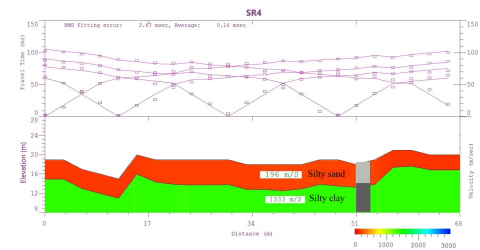
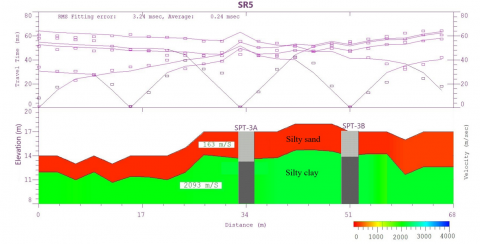
Figure 6. Correlation between the SPT and SR: a) SR1 y SPT-1A; b) SR4 y SPT-2A; y c) SR5 y SPT-3A/SPT-3B
Table 4. Summary of the correlation between the SRs and SPTs
|
SRs |
SPTs |
Deep (m) |
Soil type |
Vp (m/s) |
N60 |
|
SR1-SR2 |
SPT-1A |
0.0-6.5 |
Silty sand |
256 |
3-6 |
|
6.5-12.0 |
Silty clay |
1409 |
38-48 |
||
|
SR3 |
SPT-2B |
0.0-4.0 |
Silty sand |
187 |
4-7 |
|
4.0-12.0 |
Silty clay |
1208 |
18-22 |
||
|
SR4 |
SPT-2A |
0.0-4.0 |
Intercalation between silty sand and silty clay |
196 |
6-9 |
|
4.0-12.0 |
High plasticity clay |
1333 |
28-42 |
||
|
SR5 |
SPT3A-SPT3B |
0.0-3.0 |
Silty sand |
163 |
6-7 |
|
3.0-12.0 |
High plasticity clay |
2093 |
26-50 |
||
|
SR6 |
SPT-4A |
0.0-2.0 |
Silty sand |
90 |
6-8 |
|
2.0-12.0 |
High plasticity clay |
1136 |
16-24 |
4.2 Laboratory analysis
Figures 6a-c and Table 4 show the correlation between the seismic lines (69 m long and 12 m deep) and the SPTs (20-26 m deep, identifying two (2) materials in the first 12 m), according to their geographical location. In the first layer (2.0-6.5 m thick), a dark brown silty material with sand layers, oxidation spots and soft consistency was determined, corresponding to a Vp of 90 to 256 m/s (according to ASTM -D-5777-18).
The underlying layer (2-12 m thick), corresponding to a Vp between 1,136 to 2,093 m/s, is a fine-grained silty clay with a very compact greenish-grey colour. In the correlations between the SPT and SR tests (see Table 4), both materials (silt and clay) correspond to estuarine marine sediments from the Quaternary geological period.
4.3 Vp-SPT regression equation
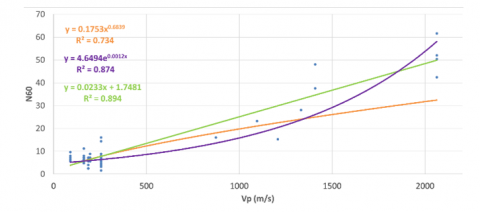
Figure 7 presents the regression equations with better correlation between the N60-Vp data. Linear regression ( $N_{60}=0.0233 \mathrm{~V} p+1.7481$; R2=0.894) had the best correlation, followed by the exponential regression ( $N_{60}=4.6494 e^{0.0012 V p}$; R2=0.874); and finally the potential regression ( $N_{60}=0.1753 \mathrm{V} p^{0.6839}$; R2=0.734).
Figure 7. Regression equations of correlation between N60-Vp. According to the colours: 1) Orange: Potential regression; 2) Purple: Exponential regression; and 3) Green: Linear regression
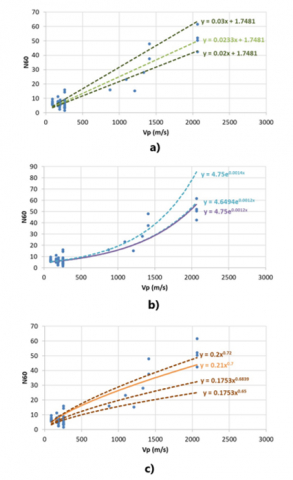
Figure 8. Adjustments to regression equations: a) Linear, b) Exponential, and c) Potential
These regression equations were a starting point to fit these equations to a better R2. Figure 8 and Table 5 show the adjustments made to the potential, exponential and linear equations, respectively. The coefficients or exponents were modified to verify that the equation has the highest correlation with the field data.
In Table 5, the higher R2 shows that the linear equation had the best correlation between N60-Vp ( $N_{60}=0.0233 \mathrm{~V} p+1.7481$; R2=0.894). With this correlation, an equation is obtained to infer values of N60 from Vp field values. This equation can be used in soils with characteristics similar to Palestina (shallow silty-sand soils and deeper clay soils).
Table 5. Adjustment of the potential, exponential and linear regression equations (those with the highest R2 are highlighted)
|
Potential |
Exponential |
Linear |
|
N60=0.1753Vp0.6839; R2=0.734 |
N60=4.6494e0.0012Vp; R2=0.874 |
$N_{60}=0.0233 \mathrm{~V} p+1.7481$; R2=0.894 |
|
$N_{60}=0.1753 \mathrm{V} p^{0.70}$; R2=0.798 |
$N_{60}=4.75 e^{0.0012 V p}$; R2=0.875 |
$N_{60}=0.03 \mathrm{~V} p+1.7481$; R2=0.778 |
|
$N_{60}=0.1753 \mathrm{V} p^{0.65}$; R2=0.562 |
N60=4.75e0.0014Vp; R2=0.502 |
$N_{60}=0.020 \mathrm{~V} p+1.7481$; R2=0.865 |
|
$N_{60}=0.20 \mathrm{V} p^{0.70}$; R2=0.837 |
N60=4.60e0.0014Vp; R2=0.564 |
$N_{60}=0.0233 \mathrm{~V} p+3.00$; R2=0.885 |
|
$N_{60}=0.18 \mathrm{V} p^{0.70}$; R2=0.809 |
|
$N_{60}=0.0233 \mathrm{~V} p$; R2=0.876 |
|
$N_{60}=0.21 \mathrm{V} p^{0.70}$; R2=0.841 |
|
|
|
$N_{60}=0.20 \mathrm{V} p^{0.72}$; R2=0.837 |
|
|
Some studies have been conducted worldwide to determine or correlate the N60 and Vp data. Similar to Palestina, research has been carried out in Turkey [39], Malaysia [33, 40] and India [41]. Table 6 compares the N60 results with the empirical equations obtained.
From Table 6, the equations of [33, 40] are equal since they were carried out in the same environment (tropical Malaysia). The linear equation obtained in Table 5 is closest to the conditions of Palestina since it has variations between 4.20-99.30%. The equation of [41] has variations between 44.01-152.25% and that of [33, 42] 51.56-286.48%. This is because these equations were obtained in other study environments (e.g., tropical, and metasedimentary environments).
4.4 Literature review
Studies by various authors have shown that certain geotechnical properties can be estimated empirically from geophysical data or field data, such as N or N60. Table 7 shows the empirical equations given by the authors that correlated SPT (N60), cohesion (C), and phi (Φ) values.
According to the results of section 4.1, the surface soils are gravel and silty or clayey sands and silty soils, while the deepest are clayey soils of high plasticity. Therefore, according to Table 8, the following equations will be used to estimate the cohesion and phi values:
Table 6. N60 values compare equations from various authors and this research with those obtained in the field
|
Vp (m/s) |
N60 from the author's empirical equations |
N60 (Campo) |
||||
|
[33] |
[39] |
[40] |
[41] |
Palestina |
||
|
90 |
10.61 |
509.15 |
10.61 |
1.38 |
3.84 |
7 |
|
1208 |
57.97 |
∞ |
57.97 |
37.84 |
29.89 |
15 |
|
2063 |
94.19 |
∞ |
94.19 |
74.88 |
49.82 |
52 |
Table 7. Correlations between SPT (N-N60), C and Φ
|
Authors |
Equation (C) |
Equation (Φ) |
Observation |
|
Ghoreishi et al. [63] |
C=0.01N60−0.004 R2=0.7228 |
Φ=0.83N60+1.24 R2=0.6224 |
Low plasticity clays (CL) |
|
Kumar et al. [62] |
C=-2.2049+6.484N60 N (2–30) R2=0.998 |
Φ=7N; N≤4 |
For cohesive soils |
|
Φ=27.12+0.2857N N (4-50) R2=0.998 |
|||
|
Karol [59] |
N<2; C=12kPa N (2–4); C=12–24kPa N (4–8); C=24–48kPa N (8–15); C=48–96kPa N (15–30); C= 96–192 kPa N>30; C=192kPa |
- |
For all soil types |
|
Terzaghi et al. [61] |
- |
N (0–4); Φ=<28o N (4–10); Φ=28–30o N (10–30); Φ= 30–36o N (30–50); Φ= 36–41o N>50; Φ=>41o |
For all soil types |
|
Mahmoud [64] |
C=0.249N60 + 19.68 R2=0.871 |
Φ=0.014N60 - 0.18 R2=0.851 |
For silty clay with sand |
|
Kasim and Raheem [60] |
C=6.5808N - 9.079 R2=0.9942 |
Φ=0.8531N + 0.1581 R2=0.9963 |
For all soil types |
|
Dalai and Patra [65] |
C= 0.00054(Ip) + 0.005(N) + 0.09 R2=0.9047 |
- |
Silty clay (medium to very hard) with traces of ash |
|
Mujtaba et al. [66] |
- |
Φ=0.706N60 + 17.58 R2=0.90 |
Poorly graded silt sand (SP-SM) |
Table 8. Estimated values of C and Φ, according to the results of this research
|
Depth (m) |
Soil type |
N |
N60 |
Cohesion (kPa) |
Phi (o) |
|
0.0-6.5 |
gravel and silty or clayey sands and silty soils |
7-11 |
6-9 |
36 - 63 |
29 - 30 |
|
6.5–12.5 |
clayey soils of high plasticity |
32-63 |
26-50 |
162-405 |
35 - 41 |
Table 9. Existing correlations between SPT (N-N60) and shear wave velocity (Vs)
|
Authors |
Empirical equation |
Observation |
|
Seed and Idriss [67] |
Vs=61.4N0.5 |
For all soil types |
|
Seed et al. [68] |
Vs=56.4N0.5 |
For sandy soil |
|
Lee [69] |
Vs=114N0.31 |
For clay-type soil |
|
Athanasopoulos [70] |
Vs=107.6N0.36 |
For all soil types |
|
Pitilakis et al. [71] |
Vs=132(N60)0.271 |
For clay-type soil |
|
Hanumantharao and Ramana [72] |
Vs=82.6N0.43 |
For all soil types |
|
Dikmen [73] |
Vs=44N0.48 |
For clay-type soil |
|
Kasim and Raheem [64] |
Vs=2.8538(N)+55.769 |
For hard clay soil |
Table 10. Vs values calculated for each soil layer
|
SPTs |
Deep (m) |
N |
Vs (m/s) |
|
1A-1B |
0.0-6.5 |
3-6 |
106-205 |
|
6.5-11.0 |
38-48 |
378-436 |
|
|
2A |
0.0-4.0 |
4-7 |
123-217 |
|
4.0-12.5 |
18-22 |
260-312 |
|
|
2B |
0.0-4.0 |
6-9 |
205-237 |
|
4.0-12.5 |
28-42 |
325-413 |
|
|
3A-3B |
0.0-3.0 |
6-7 |
205-217 |
|
3.0-12.5 |
26-50 |
313-444 |
|
|
4A-4B |
0.0-3.0 |
6-8 |
205-227 |
|
3.0-11.0 |
16-24 |
246-338 |
Just as the dynamic soil parameters C and Φ are important, the shear wave velocity parameter (Vs) is another of great importance for the design of civil works. This parameter allows for analysing the response of the study site, evaluation of the rigidity of the foundations, or the liquefaction potential. It is also a fundamental parameter to define or estimate dynamic soil properties. Therefore, several authors have empirically correlated the parameters Vs and N60. Table 9 summarises some of the existing correlations.
Since the soils of the Palestina canton are classified as silty and clayey, Table 10 empirically presents ranges of values of Vs according to the equations of authors such as Seed and Idriss [67], Athanasopoulos [70], and Hanumantharao and Ramana [72].
A geotechnical-geophysical investigation was carried out in four communities of the Palestina canton (El Carmen, La Corona, Las Peñas, and Lagarto estuary); where bridges will be built both for their socio-economic development and to prevent flooding in the study area. This research is essential to guarantee the useful life of these civil works. Furthermore, a geophysical-geotechnical methodology was carried out to acquire field data (seismic refraction lines and SPT), which, together with a literary review helped to interpret the soil conditions and consider them in the design of the construction of the bridges.
Data were collected from eight (8) perforations and six (6) seismic lines; in addition, 140 SPT samples were analysed in the laboratory. Regarding the soil classification of the study area (through SUCS), in the first depth meters (0.0 to 6.5), silty-sand soils were obtained, while in the following meters (6.5-12.0), there are highly plastic clayey soils.
An empirical correlation was obtained between the N60-Vp data in this research in the Palestina canton. The linear regression equation had a better correlation ($N_{60}=4.75 e^{0.0233 V p}+1.7481$; R2=0.894). With this correlation, it was possible to infer values of resistant parameters, such as cohesion (C) and phi (Φ), by reviewing the literature of studies by various authors. This linear regression equation is recommended in environments like the Palestina canton.
The literature review allowed us to learn about research from other authors and in other countries. Vp data were related to SPT (N60), besides inferring cohesion (C), phi (Φ) and other geophysical data such as shear wave (Vs). This will allow assuming data of geotechnical parameters for the characterisation of the subsoil and subsequent design of civil works in the Palestina canton (Ecuador).
This linear equation will allow engineers to assume or empirically obtain geotechnical parameters with indirect test values, such as seismic refraction, once the number of measurements that offer a certain reliability degree is substantiated. Therefore, SPT correlation with seismic lines accelerates the soil analysis with a high safety factor that influences cost reduction and optimisation of direct tests (e.g., exploratory wells) if they are related to the linear regression equation.
The limitations of this research are: 1) further SPT and SR testing is necessary to refine the empirical regression equation; and 2) to check the affinity of the C, Φ and Vs results, it is necessary to test soil samples in laboratory and field tests. As a future direction or new research on this topic are: a) modify the use of the SPT by piezocone penetration testing (CPTu); since by this method, more dynamic parameters of the soil are obtained in-situ (e.g., effective vertical effort, shear resistance without drainage); b) perform the correlation with Vs waves, because this parameter has more relationships with other dynamic parameters (e.g., Young's Modulus-E, shear elastic modulus-G); c) the implementation of algorithms (e.g., machine learning, numerical models) to digitize and automate soil parameter data is one of the applied modern techniques; but for this, it is necessary to have many field data to validate and calibrate the designed models.
To the research project of the ESPOL Polytechnic University: "Registration of geological and mining heritage and its impact on the defense and preservation of geodiversity in Ecuador" with institutional code CIPAT-01-2018. To the master's degree in geotechnics from the ESPOL Polytechnic University. For the support in the field to Ing. Julio Vargas-Guadalupe, SIGMACONS S.A. legal representative.
|
SR |
seismic refraction |
|
SPT |
Standard Penetration Test |
|
Vp |
P-wave velocity, m/s |
|
SUCS |
Unified Soil Classification System |
|
AASHTO |
American Association of State Highway and Transportation Officials |
|
W |
Moisture, % |
|
LL |
Liquid limit, % |
|
LP |
Plastic limit, % |
|
IP |
Plastic index, % |
|
#200 |
Material smaller than sieve No. 200, % |
|
m |
meters |
|
Hz |
hertz |
|
kg |
kilogram |
[1] Cui, K., Jing, X. (2019). Research on prediction model of geotechnical parameters based on BP neural network. Neural Computing and Applications, 31: 8205-8215. https://doi.org/10.1007/s00521-018-3902-6
[2] Zuo, H.Y., Luo, Z.Q., Guan, J.L., Wang, Y.W. (2014). Identification on rock and soil parameters for vibration drilling rock in metal mine based on fuzzy least square support vector machine. Journal of Central South University, 21(3): 1085-1090. https://doi.org/10.1007/s11771-014-2040-2
[3] Mulyawati, I.B., Ramadhan, D.F. (2021). Bibliometric and visualized analysis of scientific publications on geotechnics fields. ASEAN Journal of Science and Engineering Education, 1(1): 37-46. https://doi.org/10.17509/ajsee.v1i1.32405
[4] Mero, P.C., Torrens, R.B., Bernal, C.B., Aguilar, M.A., Carballo, F.M., Bitar, J.B. (2019). Geomechanical characterization and analysis of the effects of rock massif in Zaruma City, Ecuador. In Proceedings of the 17th LACCEI International Multi-Conference for Engineering, Education, and Technology: “Industry, Innovation, and Infrastructure for Sustainable Cities and Communities”, Montego Bay, Jamaica, pp. 24-26.
[5] Di, H., Zhou, S., Yao, X., Tian, Z. (2021). In situ grouting tests for differential settlement treatment of a cut-and-cover metro tunnel in soft soils. Bulletin of Engineering Geology and the Environment, 80(8): 6415-6427. https://doi.org/10.1007/s10064-021-02276-5
[6] Wang, H., Markine, V. (2019). Dynamic behaviour of the track in transitions zones considering the differential settlement. Journal of Sound and Vibration, 459: 114863. https://doi.org/10.1016/j.jsv.2019.114863
[7] Carrión-Mero, Paúl, Solórzano, Joselyne, Chávez, M.Á., Blanco, Roberto, Morante-Carballo, Fernando, Aguilar, Maribel, Briones-Bitar, Josué. (2020). Evaluation of geomechanical features and stability for the recommendations and rehabilitation of the Humberto Molina Hospital, Zaruma, El Oro, Ecuador. WIT Trans. Ecol. Environ, 241: 455-466.
[8] Morante, F., Aguilar, M., Ramírez, G., Blanco, R., Carrión, P., Briones, J., Berrezueta, E. (2019). Evaluation of slope stability considering the preservation of the general patrimonial cemetery of Guayaquil, Ecuador. Geosciences, 9(3): 103. https://doi.org/10.3390/geosciences9030103
[9] Carrión-Mero, P., Solórzano, J., Morante-Carballo, F., Chávez, M.Á., Montalván-Burbano, N., Briones-Bitar, J. (2022). Technical Closure of the Humberto Molina Astudillo Hospital and Its Implications for Sustainability, Zaruma-Ecuador. Int. J. Sustain. Dev. Plan, 17: 363-373. https://doi.org/10.18280/ijsdp.170202
[10] Wang, L., Wu, C., Gu, X., Liu, H., Mei, G., Zhang, W. (2020). Probabilistic stability analysis of earth dam slope under transient seepage using multivariate adaptive regression splines. Bulletin of Engineering Geology and the Environment, 79: 2763-2775. https://doi.org/10.1007/s10064-020-01730-0.
[11] Solórzano, J., Morante-Carballo, F., Montalván-Burbano, N., Briones-Bitar, J., Carrión-Mero, P. (2022). A Systematic Review of the Relationship between Geotechnics and Disasters. Sustainability, 14(19): 12835. https://doi.org/10.3390/su141912835
[12] Aripov, N.F., Kiselev, N.P., Lyudva, SA., Piotrovskii, A.S. (2018). Quality control of the stacking of coarse fragmental soil in test pits of reduced size in the construction of dams. Power Technology and Engineering, 52(3): 298-302. https://doi.org/10.1007/s10749-018-0948-7
[13] Fei, Y., She, D., Gao, L., Xin, P. (2019). Micro-CT assessment on the soil structure and hydraulic characteristics of saline/sodic soils subjected to short-term amendment. Soil and Tillage Research, 193: 59-70. https://doi.org/10.1016/j.still.2019.05.024.
[14] Khosravi, A., Martinez, A., DeJong, J.T. (2020). Discrete element model (DEM) simulations of cone penetration test (CPT) measurements and soil classification. Canadian Geotechnical Journal, 57(9): 1369-1387. https://doi.org/10.1139/cgj-2019-0512
[15] Ampadu, S.I.K., Ayeh, F.F., Boadu, F. (2018). Deriving SPT N-values from DCP test results: the case of foundation design in a tropical environment. Geotechnical and Geological Engineering, 36: 2517-2531. https://doi.org/10.1007/s10706-018-0480-4
[16] Rocha, B.P., Rodrigues, R.A., Giacheti, H.L. (2021). The flat dilatometer test in an unsaturated tropical soil site. Geotechnical and Geological Engineering, 39(8): 5957-5969. https://doi.org/10.1007/s10706-021-01849-1
[17] Amoroso, S., Comina, C., Marchetti, D. (2020). Combined P-and S-wave measurements by seismic dilatometer test (SPDMT): A case history in Bondeno (Emilia Romagna, Italy). Geotechnical Testing Journal, 43(2): 1-12. https://doi.org/10.1520/GTJ20180233.
[18] Bilgin, Ö., Arens, K., Dettloff, A. (2019). Assessment of variability in soil properties from various field and laboratory tests. Georisk: Assessment and Management of Risk for Engineered Systems and Geohazards, 13(4): 247-254. https://doi.org/10.1080/17499518.2019.1645338.
[19] Zhou, J., Li, E., Wang, M., Chen, X., Shi, X., Jiang, L. (2019). Feasibility of stochastic gradient boosting approach for evaluating seismic liquefaction potential based on SPT and CPT case histories. Journal of Performance of Constructed Facilities, 33(3): 04019024. https://doi.org/10.1061/(ASCE)CF.1943-5509.0001292
[20] Nadia, R., Saad, R., Muztaza, N., Ismail, N.A., Saidin, M.M. (2016). Geotechnical parameters study using seismic refraction tomography. Journal Teknologi, 78(8-6). https://doi.org/10.11113/jt.v78.9645
[21] Daniel Opemipo, O., Moroof, O., Sunday, O., Victor, O., Christopher, B. (2022). Subgrade soil evaluation using integrated seismic refraction tomography and geotechnical studies: A case of Ajaokuta-Anyigba Federal highway, North-Central Nigeria. NRIAG Journal of Astronomy and Geophysics, 11(1): 293-305. https://doi.org/10.1080/20909977.2022.2094530
[22] Whiteley, J.S., Chambers, J.E., Uhlemann, S., et al. (2020). Landslide monitoring using seismic refraction tomography–The importance of incorporating topographic variations. Engineering Geology, 268: 105525. https://doi.org/10.1016/j.enggeo.2020.105525
[23] Saad, A.M., Sakr, M.A., Omar, A.E., Mohamed, A.W., Temsah, Y.A. (2022). Assessment of radioactivity and geotechnical characteristics of soil foundation for suitability of safe urban extension using geospatial technology New Sahl Hasheesh Marin Port, Eastern Desert, Egypt. International Journal of Environmental Analytical Chemistry, 102(17): 5715-5737. https://doi.org/10.1080/03067319.2020.1802444
[24] Bychkov, S., Dolgal, A., Simanov, A. (2021). Interpretation of gravity monitoring data on geotechnical impact on the geological environment. Pure and applied geophysics, 178(1): 107-121. https://doi.org/10.1007/s00024-020-02640-8
[25] Reynolds, J.M. (2011). An introduction to applied and environmental geophysics. John Wiley & Sons.
[26] Adegbola, R.B., Ayolabi, E.A., Allo, W. (2013). Subsurface characterization using seismic refraction and surface wave methods: A case of Lagos State University, Ojo, Lagos State. Arabian Journal of Geosciences, 6: 4925-4930. https://doi.org/10.1007/s12517-012-0784-2
[27] Khalil, M.H., Hanafy, S.M. (2016). Geotechnical Parameters from Seismic Measurements: Two Field Examples from Egypt and Saudi ArabiaKhalil and Hanafy: Geotechnical Parameters from Seismic Measurements. Journal of Environmental and Engineering Geophysics, 21(1): 13-28. https://doi.org/10.2113/JEEG21.1.13
[28] Izumotani, S., Takeuchi, M., Murayama, H., Okazaki, K. (2021). Estimating rock properties using seismic refraction survey data: a case study in an abandoned road tunnel. Exploration Geophysics, 52(4): 409-418. https://doi.org/10.1080/08123985.2020.1828856
[29] Nixon, I.K. (2021). Standard penetration test State-of-the-art report. In Penetration testing, Routledge, pp. 3-22.
[30] El-Reedy, M.A. (2017). Soil investigation and pile design. In Onshore Structural Design Calculations, Elsevier, pp. 345-385.
[31] Izumotani, S., Takeuchi, M., Murayama, H., Okazaki, K. (2021). Estimating rock properties using seismic refraction survey data: a case study in an abandoned road tunnel. Exploration Geophysics, 52(4): 409-418. https://doi.org/10.1080/08123985.2020.1828856
[32] Whiteley, J.S., Watlet, A., Uhlemann, S., Wilkinson, P., Boyd, J.P., Jordan, C., Kendall, J.M., Chambers, J.E. (2021). Rapid characterisation of landslide heterogeneity using unsupervised classification of electrical resistivity and seismic refraction surveys. Engineering Geology, 290: 106189. https://doi.org/10.1016/j.enggeo.2021.106189
[33] Awang, H., Mohamad, M.N.N. (2016). A correlation between P-wave velocities and standard penetration test (Spt-N) Blows Count for Meta-Sedimentary Soils of Tropical Country. In InCIEC 2015: Proceedings of the International Civil and Infrastructure Engineering Conference, Springer, Singapore, pp. 343-354. https://doi.org/10.1007/978-981-10-0155-0_31
[34] Carrión-Mero, P., Aguilar-Aguilar, M., Morante-Carballo, F., Domínguez-Cuesta, M.J., Sánchez-Padilla, C.; Sánchez-Zambrano, A., Briones-Bitar, J., Blanco-Torrens, R., Córdova-Rizo, J., Berrezueta, E. (2021). Surface and underground geomechanical characterization of an area affected by instability phenomena in Zaruma Mining Zone (Ecuador). Sustainability, 13(6): 3272. https://doi.org/10.3390/su13063272
[35] Ortiz-Hernández, E., Chunga, K., Pastor, J.L., Toulkeridis, T. (2022). Assessing susceptibility to soil liquefaction using the standard penetration test (SPT)—a case study from the city of Portoviejo, Coastal Ecuador. Land, 11(4): 463. https://doi.org/10.3390/land11040463
[36] Carrión-Mero, P., Briones-Bitar, J., Morante-Carballo, F., Stay-Coello, D., Blanco-Torrens, R., Berrezueta, E. (2021). Evaluation of slope stability in an urban area as a basis for territorial planning: A case study. Applied Sciences, 11(11): 5013. https://doi.org/10.3390/app11115013
[37] Sellers, C., Ammirati, L., Khalili, M.A., Buján, S., Rodas, R.A., Di Martire, D. (2022). The Use DInSAR Technique for the Study of Land Subsidence Associated with Illegal Mining Activities in Zaruma–Ecuador, a Cultural Heritage Cite. In European Workshop on Structural Health Monitoring: EWSHM 2022-Volume 3, Springer, pp. 553-562.
[38] MIDUVI Capítulos de la NEC (Norma Ecuatoriana de la Construcción). Available online: https://www.habitatyvivienda.gob.ec/documentos-normativos-nec-norma-ecuatoriana-de-la-construccion.
[39] Ulugergerli, E.U., Uyanik, O. (2007). Statistical correlations between seismic wave velocities and SPT blow counts and the relative density of soils. Journal of Testing and Evaluation, 35(2): 187-191. https://doi.org/10.1520/JTE100159
[40] Andy A.B., Rosli, S. (2012). Correlation of seismic P-wave velocities with engineering parameters (N value and rock quality) for tropical environmental study. International Journal of Geosciences, 3: 749-757, https://doi.org/10.4236/ijg.2012.34075
[41] Sarkar, S., Saha, A., Dey, A.K. (2017). Soil Characterization and Stratification using Seismic Refraction Test.
[42] Tinoco, V., Willems, P., Wyseure, G., Cisneros, F. (2016). Evaluation of reservoir operation strategies for irrigation in the Macul Basin, Ecuador. Journal of Hydrology: Regional Studies, 5: 213-225. https://doi.org/10.1016/j.ejrh.2015.12.063
[43] INEC, Resultados del CENSO de población y Vivienda de 2010 En Ecuador. Available online: https://www.ecuadorencifras.gob.ec/censo-de-poblacion-y-vivienda.
[44] SNI-Ecuador Plan de Desarrollo y Ordenamiento Territorial del Cantón Palestina 2014-2019; 2013.
[45] ASTM Standard Test Method for Standard Penetration Test (SPT) and Split-Barrel Sampling of Soils Available online: https://www.astm.org/d1586-11.html.
[46] ASTM ASTM D2216-19: Standard test methods for laboratory determination of water (moisture) content of soil and rock by mass. Available online: https://www.astm.org/d2216-19.html.
[47] ASTM ASTM D2974-14: Standard test methods for moisture, ash, and organic matter of peat and other organic soils. Available online: https://pdfcoffee.com/d-2974-14-pdf-free.html.
[48] ASTM ASTM D1140: Standard test methods for determining the amount of material finer than 75-Μm (No. 200) sieve in soils by washing. Available online: https://www.astm.org/d1140-17.html.
[49] ASTM ASTM D4318-17: standard test methods for liquid limit, plastic limit, and plasticity index of soils. Available online: https://www.astm.org/d4318-17e01.html.
[50] ASTM ASTM D2487-17: Standard ractice for classification of soils for engineering purposes (Unified Soil Classification System). Available online: https://www.astm.org/d2487-17e01.html.
[51] Babaeian, E., Sadeghi, M., Jones, S.B., Montzka, C., Vereecken, H., Tuller, M. (2019). Ground, proximal, and satellite remote sensing of soil moisture. Reviews of Geophysics, 57(2): 530-616. https://doi.org/10.1029/2018RG000618
[52] Nawaz, M.N., Qamar, S.U., Alshameri, B., Karam, S., Çodur, M.K., Nawaz, M.M., Riaz, M.S., Azab, M. (2022). Study Using Machine Learning Approach for Novel Prediction Model of Liquid Limit. Buildings, 12(10): 1551. https://doi.org/10.3390/buildings12101551
[53] Amakye, S.Y., Abbey, S.J., Booth, C.A. (2022). DMRB flexible road pavement design using re-engineered expansive road subgrade materials with varying plasticity index. Geotechnics, 2(2): 395-411. https://doi.org/10.3390/geotechnics2020018
[54] Moreno-Maroto, J.M., Alonso-Azcárate, J., O'Kelly, B. C. (2021). Review and critical examination of fine-grained soil classification systems based on plasticity. Applied Clay Science, 200: 105955. https://doi.org/10.1016/j.clay.2020.105955
[55] ASTM Standard Guide for Using the Seismic Refraction Method for Subsurface Investigation Available online: https://www.astm.org/d5777-18.html, accessed on Jan. 5, 2023.
[56] INTERPEX Seismic Refraction Processing and Interpretation Using GRM Available online: http://www.interpex.com/IXRefraX/IXRefraX.htm, accessed on Jan. 3, 2023.
[57] Yusof, N.Q.A. M., Zabidi, H. (2018). Reliability of using standard penetration test (SPT) in predicting properties of soil. In Journal of Physics: Conference Series, 1082(1): 012094. https://doi.org/10.1088/1742-6596/1082/1/012094
[58] Taylor, R. (1990). Interpretation of the correlation coefficient: A basic review. Journal of Diagnostic Medical Sonography, 6(1): 35-39. https://doi.org/10.1177/875647939000600106
[59] Karol, R. (1960). Soils and Soil Engineering. Prentice Hall, Eaglewood Cliffs.
[60] Kasim, M.N., Raheem, A.M. (2021). Evaluation of some soil characteristics from field SPT values using random number generation technique. In IOP Conference Series: Earth and Environmental Science, 779(1): 012017. https://doi.org/10.1088/1755-1315/779/1/012017
[61] Terzaghi, K., Peck, R.B., Mesri, G. (1996). Soil mechanics in engineering practice. John Wiley & Sons.
[62] Kumar, R., Bhargava, K., Choudhury, D. (2016). Estimation of engineering properties of soils from field SPT using random number generation. INAE Letters, 1: 77-84. https://doi.org/10.1007/s41403-016-0012-6
[63] Ghoreishi, B., Khaleghi Esfahani, M., Alizadeh Lushabi, N., Amini, O., Aghamolaie, I., Hashim, N.A.A.N., Alizadeh, S.M.S. (2021). Assessment of geotechnical properties and determination of shear strength parameters. Geotechnical and Geological Engineering, 39: 461-478. https://doi.org/10.1007/s10706-020-01504-1.
[64] Mahmoud, M.A.A.N. (2013). Reliability of using standard penetration test (SPT) in predicting properties of silty clay with sand soil. International Journal of Civil & Structural Engineering, 3(3): 545-556.
[65] Dalai, S., Patra, C. (2021). Prediction of angle of internal friction based on SPT N values. In Proceedings of the Indian Geotechnical Conference 2019: IGC-2019 Volume V, Springer Singapore, pp. 471-477.
[66] Mujtaba, H., Farooq, K., Sivakugan, N., Das, B.M. (2018). Evaluation of relative density and friction angle based on SPT-N values. KSCE Journal of Civil Engineering, 22: 572-581. https://doi.org/10.1007/s12205-017-1899-5
[67] Seed, H.B., Idriss, I.M. (1981). Evaluation of liquefaction potential sand deposits based on observation of performance in previous earthquakes. In ASCE national convention (MO), pp. 481-544.
[68] Seed, H.B., Idriss, I.M., Arango, I. (1983). Evaluation of liquefaction potential using field performance data. Journal of Geotechnical Engineering, 109(3): 458-482. https://doi.org/10.1061/(ASCE)0733-9410(1983)109:3(458)
[69] Lee, S.H.H. (1990). Regression models of shear wave velocities in Taipei basin. Journal of the Chinese Institute of Engineers, 13(5): 519-532. https://doi.org/10.1080/02533839.1990.9677284
[70] Athanasopoulos, G.A. (1970). Empirical correlations Vso-NSPT for soils of Greece: A comparative study of reliability. WIT Transactions on The Built Environment, 15: 19-26. https://doi.org/10.2495/SD950031
[71] Pitilakis, K., Raptakis, D., Lontzetidis, K., Tika-Vassilikou, T., Jongmans, D. (1999). Geotechnical and geophysical description of EURO-SEISTEST, using field, laboratory tests and moderate strong motion recordings. Journal of Earthquake Engineering, 3(3): 381-409. https://doi.org/10.1080/13632469909350352
[72] Hanumantharao, C., Ramana, G.V. (2008). Dynamic soil properties for microzonation of Delhi, India. Journal of Earth System Science, 117: 719-730. https://doi.org/10.1007/s12040-008-0066-2
[73] Dikmen, Ü. (2009). Statistical correlations of shear wave velocity and penetration resistance for soils. Journal of Geophysics and Engineering, 6(1): 61-72. https://doi.org/10.1088/1742-2132/6/1/007