Rania Abdel Mohsen* | Pasent H.A. Yousef | Tarek Abou El Seoud
© 2022 IIETA. This article is published by IIETA and is licensed under the CC BY 4.0 license (http://creativecommons.org/licenses/by/4.0/).
OPEN ACCESS
The research aims to suit the criteria for classifying green cities according to the characteristics of the Egyptian environmental zones to select the most relevant zone for sustainable green cities. The Egyptian cities consume large quantities of materials, energy, and water causing different problems facing cities and their population. The criteria of sustainable green cities should be done according to the various characteristics of environmental zones in Egypt. The leadership in energy and environmental design (LEED) criteria for the Egyptian cities and communities’ system is selected according to the characteristics of environmental zones in Egypt, aiming to select the most relevant zones to construct sustainable green cities. According to the ecological, geographical, economic, political, social, historical, urban, and cultural characteristics of environmental zones that are different from one zone to another in Egypt, the influencing factors in the classification criteria are introduced to show the incentives, capabilities, and challenges facing cities in making green and sustainable transformation by using weighited overlay model in Arc GIS. By using the suitability scoring system, the most suitable environmental zone, namely the dry coastal zone, has the motivation and ability to transform the city into a green and sustainable city according to its particular environmental characteristics.
environmental zones, sustainable green cities, Egyptian cities, LEED criteria, suitability scoring system
Egypt faces many problems and challenges in the fields of environmental, urban, economic, and social development because of having many negative impacts on the sustainability of Egyptian cities. These challenges occurred due to the overcrowded population in urban areas reaching 95% of the total population. In addition to the increase in Egyptian cities' consumption of materials, energy, and water, which reaches 60% of the total consumption, it causes depletion of resources, pollution of the environment, and an imbalance in the environment [1]. Thus, there is a decrease in the per capita share of water and energy, a spread of various wastes, and an increasing proportion of harmful emissions to 70% of the total emissions. The green urbanization forms more sustainable lifestyles, and reduces resources consumption, waste, and environmental footprint according to the three main pillars of green cities, which are zero fossil energy, zero waste, and zero harmful emissions [2].
All countries all over the world develop and implement policies, programs, and procedures that lead to the integration of the environmental dimensions in all developmental sectors to deal with challenges of global change and sustainability. Therefore, Egypt developed a strategy for sustainable development (Egypt Vision 2030) that aims to implement a system to maximize utilization and balance among energy, water, and land to make cities and human settlements safe and sustainable [3] through achieving green and socioeconomic sustainability, according to the UN Sustainable Development Goal 11 [4]. Therefore, the importance of green sustainable cities increases to be the only option to confront the threat of climate change and environmental challenges, and maintain the environmental balance in various planning stages of the city.
The city level has received major attention because the developers want to test the scalability of applying sustainability solutions, and measuring the effectiveness of reducing the impact of carbon emissions and the respect of green conditions by following the objectives and principles of green urbanization.
Based on the fact that there are differences among cities in their environmental impacts, per capita carbon, and their environmental footprint, there are various factors that have effects on converting cities into sustainable green ones. Taking these factors into account, which reflect the characteristics of environmental zones, will lead to minimize further negative challenges to Egyptian cities. So, the classification criteria for green sustainable cities must respect the characteristics of Egyptian environmental zones.
There are 59 urban sustainability rating tools in 22 countries all over the world, which are classified based on the geographic scale and special characteristics including cities, planned neighborhoods, existing neighborhoods, all neighborhoods, landscapes and parks, transportation and infrastructure, and special purposes [5]. The results of previous studies tackling the sustainability assessment tools at the city level, have found that “the recently developed LEED for cities and communities’ tool performs better when compared to other tools” [6].
Therefore, the criteria for the classification of the LEED (CE) for green Cities and communities’ tool have been selected in this paper to suit the characteristics of environmental Egyptian zones that differ from each other ecologically, geographically, economically, and socially. This paper selects the most suitable environmental Egyptian zone for converting the cities into green and sustainable ones.
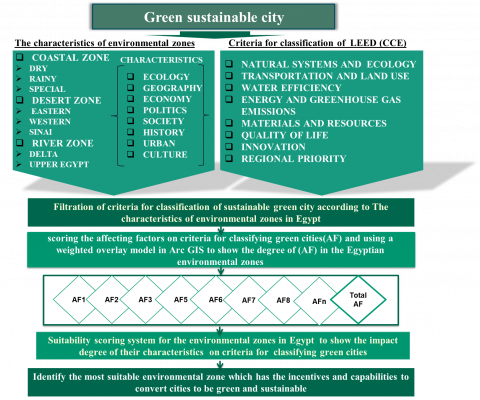
The research aims to present the relationship between the characteristics of environmental zones and the classification of sustainable green cities. The review of literature, previous studies and recent reports help select the criteria of classifying sustainable green cities according to the suitable classification system. These criteria are filtered according to the different characteristics of the environmental zones to show the degree of affecting factors by using weighted overlay model in Arc GIS program for comparing the (AF) on the selected criteria for classifying green cities, taking into account their relative weight. This is to determine the priority of these zones and select the most suitable one to convert cities into sustainable green ones by using suitability scoring system, as shown in Figure 1.
Figure 1. Methodological framework of the study
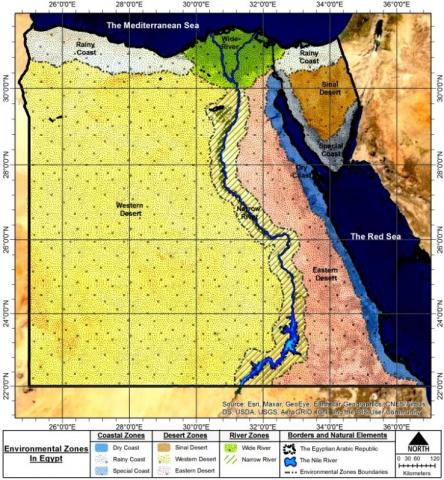
The environmental zones refer to areas that are homogeneous in time, place and function in environmental characteristics. Egypt can be ecologically considered as three main zones: The coastal zone, the desert zone, and the river zone. They are divided into subzones that include the governorates and the natural determinants [7], as shown in Table 1 and (Figure 2). They have environmental characteristics that differ ecologically, geographically, economically, socially, and urban from each other. The coastal zones are divided into three zones. The rainy coastal zone extends along the northeastern and northwestern coasts of the Mediterranean Sea in Egypt. The dry coastal zone parallels the Red Sea coast from Halayeb and Shalateen to Suez governorate and its western borders are the Red Sea Mountains [8]. The special coastal zone extends along the South Sinai coast and has a special nature of water and wind movement [9]. The desert zones are divided into three zones. The aggressive eastern desert is a rugged and aggressive land. Although it is rich in mineral resources, it has highlands, depressions, rolling hills, and slopes that causes torrential besides difficulty in obtaining groundwater. The western desert zone is friendly as it is flat. It has Moghra aquifers, that form unique water resources for all human activities, contains freshwater [10], and has biodiversity in its oases [11]. In addition, the special Sinai desert zone has a special ecosystem [12]. The river zones extend around the river where the population density is high [13]. It is divided into the narrow river zone, south of Cairo in Upper Egypt, and the wide river area in the delta north of Cairo, which has flat and fertile land [12], and characterized by a number of northern lakes [14]. As a result of the diversity of environmental systems in these zones, the economic activities vary according to the geographical areas and the political system represented in laws, regulations, customs, and traditions. So, the functions, characteristics and culture of population are not the same, where the requirements of the Bedouin population are different from the coasts, Upper Egypt and the Delta zones. This variance directly affects the urban needs and consumption rates of the cities located in these environmental zones. Thus, it affects the criteria of constructing sustainable green cities.
Figure 2. The environmental zones in Egypt
Table 1. The subzones of Egyptian environmental zones and the governorates included [7]
|
The main zones |
The subzones |
The governorates included |
|
Coastal zone |
Rainy coast |
Alexandria – Matrouh – Port Said |
|
Dry coast |
Red Sea- Suez |
|
|
Special coast |
Ismailia -South Sinai |
|
|
Desert zone |
Eastern desert |
Red Sea |
|
Western desert |
El Wadi El Gadeed |
|
|
Sinai desert |
North and South Sinai |
|
|
River zone |
Wide river (Nile Delta) |
Cairo – Giza – Behera – Sharkia – Damietta - Kafr El Sheikh – Dakahlia – Gharbia – Qalyubia |
|
Narrow river (Upper Egypt) |
Menia – Souhage – Fayoum – Bani Sweif – Qena – Aswan – Assiut |
There are many classification systems of sustainable green cities that have been developed at the city scale in different continents all over the world, The African Green City Index is a research project that seeks and assesses the measurements and environmental performance of major African cities across a range of criteria to understand the environmental challenges of these cities. Some Egyptian cities were evaluated according to such criteria, such as Cairo, Alexandria [15], New Damietta, 6th October, and Tenth of Ramadan [1], but these criteria, on which the evaluation was based, did not take into account the different characteristics of the environmental zones in Egypt like geographical, economical, and social characteristics, which contribute in facing the challenges facing sustainable green cities. Although there are large numbers of sustainability assessment tools, only few tools have been relatively used and adopted domestically and/or globally [6].
Recently, there are many previous studies comparing the tools for the classification of sustainable green cities and nominated the most suitable one according to the research purpose of each study. The results of these studies have shown that “the recently developed LEED tool for cities and communities performs better compared to other tools” [6], as it is characterized as a recent and comprehensive tool with multiple criteria related to the different characteristics that affect the classification of Egyptian green cities. It focuses on water and energy issues that Egypt suffers from, and gives them greater relative weights, so LEED criteria are aligned with the United Nations Sustainable Development Goals for sustainable green cities: Existing (LEED-CCE), have been selected for this research to be filtered according to the characteristics of coastal, river and desert environmental zones in Egypt through the different ecologically, geographically, economically, socially, and urban characteristics from one zone to another, therefore the criteria for classification of sustainable green cities will differ as well.
4.1 LEED for cities and communities (LEED-CCE)
LEED for Existing Cities and communities (LEED-CCE) is the most recent version of the LEED family to evaluate the sustainability and quality of life in a sustainable green city or community, as the USGBC has made efforts to align these versions with the United Nations Sustainable Development Goals, and emphasizes the climate change adaptation and mitigation for cities and communities of all shapes and sizes. At all phases of their evolution for measuring the performance of their social, economic and environmental conditions, LEED for cities and communities has several categories, which include the required credits and prerequisites. It contains two types: Base conditions and performance score [16].
4.2 Criteria for classification of LEED (CCE) for existing cities
LEED for cities and communities has several categories that include natural systems and ecology, transportation and land use, water efficiency, energy and greenhouse gas emissions, materials and resources, quality of life, innovation, and regional priority. The LEED (CCE) criteria for green city classification were selected according to their relationship to the different types of characteristics, as shown in Table 2.
Table 2. Filtration of LEED (CCE) criteria according to the characteristics of environmental zones in Egypt
|
Categories |
Code |
Criteria for classification of LEED (CCE) |
The characteristics of environmental zones in Egypt (Influencing factors) |
Ch. Type |
Weight |
|
|
INTEGRATIVE PROCESS |
|
|||||
|
Credit |
Integrative Planning and Leadership |
1 |
Comprehensive Plan |
Comprehensive plan for green cities within the last five years according to a clear vision and strategy for the future. |
Ecology- Urban |
1 |
|
2 |
Roadmap Development |
Gap analysis for the city and setting roadmap goals related to details at the city level that are related to its characteristics |
||||
|
Credit |
Green Building Policy and Incentives |
3 |
Green buildings registered or certified to LEED or equivalent,% |
Factors affecting the increase in the percentage of green buildings related to details at the city level that are related to its characteristics, function and developmental role |
4 |
|
|
NATURAL SYSTEMS AND ECOLOGY |
|
|||||
|
Prerequisite |
Ecosystem Assessment |
1 |
Topography: Unique topographic features and slope stability risks |
Land covers characteristics that show unique topographic features and slope stability risks. |
Ecology: land-water-Vegetation and Habitat |
R |
|
2 |
Soils: Unique farmland, healthy soils, and soils disturbed by previous development |
Soil characteristics that show the unique farmland, healthy & soil problem, and soil disturbed by previous development. |
||||
|
3 |
Vegetation and Habitat: Total existing vegetated area and top three threatened species |
Bioenvironmental characteristics that show the existing vegetation and habitats as well as threatens. |
||||
|
4 |
Hydrology and Aquatic Ecosystems |
The characteristics of hydrology and aquatic ecosystem that show flood hazards, wetlands, lakes, streams, shorelines, rainwater, water quality, watershed health, potable and non-potable water sources, and pollution sources. |
||||
|
Credit |
Green Spaces |
5 |
Green space, square meters per person |
Factors affecting the per capita share of green spaces: The population density, climate, soil fertility, topography, and water sources [17-21] |
Ecology: (land-water-air) - Social |
2 |
|
Credit |
Natural Resources Conservation and Restoration |
6 |
Natural Resource Acreage, square meters per capita |
Factors affecting the maintenance of natural resources acreage and their per capita share like threats resulted from human activities that affect the natural resources |
Geographical-political-Ecology: land-water- biotic |
2 |
|
7 |
Steep Slopes, not greater than 40% |
Natural resources characteristic that show steep slopes, topographic and land features geotechnical evaluation and limits of development according to steep slopes |
||||
|
8 |
Agricultural Land and Food Production |
Factors affecting the disturbance of prime farmland, unique farmland, or farmland of statewide or local importance |
||||
|
9 |
Vegetation and habitat |
Factors affecting restoration of degraded vegetation and habitats plan if the site has any threatened or endangered species, |
||||
|
10 |
Aquatic Ecosystems, do not permit any development within a flood hazard area, within 61 m from normal high tide line, within 15 m of a wetland, within 30 m of a water body, which is greater than 50 acres, and within 15 meters for water bodies less than 50 acres |
Aquatic Ecosystems characteristics that show the development limits within hazard areas and planning to protect against dangers [14, 22] |
||||
|
Credit |
Light Pollution Reduction |
11 |
Sky Glow Measurement: Achieve at or below 4 in the Bortle Dark-Sky and A minimum of 70% of the street lighting |
The characteristics of Light Pollution that show sky glow measurement and affecting factors: The rapid urbanization expansion, economic growth, and misuse of available technologies [23]. |
Ecology: Energy-Urban |
1 |
|
Credit |
Resilience Planning |
12 |
Vulnerability and Capacity Assessment |
Vulnerability and Capacity Assessment for climate change hazards, natural and man-made hazards, and extreme events |
Ecology: risks-Urban |
2 |
|
13 |
Resilience Plan |
Adaptation and mitigation strategies that address the goals identified under Vulnerability and Capacity Assessment |
2 |
|||
|
TRANSPORTATION AND LAND USE |
|
|||||
|
Prerequisite |
Transportation Performance |
1 |
Transportation performance score, vehicle miles traveled (VMT) per capita |
Factors affecting vehicle miles traveled (VMT) per capita: Population density, employment by geographic unit, land-use mix like work-housing balance, city design, accessibility to the destination, and distance to transit [24], the unemployment rate, personal income, family size, and the availability of public transit [25]. |
Urban -Social |
6 |
|
Credit |
Compact, Mixed Use and Transit Oriented Development |
2 |
Percentage of population residing within Compact and Complete Centers (Total of all CCCs), 40% minimum. |
Factors affecting the percentage of population residing within Compact and Complete Centers (Total of all CCCs) relate to planning and design of the city that are related to its characteristics, function, and developmental role [26]. |
Urban |
2 |
|
Credit |
Access to Quality Transit |
3 |
Quality of Transit Facilities: At least 80% of transit facilities safe and comfortable. Intermodal Connectivity: Connected to three or more modes of transportation. Frequency of Trips: Meeting the minimum requirement of 72 weekday trips and 30 weekend trips |
Factors affecting the Quality of Transit Facilities (safe and comfortable), Intermodal Connectivity (traffic flow, and linkages between regional centers [27], increase non-motorized transportation, reduce the use of private cars, and more energy-efficient transportation [28], and Frequency of Trips (compact, mixed-use, and work places) [29]. |
Urban |
1 |
|
Credit |
Alternative Fuel Vehicles |
4 |
Electric Vehicle Charging Facilities: (EVSE) in 2% of all public parking spaces or at least two spaces |
Factors affecting the promoting and adopting alternatives to fossil fuel vehicles: Electric Vehicle Charging Facilities and Alternative Fuel Stations [30]. |
Urban |
2 |
|
5 |
Alternative Fuel Stations: A total of 12 stations meet or exceed 1.52 per 10,000 residents or comply with local or national equivalent |
|||||
|
Credit |
Smart Mobility and Transportation Policy |
6 |
Adopting any four solutions or policies to support smart and efficient transportation system. |
Factors affecting the support of smart and efficient transportation systems like applying modern technology of a smart transportation system on roads and axes linking cities and logistic areas [31]. |
Urban- Political |
2 |
|
Credit |
High-Priority Site |
7 |
Historic preservation for cities with at least one historic building, contributing building in a historic district, or designated cultural site that may be impacted by development |
The characteristics of historic buildings and cultural sites to show the impact of development on the preservation of them [32, 33]. |
Historical-Cultural |
2 |
|
8 |
High-Priority Sites and other locations, adopt policies to focus on development and growth |
Affecting factors identify high-priority sites that include priority development areas, infill and/or previously developed sites or brownfield and/or greyfield sites to clean up and reuse. |
Geographical- political-Urban |
|||
|
WATER EFFICIENCY |
|
|||||
|
Prerequisite |
Water Access and Quality |
1 |
Water and Sanitation Access: 100% coverage of all buildings |
Factors affecting Water and Sanitation Access: Geographical location, sources of water, infrastructure, and cost. |
Ecology: water-Urban-Economic-Social-cultural-political-Geographical |
R |
|
2 |
Drinking Water Quality: The annual average concentration of dissolved oxygen (DO) is not less than 6 mg/L [34]. |
Drinking water characteristics that show factors affecting the quality of drinking water and the extent to which water treatment facilities comply with the adopted drinking water quality standard |
||||
|
3 |
Treated Wastewater Quality: 100% of wastewater treatment systems must comply with the permit program of the Clean Water Act |
Factors affecting treated wastewater quality and to what extent they comply with the adopted wastewater treatment and quality standards: The annual average concentration of organic matter (BOD) is not more than 6 mg/L) [34, 35]. |
||||
|
4 |
Storm water Quality: Adopting a policy for storm water pollution prevention |
Factors affecting Stormwater quality that show to what extent they comply with National Pollutant Discharge Elimination System for stormwater pollution prevention from construction and industrial activities and municipal sources [36, 37]. |
||||
|
Prerequisite |
Water Performance |
5 |
Water performance score: A minimum of 40 |
Factors affecting less per capita domestic water consumption: Climatic conditions, availability of alternative water sources and quality, culture and people's habits, water cost, socio-economic status and the total population [38, 39]. |
Ecology: water-Urban-Economic-Social-cultural- |
6 |
|
Credit |
Integrated Water Management |
6 |
The ratio of water withdrawals for human use to the total freshwater resources is less than 0.2 |
The characteristics have been included in Factors affecting the prerequisite of Water Efficiency category |
1 |
|
|
Credit |
Storm water Management |
7 |
Reported flooding incidences in the past five years |
The characteristics have been included in factors affecting the prerequisite of Natural System and Ecology, and Water Efficiency, categories. Some influencing factors re related to details at the city level that are related to its characteristics, function and developmental role |
Ecology: water |
2 |
|
8 |
Green Storm water Infrastructure: 35% of the land area has designated green storm water infrastructure |
|||||
|
Credit |
Smart Water Systems |
9 |
Water Audit and Automation: At least Water Audit |
Urban |
2 |
|
|
ENERGY AND GREENHOUSE GAS EMISSIONS |
|
|||||
|
Prerequisite |
Power Access, Reliability and Resiliency |
1 |
Electricity Access: 100% coverage of households or population by electricity service |
Various characteristics and factors that affect the access of electricity: Geographical location, energy sources, infrastructure, and cost [40]. |
Ecology: energy- Urban- Economic- social- cultural- political- |
R |
|
2 |
Reliability Performance Monitoring |
Factors affecting continuous monitoring (automatic or manual) and recording of interruptions for the complete distribution network at high, medium, and low voltage levels and the possibility of providing smart networks that are affected by renewable energy resources, Smart Transmission, Smart Distribution (Utilization), Pumping and storage stations, Natural disasters, and Backup power [41, 42]. |
||||
|
3 |
Power Surety and Resiliency |
Factors that affect the supply of backup power for critical cities loads or emergency services and basic services during outages or widespread disasters, and also affect the providing of smart networks [43]. |
||||
|
Credit |
Energy and GHG Emissions Performance |
4 |
Energy and Greenhouse Gas (GHG) Performance Score: A minimum of 40 |
Factors affecting Greenhouse Gas emissions (CO2 equivalent): The annual energy consumption from all sectors (the electricity- transportation- manufacturing- construction- emissions from oil and natural gas), the source of energy, emissions co-efficient for electricity and all fuel types, the total population [16]. |
14 |
|
|
Credit |
Energy Efficiency |
5 |
Street Lighting and Public Area Lighting: A minimum of 70% of the street lighting |
The influencing factors related to details at the level of the city that are related to its characteristics, function and developmental role |
Urban |
4 |
|
6 |
Water and Wastewater: Meeting energy conservation standards for Pumps for 50% minimum of the pumps used in water supply, drainage, and wastewater treatment |
Ecology: Water-Energy-Air |
||||
|
7 |
% District Energy supplied by DES: 80% minimum |
Some influencing factors have been included in the prerequisite of Energy and Greenhouse Gas Emission category. Some influencing factors are related to details at the level of the city that are related to its characteristics, function and developmental role. |
||||
|
Credit |
Renewable Energy |
8 |
On-Site Renewables: 2% minimum |
6 |
||
|
9 |
New Off-Site Renewables: 20% minimum |
|||||
|
10 |
Existing Off Site Renewables: 60% minimum |
|||||
|
11 |
Green-e Certified RECs and Carbon Offsets:100% |
|||||
|
12 |
Renewable Energy Credits and Carbon Offsets: 150% |
|||||
|
Credit |
Low Carbon Economy |
13 |
Reduction in Greenhouse Gas (GHG) emissions intensity of the economy over a period of three consecutive years |
Ecology-Economic |
4 |
|
|
Credit |
Grid Harmonization |
14 |
Load Management )access to dynamic pricing(, Demand Response) tariff options(, Net Metering and Interconnection Policy |
The influencing factors related to details at the level of the city that are related to its characteristics, function and developmental role. Some influencing factors have been included in the prerequisite of Energy and Greenhouse Gas Emission category. |
Urban |
2 |
|
MATERIALS AND RESOURCES |
|
|||||
|
Prerequisite |
Solid Waste Management |
1 |
Access waste Management Services: 100% |
Various characteristics and factors affecting the access of waste management services |
Ecology-Political- Economic |
R |
|
2 |
Solid Waste Management Plan, Support waste management and diversion strategies |
Factors affecting the Solid waste management plan include segregation, waste storage and collection, waste handling processing facility, and material recovery facility in accordance with local or national regulations [44, 45]. |
||||
|
Prerequisite |
Waste Performance |
3 |
Waste performance score: A minimum of 40 |
Factors affecting rates of resource consumption and efficiency usage (waste generated and diverted), municipal solid waste generated and diverted from landfill (% of the total amount collected): The population growth, waste generation and recycling, and environmental awareness [45, 46]. |
Ecology- Cultural |
4 |
|
Credit |
Special Waste Streams Management |
4 |
Waste generated through special waste streams (in metric tons per year) and waste diverted (percentage diverted) |
The characteristics have been included in the prerequisite of the materials and resources category and are related to the city's function and developmental role |
Ecology- Economic- Urban |
1 |
|
Credit |
Responsible Sourcing for Infrastructure |
5 |
Purchase 20% minimum by cost of permanently installed in top three infrastructure materials |
The influencing factors related to details at the level of the city that are related to its characteristics, function, population size, and developmental role. Some influencing factors have been included in the prerequisite of materials and resources category. |
2 |
|
|
Credit |
Material Recovery |
6 |
Extended Producer Responsibility (EPR) policy: A minimum of 10% of the total annual waste generated |
1 |
||
|
7 |
Audit for all non-recyclable waste generated within the city |
|||||
|
Credit |
Smart Waste Management Systems |
8 |
Pneumatic Transport Systems: Loading Stations, Transport Network, Waste Handling and Processing Facility |
2 |
||
|
9 |
Smart Bins and Route Optimization |
|||||
|
10 |
% of waste handled by smart waste management systems: 20% minimum |
|||||
|
QUALITY OF LIFE |
|
|||||
|
Prere. |
Demographic Assessment |
1 |
Comprehensive demographic narrative describing all of the population and housing characteristics |
The urban, social, and economic characteristics that include the characteristics of population and housing. |
Urban-Social -Economic |
R |
|
Prere |
Quality of Life Performance |
2 |
Quality of Life Performance score: A minimum of 40 |
Factors affecting the quality of life performance in cities: Education, equitability, prosperity, health and safety [13, 47]. |
6 |
|
|
Credit |
Trend Improvements |
3 |
Population with a High School Degree: Equal to or greater than 70%. |
The characteristics included in factors affecting the prerequisite of the Quality of Life category. Some influencing factors relate to details at the city level that are related to its characteristics, function, population size, and developmental role. |
Social |
4 |
|
4 |
Graduation Rate: Equal to or greater than 90%. |
|||||
|
5 |
Small Businesses: Equal to or greater than 20. |
|||||
|
6 |
Unemployment Rate: between 3 to 4 percent |
|||||
|
7 |
Poverty Rate: Declining at a rate of zero poverty by 2025. |
|||||
|
8 |
Percentage of household incomes meeting the living wage standard: Equal to or greater than 80%. |
|||||
|
9 |
Violent Crime: Equal to or less than 5.5 homicides, 70 incidents of forcible rape, and 462.7 aggravated assaults. |
|||||
|
Credit |
Trend Improvements |
10 |
Asthma rate and Hypertension: none, trend decreasing only |
The characteristics included in factors affecting the prerequisite of the Quality of Life category. Some influencing factors relate to details at the city level that are related to its characteristics, function, population size, and developmental role |
Social |
4 |
|
11 |
Obesity rate: equal to or less than 26% |
|||||
|
Credit |
Distributional Equity |
12 |
Equitable Per Capita Income |
Economic- Urban |
4 |
|
|
13 |
Equitable Workforce Mobility, Graduation Rate Equity |
|||||
|
14 |
Equitable Employment |
|||||
|
15 |
Walking Distance Requirement: ( 400 meters) minimum. |
|||||
|
Cred. |
Environmental Justice |
16 |
Reducing the risks and exposure to priority environmental justice conditions for priority areas in the last 5 years. |
Ecology-Political- Economic |
1 |
|
|
Credit |
Housing and Transportation Affordability |
17 |
Comprehensive Housing Policy |
2 |
||
|
18 |
Housing and Transportation Costs: At least 60% of households, compared to the National Typical household, would spend less than 45% on housing and transportation combined. |
|||||
|
Credit |
Civic and Community Engagement |
19 |
Diversity in Appointment to Local Advisory Board |
Social- Political |
2 |
|
|
20 |
Conduct Survey on Community Impact: At least 51% or more of residents |
|||||
|
21 |
Conducting Survey on Neighborhood Cohesion: At least 80% of residents |
|||||
|
22 |
Volunteering by Residents: At least 30% of residents |
|||||
|
Credit |
Civil and Human Rights |
23 |
Adopting a policy-based mission statement to promote a discrimination free quality of life for all |
1 |
||
|
24 |
Initiatives and policies that ensure the voting rights of all eligible voters. |
|||||
|
25 |
Integrating community policing and procedural justice |
|||||
|
26 |
Having in place a local officer or Commission on Human Rights |
|||||
|
INNOVATION |
|
|||||
|
|
Innovation |
1 |
Innovation: Using a strategy not addressed in the LEED for Cities and communities rating system |
The influencing factors related to details at the city level that are related to its characteristics, and there are no factors affecting these criteria that give priority to one environmental zone over another |
- |
6 |
|
2 |
Exemplary Performance |
|||||
|
3 |
GBCI Rating Systems |
|||||
|
REGIONAL PRIORITY |
|
|||||
|
Cred. |
Regional Priority |
1 |
Regional Priority |
The different characteristics that address geographic specific socio-economic and environmental priorities [48-50]. |
All |
4 |
The difference in the characteristics of environmental zones in Egypt is reflected in the affecting factors on the classification criteria for Egyptian sustainable green cities. So, the filtration of these criteria, according to these characteristics, relates to the sustainability of these zones, and the incentives and capabilities to convert cities into sustainable green ones. Table 2 shows the criteria affected by the characteristics of the environmental zones that give priority to one environmental zone over another. It also shows the non-affected criteria that include repetitive characteristics in other previous criteria. It depends on actions for the efficiency of cities, that are related to the characteristics of these cities, their population, development role, and functions.
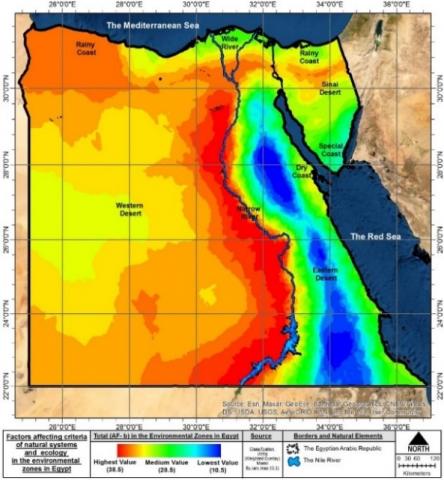
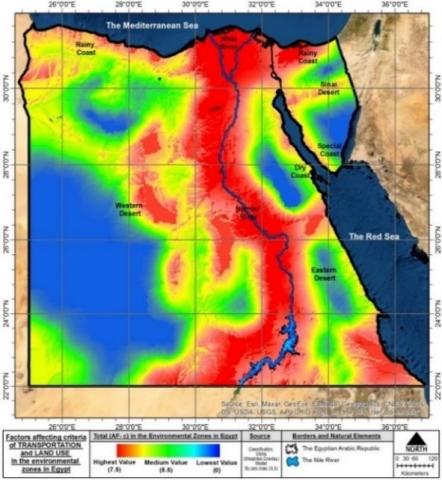
After filtration, the selected criteria for classifying green cities were applied on environmental zones in Egypt in details according to their characteristics that reflect the factors affecting the criteria by scoring these factors in every zone, using the (weighted sum) tool (ArcMap version 10.3) program from the (spatial analyst tools) list and selecting the (overlay) tools, setting the values deduced from the factors affecting each of the criteria of each category, as shown in Eq. (1), and selecting the appropriate field for it to make a reclassification of each weight for ease of assembly. They deduce the classifications for the Egyptian environmental zones, as shown in Figures 3-9.
$\begin{align} & Degree\text{ }of\text{ }AFn=score\text{ }of\text{ }AFn*Wn(Weight\text{ }of\text{ }the\text{ }criteria\text{ }n) \\ & Example:AFb=\sum{AFb1*W1+AFb2*W2+AFb3*W3+...AFbn*Wn} \\\end{align}$ (1)
$Total\text{ }AF=\sum{AFa+AFb+AFc+AFd+AFe+AFf+AFg+AFh}$ (2)
Figure 3. Natural systems and ecology in Egypt, Afb
Figure 4. Transportation and land use in Egypt, Afc
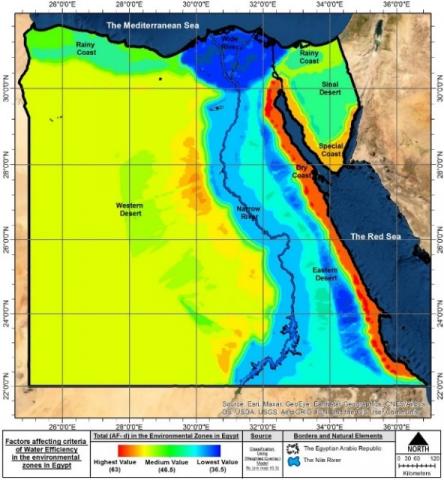
Figure 5. Water efficiency in Egypt, AFd
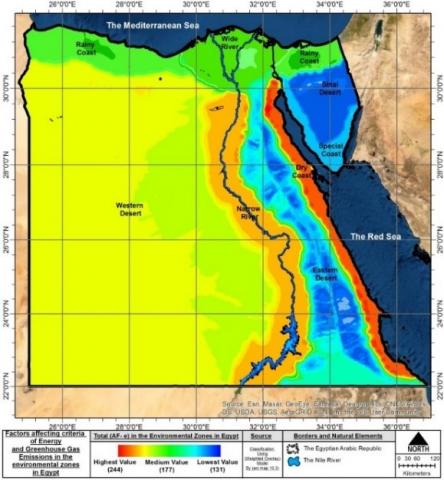
Figure 6. Energy and greenhouse gas emissions in Egypt, Afe
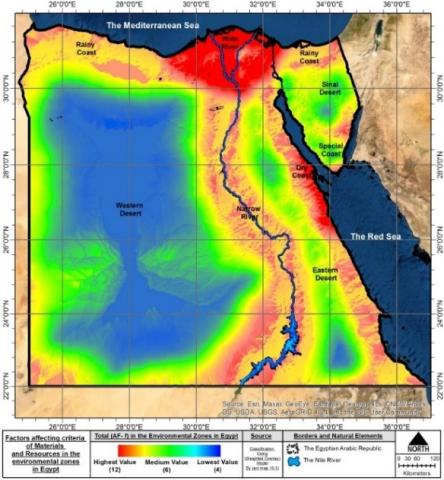
Figure 7. Materials and resources in Egypt, Aff
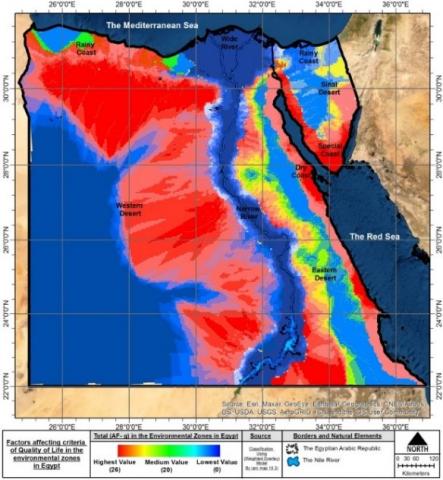
Figure 8. Quality of life in Egypt, AFg
Figure 9. Integrative process and Regional priority in Egypt
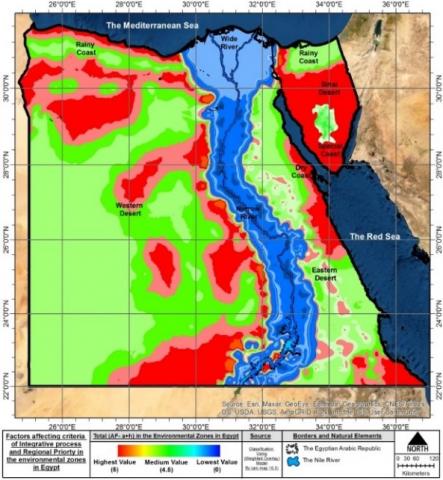
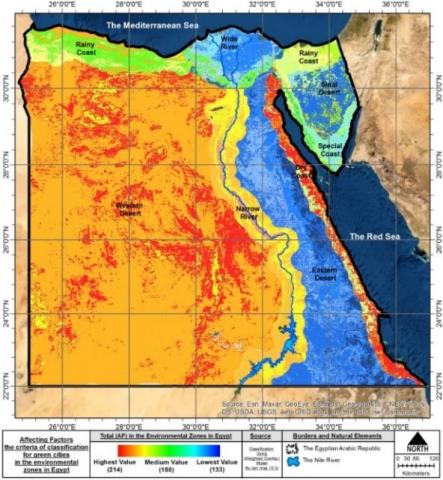
Figure 10. Total AF in the environmental zones in Egypt
Deducing the total AF of the Egyptian environmental regions by aggregating the coefficients of the previous classifications individually, and classifying them according to the coefficients of spatial pixels by a tool (weighted overlay) through putting the coefficients of values in the table of the tool and the ratios calculations for each study through the (ARC program) MAP version 10.3). The values are put according to the ratings (high – medium - low) for easing the general classification, as shown in Eq. (2), and Figure 10.
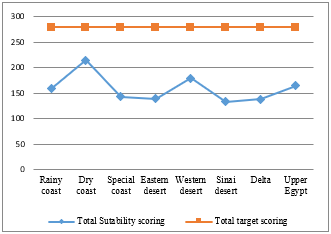
Using suitability scoring system for sustainable green cities according to the characteristics of environmental zones in Egypt is done to arrange these environmental zones according to the priority to habilitate the sustainable green cities in accordance with the selected criteria for classification. Their weight leads to select the most suitable environmental zone, which is the dry coastal zone because of having the incentives and capabilities to turn cities into sustainable green ones, as shown in Table 3, Figures 11 and 12. The value of suitability scoring for Egyptian environmental zones can be calculated by:
$\begin{align} & Suitability\text{ }scoring\text{ }for\text{ }the\text{ }environmental\text{ } \\ & zone=\sum{_{*W(weight\text{ }of\text{ }criteria)}^{Score\text{ }of\text{ }acheving\text{ }criteria}} \\\end{align}$ (3)
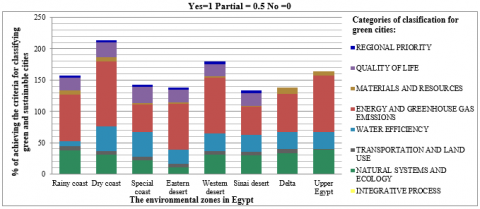
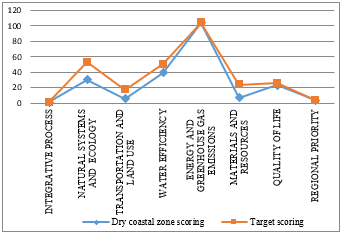
Figure 11 shows that the criteria for classifying green cities in the category of energy and greenhouse gas emission are affected by the characteristics of the environmental zones in Egypt, followed by criteria of natural system and ecology, and the criteria of water efficiency. The dry coastal zone is the most priority environmental zone for habilitating sustainable green cities as it has factors that help increase the chances of achieving green city criteria, as shown in Figure 13; the Western desert zone, the Upper Egypt zone, the Rainy coastal zone, the Special coastal zone, the Eastern desert zone, the Delta zone, and finally the Sinai desert zone, as shown in Figure 12.
Table 3. Suitability scoring system for the environmental zones in Egypt according to the selected criteria for the classification of LEED (CCE) for existing cities
|
Categories |
Code |
The environmental zones in Egypt |
Weight |
|||||||
|
Coastal zone |
Desert zone |
River zone |
||||||||
|
Rainy |
Dry |
Special |
Eastern |
Western |
Sinai |
Delta |
Upper Egypt |
|||
|
INTEGRATIVE PROCESS |
||||||||||
|
Integrative Planning and Leadership |
1 |
1 |
1 |
1 |
0.5 |
1 |
1 |
0.5 |
0 |
1 |
|
NATURAL SYSTEMS AND ECOLOGY |
||||||||||
|
Ecosystem Assessment |
1 |
1 |
1 |
0 |
0 |
1 |
0.5 |
1 |
1 |
9 |
|
2 |
0.5 |
0 |
0.5 |
0 |
1 |
0.5 |
1 |
1 |
||
|
3 |
1 |
1 |
0.5 |
0.5 |
1 |
1 |
1 |
1 |
||
|
4 |
0.5 |
0.5 |
0.5 |
0 |
1 |
0.5 |
0 |
0.5 |
||
|
Green Spaces |
5 |
0.5 |
0 |
1 |
0 |
0.5 |
0 |
0 |
0 |
2 |
|
Natural Resources Conservation and Restoration |
6 |
0 |
0 |
0 |
0 |
0 |
0 |
0 |
0 |
2 |
|
7 |
1 |
1 |
0 |
0.5 |
1 |
1 |
1 |
1 |
||
|
8 |
0 |
0 |
0 |
0 |
0 |
0 |
1 |
1 |
||
|
9 |
1 |
1 |
1 |
0 |
0 |
0 |
0 |
0 |
||
|
10 |
1 |
1 |
1 |
1 |
1 |
1 |
0 |
1 |
||
|
Light Pollution Reduction |
11 |
0.5 |
0.5 |
1 |
1 |
1 |
1 |
0 |
0 |
1 |
|
Resilience Planning |
12 |
0.5 |
0 |
0 |
0.5 |
0.5 |
0 |
0.5 |
0 |
2 |
|
13 |
0.5 |
0.5 |
0.5 |
0.5 |
0.5 |
0.5 |
0.5 |
0.5 |
2 |
|
|
TRANSPORTATION AND LAND USE |
||||||||||
|
Transportation Performance |
1 |
0.5 |
0.5 |
0.5 |
0.5 |
0.5 |
0.5 |
0.5 |
0 |
6 |
|
Access to Quality Transit |
3 |
0.5 |
0.5 |
0.5 |
0 |
0 |
0.5 |
0 |
0 |
1 |
|
Alternative Fuel Vehicles |
4 |
0 |
0 |
0 |
0 |
0 |
0 |
0.5 |
0 |
2 |
|
5 |
0.5 |
0 |
0 |
0 |
0 |
0 |
0.5 |
0 |
||
|
Smart Mobility and Transportation Policy |
6 |
0.5 |
0.5 |
0.5 |
0.5 |
0.5 |
0.5 |
0.5 |
0 |
2 |
|
High-Priority Site |
7 |
0 |
0 |
0 |
0 |
0 |
0 |
0.5 |
0.5 |
2 |
|
8 |
1 |
0.5 |
0.5 |
0.5 |
0.5 |
0.5 |
0 |
0 |
||
|
WATER EFFICIENCY |
||||||||||
|
Water Access and Quality |
1 |
0.5 |
0.5 |
0.5 |
0.5 |
0.5 |
0.5 |
1 |
1 |
11 |
|
2 |
0.5 |
1 |
1 |
0 |
0.5 |
0 |
0.5 |
0.5 |
||
|
3 |
0.5 |
1 |
1 |
0.5 |
0.5 |
1 |
0.5 |
0.5 |
||
|
4 |
0 |
0.5 |
0.5 |
0.5 |
0.5 |
0.5 |
0.5 |
0.5 |
||
|
Water Performance |
5 |
1 |
1 |
1 |
1 |
1 |
1 |
0 |
0 |
6 |
|
ENERGY AND GREENHOUSE GAS EMISSIONS |
||||||||||
|
Power Access, Reliability and Resiliency |
1 |
1 |
1 |
1 |
1 |
1 |
1 |
1 |
1 |
30 |
|
2 |
0.5 |
1 |
0 |
0.5 |
0.5 |
0 |
0.5 |
1 |
||
|
3 |
0.5 |
1 |
0 |
0.5 |
1 |
0 |
0.5 |
1 |
||
|
Energy and Greenhouse Gas Emissions Performance |
4 |
1 |
1 |
1 |
1 |
1 |
1 |
0 |
0 |
14 |
|
MATERIALS AND RESOURCES |
||||||||||
|
Solid Waste Management |
1 |
0 |
0 |
0 |
0 |
0 |
0 |
0.5 |
0 |
10 |
|
2 |
0.5 |
0.5 |
0 |
0 |
0 |
0 |
0.5 |
0.5 |
||
|
3 |
0.5 |
0.5 |
0.5 |
0.5 |
0.5 |
0.5 |
0 |
0.5 |
4 |
|
|
QUALITY OF LIFE |
||||||||||
|
Demographic Assessment |
1 |
1 |
1 |
1 |
1 |
1 |
1 |
0 |
0 |
20 |
|
Quality of Life Performance |
2 |
0 |
0.5 |
1 |
0 |
0 |
0 |
0 |
0 |
6 |
|
REGIONAL PRIORITY |
||||||||||
|
Regional Priority |
1 |
1 |
1 |
1 |
1 |
1 |
1 |
0 |
0 |
4 |
|
Total |
|
158 |
214 |
143 |
139 |
193 |
133 |
138 |
164 |
|
|
Arrange of priority |
|
4 |
1 |
5 |
6 |
2 |
8 |
7 |
3 |
|
Figure 11. Percentage of achieving the criteria for classifying sustainable green cities in the Egyptian environmental zones
Figure 12. The priority of the environmental zones in Egypt according to their characteristics for habilitating the sustainable green cities
Figure 13. Percentage of achieving the criteria for classifying sustainable green cities in the dry coastal zone
While the characteristics of the environmental zones reflect the affecting factors, they affect the criteria for classifying sustainable green cities. If these factors vary from one zone to another, the ability of the cities to be green differs accordingly. The zone that has the potential and opportunities to achieve these criteria should be given the priority because it has the ability to face the problems and challenges that prevent their achievement. The research shows the criteria of classifying green cities’ filtration by selecting the criteria that distinguish the environmental zones according to theirs characteristics. It does not select the criteria that are related to the details of city level and its characteristics. Therefore, the research recommends future research to investigate the relationship between the Egyptian cities’ characteristics and the criteria of classifying green cities. This will help clarify that these criteria are affected by the city’s function, population size, and the developmental role aiming to convert the cities in the same environmental zone into sustainable green ones. The research has compared the affecting factors on the selected criteria for classifying green cities in the Egyptian environmental zones by using the weighted overlay model in the Arc GIS program. The suitability scoring system is used to arrange the priority of these environmental zones, resulting in the dry coastal zone being the most priority environmental zone in Egypt for converting cities into sustainable green ones because it has the characteristics and factors that increase the chances of achieving green city criteria, especially the energy and greenhouse gas emissions criteria.
|
BOD |
Biochemical Oxygen Demand |
|
DES |
Distributed Energy Systems |
|
RECs |
Renewable Energy Certificates |
|
GBCI |
Green Building Certification Institute |
|
AF |
Affecting Factors the criteria of classification for green cities in the environmental zones in Egypt |
|
AFa |
Affecting Factors the criteria of Integrative process |
|
AFb |
Affecting Factors the criteria of Natural systems and ecology |
|
AFc |
Affecting Factors the criteria of Transportation and land use |
|
AFd |
Affecting Factors the criteria of Water efficiency |
|
AFe |
Affecting Factors the criteria of Energy and greenhouse gas emissions |
|
AFf |
Affecting Factors the criteria of Materials and resources |
|
AFg |
Affecting Factors the criteria of Quality of life |
|
AFh |
Affecting Factors the criteria of Regional priority |
|
W |
Weight of the criteria of classification for green cities |
[1] Hegazy, I., Seddik, W., Ibrahim, H. (2017). Towards green cities in developing countries: Egyptian new cities as a case study. International Journal of Low-Carbon Technologies, 12(4): 358-368. http://dx.doi.org/10.1093/ijlct/ctx009
[2] Lehmann, S. (2011). Climate Change - Research and Technology for Adaptation and Mitigation, chapter 14: What is Green Urbanism? Holistic Principles to Transform Cities for Sustainability. ResearchGate. http://dx.doi.org/10.5772/23957
[3] Team, P. (2018). Sustainable Dev elopment Goals Report: Egypt 2030. Fredericks. Pardee Center For International Futures, University of Denver.
[4] Assembly, G. (2017). Work of the Statistical Commission pertainingto the 2030 Agenda for Sustainable Development. United Nations, General Assembly. https://worldtop20.org/global-movement?gclid=EAIaIQobChMIoo3Ewr2F-QIVj-5RCh14OwDxEAAYAiAAEgKFs_D_BwE.
[5] Planners, C. (2014). A global survey of urban sustainability rating tools. http://crit.com/wp-content/uploads/2014/11/criterion_planners_sustainability_ratings_tool.pdf.
[6] Milovidova, A., Sharifi, A., Kawakubo, S. (2020). Chapter 11: Urban sustainability assessment tools: Toward integrating smart city indicators. Urban Systems Design, pp. 345-372. https://doi.org/10.1016/B978-0-12-816055-8.00011-7
[7] Haggag, M.R., Hesham, P. (2019). Productive low cost environmentally friendly village. PLEV National Project, Environmentally friendly – Low cost Sanitation techniques. Ministry of Research, Science & Technology Development Fund (STDF).
[8] Abd El-Ghani, M., Salama, F., Abdel Aleem, M. (2014). Flora and Vegetation of the Eastern Desert of Egypt. Lambert Academic Publisher.
[9] GFDRR. (2020). Arab Republic of Egypt. https://thinkhazard.org/en/report/40765-arab-republic-of-egypt, accessed on July 5, 2021.
[10] MWRI. (2005). National Water Resources Plan 2017, NWRP project. Minisitry of Water Resources and Irrigation, Planning Sector. http://extwprlegs1.fao.org/docs/pdf/egy147082.pdf, accessed on Mar. 6, 2022.
[11] Center, D.R. (2013). Sustainable management of natural resources for combating land degradation and conservation of biodiversity in the oases of western desert, Egypt, project. IPBES, Intergovernmental Science-Policy Platform on Biodiversity and Ecosystem Services, Science and Policy for People and Nature.
[12] El-Ramady, H., Alshaal, T., El-Henawy, A.S., Shams, M.S. (2019). The Soils of Egypt. Springer International Publishing. http://dx.doi.org/10.1007/978-3-319-95516-2
[13] Hegazy, I.R. (2021). The quality of life between theory and implementation in Egypt: The case of Al-Rehab City, Egypt. Ain Shams Engineering Journal, 12(2): 2285-2296. https://doi.org/10.1016/j.asej.2020.09.010
[14] Negm, A., Bek, M., Abdel-Fattah, S. (2019). Egyptian Coastal Lakes and Wetlands: Part I Characteristics and Hydrodynamics. Springer Nature Switzerland AG 2019. http://dx.doi.org/10.1007/978-3-319-93590-4
[15] Denig, S. (2011). African Green City Index, Assessing the environmental performance of Africa’s major cities. Siemens AG. https://digital.zlb.de/viewer/metadata/15502824/1/.
[16] USGBC. (2021). LEED v4.1 Cities And Communities: Existing. U.S. Green Building Council. https://www.usgbc.org/leed/v41#cities-and-communities, accessed on Mar. 6, 2022.
[17] Agency, E.A. (2008). Environmental characterization of the Red Sea Governorate. The Ministry of Environment. https://www.eeaa.gov.eg/en-us/mediacenter/reports/govenvprof.aspx.
[18] Hereher, M., El-Ezaby, K. (2012). Soil .and water quality assessment along the Red Sea coast, Egypt. International Journal of Environmental Studies, 69(1): 65-77. http://dx.doi.org/10.1080/00207233.2011.641241
[19] Prospects, W.U. (2021). Alexandria Population 2021, Other Cities in Egypt. Retrieved July 10, 2021, from World Population Review. https://worldpopulationreview.com/world-cities/alexandria-population.
[20] Authority, E.S. (2021). Egypt in Figures 2021. Central Agency for Public Mobilization and Statistics. https://www.arabdevelopmentportal.com/publication/egypt-figures-environment-2021.
[21] Keleg, M. (2018). Review of green spaces provision approaches in Cairo, Egypt. Research Student Conference 2018 - Faculty of Technology, Design and Environment At: Oxford Brookes University. https://radar.brookes.ac.uk/radar/items/c7b7409e-f799-45ff-8de2-5b2280801433/1/.
[22] Agency, E.A. (2006). National plan to confront environmental disasters. Environmental Affairs Agency, the Arab Republic of Egypt. https://www.eeaa.gov.eg/en-us/topics/general/crises/emergencyplans.aspx.
[23] Kamel, S., Sabry, H., Hassan, G., et al. (2020). Architecture and Urbanism: A Smart Outlook, chapter: Visual Pollution: An Approach to Reduce the Environmental Impact of Light Pollution in Egypt. Proceedings of the 3rd International Conference on Architecture and Urban Planning, Cairo, Egypt: Springer Nature Switzerland AG. http://dx.doi.org/10.1007/978-3-030-52584-2
[24] Council, N.R. (2009). Chapter: 3 Impacts of Land use patterns on vehicle miles traveled: Evidence from the literature. Driving and the Built Environment: The Effects of Compact Development on Motorized Travel, Energy Use, and CO2 Emissions -- Special Report 298, National Academy of Sciences.
[25] Hymel, K.M. (2014). Factors influencing vehicle miles traveled in California: Measurement and analysis. California State University, Northridge. https://sor.senate.ca.gov/sites/sor.senate.ca.gov/files/ctools/CCS_Report--Factors_Influencing_Vehicle_Miles_Traveled_in_California.pdf.
[26] Tiemeier, V. (2019). Developing a national urban policy for Egypt: Towards compact cities. Alternative Policy Solutions, public policy research project at the American University in Cairo. https://aps.aucegypt.edu/en/articles/85/developing-a-national-urban-policy-for-egypt-towards-compact-cities.
[27] (JICA), J. (2008). The Study on Multimodal Transport and Logistics System the Eastern Mediterranean Region and Master Plan in the Arab Republic of Egypt, Chapter 4. Transport Planning Authority, Ministry of Transport, the Arab Republic of Egypt. https://openjicareport.jica.go.jp/pdf/11893450_01.pdf.
[28] Wong, R. (2013). United Nations Development Programme, Evaluation of UNDP/GEF Project: Egypt Sustainable Transport. Egyptian Environmental Affairs Agency. https://erc.undp.org/evaluation/documents/detail/6654.
[29] Youssef, M., Lila, A. (2014). Transit Oriented Development (TOD) as aholistic appraoch for future urbanism in Egypt. Conference: 10th International conference "Role of Engineering Towards a Better Environment". Alexandria, Egypt: researchgate. https://www.researchgate.net/publication/291830455.
[30] Energy, M.O. (2019). Electric vehicles in Egypt opportunities and challenges. Strategic Business Advisors. http://www.lynxegypt.com/assets/pdfs/IndustryNotes1-2019.pdf.
[31] Staff, E.T. (2020). Egyptian president urges quick implementation of smart transportation system. Retrieved Sep. 1, 2021, from Egypt Today. https://www.egypttoday.com/Article.
[32] El-Saeed, Y. (2013). A call to protect Egypt’s monuments and heritage. Save Egypt's heritage for its future. https://dailynewsegypt.com/2013/09/24/a-call-to-protect-egypts-monuments-and-heritage/.
[33] Coordination, T.N. (2010). The foundations and criteria for urban coordination of open areas and green spaces. The National Organization for Civilization Coordination approved by the Supreme Council for Planning and Urban Development According to Law No. 119 of 2008 and Its Executive Regulations. http://www.urbanharmony.org/guide/mosthat%20khdraa.pdf.
[34] Mostafa, S. (2017). State of the Environment Report 2016 Arab Republic of Egypt. Egyptian Ministry of Environment. https://www.eeaa.gov.eg/portals/0/eeaaReports/SoE-2017/Egypt%20SOE%202017%20-%20SPM%20English.pdf.
[35] Saber, M., Es, H., Abouziena, H., Haggag, W., El-Ashry, S., Zaghloul, A. (2016). Management of sewage farming in Arid Region: Egyptian experience. International Scientific Researches Journal, 72(3). http://dx.doi.org/10.21506/j.ponte.2016.3.7
[36] Gado, T., El-Agha, D. (2020). Feasibility of rainwater harvesting for sustainable water management in urban areas of Egypt. Environmental Science and Pollution Research, 27: 32304-32317. http://dx.doi.org/10.1007/s11356-019-06529-5
[37] Helally, H. (2018). Towards Egyptian Stormwater Pollution Prevention. Linkedin. https://www.linkedin.com/pulse/towards-egyptian-stormwater-pollution-prevention-helalley-helalley.
[38] Goal, E. (2019). Per Capita Demand and factors affecting per capita demand. Retrieved October 5, 2021, from Engineering Goal: https://www.engineeringoal.com/2019/07/per-capita-demand.html.
[39] Lema, N., Sabaya, W., Kaseva, M. (2020). Chapter Four: Water demand assessment. In Design, Construction Supervision, Operation and Maintenance (DCOM) Manual Fourth Edition. Mkuki na Nyota Publishers Ltd. https://www.maji.go.tz/uploads/publications/sw1640159401-28.%20Design,%20Construction%20Supervision,%20O&M%20of%20Water%20Projects%20Manual%20Vol.%20IV.pdf.
[40] Mourad, M., Abdel-Rahman, A., Ali, A.H. (2013). Renewable Energy Technologies Utilization in Egyptian Desert Cities. The Seventh Annual Conference of Futuristic Studies At: Assiut, Egypt. https://www.researchgate.net/publication/283349110.
[41] Abou-Ghazala, A., El-Shennawy, T. (2012). Applying the smart grid concept in Egypt: challenges and opportunities. 15th Middlle East Power System Conference (MEPCON 2012), Project: Smart Grid. 15th Middlle East Power System Conference. https://www.researchgate.net/publication/235784014.
[42] Hasan, S., Al-Aqeel, T., El Salmawy, H. (2020). Electricity sectoreatures liberalization in Egypt: Features, challenges and opportunities for market integration. The King Abdullah Petroleum Studies and Research Center (KAPSARC). https://www.kapsarc.org/research/publications/electricity-sector-liberalization-in-egypt-features-challenges-and-opportunities-for-market-integration/.
[43] Enterprise. (2020). With a surplus of electricity, why do we still get power cuts? Retrieved Novmber 10, 2021, from Enterprise: https://enterprise.press/hardhats/surplus-electricity-still-get-power-cuts/.
[44] GIZ. (2019). Improving waste management in Egypt, National Solid Waste Management Programme (NSWMP). Deutsche Gesellschaft für Internationale Zusammenarbeit (GIZ) GmbH: https://www.giz.de/en/worldwide/22230.html, accessed on Nov. 5, 2021.
[45] Ibrahim, M., Mohamed, N.A. (2016). Towards Sustainable Management of Solid Waste in Egypt. Procedia Environmental Sciences, 34: 336-347. http://dx.doi.org/10.1016/j.proenv.2016.04.030
[46] Milik, S.M. (2021). Assessment of solid waste management in Egypt during the last decade in light of the partnership between the Egyptian government and the private sector. AUC Knowledge Fountain. https://fount.aucegypt.edu/cgi/viewcontent.cgi?article=3470&context=retro_etds.
[47] Hassan, D. (2019). Quality of life to achieve new Egyptian cities. Conference: Proceedings of the first international conference Environmental Efficiency For Human Well Being (EBQL) At: J W Marriott Hotel - Cairo, Egypt. ResearchGate. http://dx.doi.org/10.21625/archive.v3i3
[48] El-Din, R.G. (2021). Egypt’s Water Security Situation in the Context of Asia Water Development Outlook Approach. Journal of Al-Azhar University Engineering Sector. http://dx.doi.org/10.21608/auej.2021.166632
[49] Youssef, A. (2017). The national strategic plan for urban development - vision 2052, and the UN sustainable development Goals – SDGs, investigating features of alignment. United Nations Development Programme, ResearchGate. https://www.researchgate.net/publication/338737900.
[50] Planning, G.O. (2014). The national urban development framework in the Arab Republic of Egypt. Ministry of Housing and utilities urban communities. http://gopp.gov.eg/wp-content/uploads/2014/09/.pdf.