Ikramul Hasan Sohel* | Showrov Rahman
© 2020 IIETA. This article is published by IIETA and is licensed under the CC BY 4.0 license (http://creativecommons.org/licenses/by/4.0/).
OPEN ACCESS
Over the past years, energy sectors have accomplished considerable progress in the transition from conventional fossil-based energy to low-carbon energy production, and microgrids are playing important roles in this sustainable energy transition. One of the key challenges for microgrids is to deliver power with the least possible cost and that too with such an approach that the environmental impact is the lowest and the overall system reliability is high enough. For this reason, generation cost, emission entities, and system reliability need to be efficiently optimized. Towards this goal, an online multi-objective technique has been employed to optimize cost, emission and system reliability taking these three factors in pairs at a time. The optimization model is designed using the non-dominated sorting genetic algorithm-II (NSGA-II), and the algorithm has been employed for several double objective scenarios considering reliability as an objective and later as a constraint. To evaluate the performance of the proposed approach, the simulation results are compared with the relative parameters from a different model that uses the strength pareto evolutionary algorithm (SPEA). The results show that the proposed technique satisfies the multi-objective optimization goals and provides good trade-offs between the conflicting objective functions while finding the optimal dispatch.
cost minimization, emission reduction, microgrid, monte Carlo simulation, non-dominated sorting genetic algorithm-II, optimal energy dispatch, reliability analysis
The world is facing the ever-increasing risk of the depletion of non-renewable energy sources at an alarming rate. Additionally, the heavy dependency on fossil-fuel-based energy generation is causing excessive environmental pollution. Therefore, the transition from conventional fossil-fuel-based energy to renewable energy resources is a must to ensure a sustainable future. Microgrids are one of the key tools of this sustainable energy transition process since it provides significant advantages such as lower transmission losses and efficient renewable energy source (RES) integration capability. However, the delivered power through the microgrids needs to be cost-effective and at the same time, the environmental impacts need to be checked. Additionally, the grid-system has to be highly reliable, and this is a very big concern especially for the islanding microgrids. To meet the power demand with the least possible cost, lowest possible environmental impact and higher system reliability, an optimal dispatch system must be modeled based on estimated trade-offs.
Microgrids can ameliorate the quality, reliability, and efficiency of a power system; and it can also create an opportunity to provide grid-independence. According to the U.S. department of energy (DOE), a microgrid can be defined as “a batch of distributed energy resources (DERs) and coordinated loads which maintains all the properties of an electrical system that resembles a controllable single unit with respect to the main power grid”. A microgrid has the ability to connect and disconnect from the main grid enabling it to operate in both grid-connected and islanded mode [1]. To deal with the economic dispatch problem, an efficient energy management system (EMS) is required. The EMS optimizes, monitors and co-ordinates the energy sources connected to the microgrid. In the past decades, several approaches have been proposed regarding EMS as well as the co-ordination between different renewable energy sources connected to microgrids. On the other hand, a number of efforts have also been made for effective generation scheduling in order to minimize the cost and pollution caused by the generator for achieving the optimal eco-friendly operation for the microgrids.
Nikmehr and Najafi-Ravadanegh [2] have reported optimal power dispatching technique based on probabilistic analysis considering technical constraints and economic aspects, and it is solved by applying a heuristic algorithm called imperialist competitive algorithm. Monte carlo simulation (MCS) is also applied to compare the obtained results. Bayat et al. [3] have optimized the operation cost using multi objective particle swarm optimization (MOPSO) in grid connected mode considering the voltage constraints. For intelligent energy generation scheduling, a cost minimization optimization problem is formulated and solved by Wang et al. [4] using robust optimization and chance constraints approximations approaches. Hosseinnezhad et al. [5] have proposed an optimal power scheduling technique in order to minimize the operation cost and emission from the generators by applying species-based quantum particle swarm optimization (SQPSO). Gupta and Gupta [6] have proposed a robust optimization approach for optimal management of a microgrid taking wind power uncertainty into consideration. Askarzadeh [7] has used memory-based genetic algorithm (MGA) to solve the best economic DERs dispatching problem as a single objective optimization and compared his result with Genetic Algorithm (GA), and two variants of Particle Swarm Optimization: PSO with inertia weight (PSOw), PSO with constriction factor (PSOcf).
Multi-objective PSO (MOPSO) technique can be used to develop a solution for the optimal power flow (OPF) problem of medium electrical systems [8]. Improved harmony search (EHS) algorithm can also be applied to resolve the economic dispatch problem [9]. Sundaram et al. [10] have implemented a synergistic hybrid metaheuristic algorithm merging the Nondominated sorting genetic algorithm-II (NSGA- II) and multi-objective PSO (MOPSO) algorithm in order to solve the combined heat and power economic emission dispatch problem. Zhao et al. [11] presented a dynamic economic dispatch model of a microgrid which uses a variant of NSGA-II algorithm with an external penalty function for dealing with the constraint conditions. An improved NSGA-II method is adopted for planning the production of thermal unit for minimizing the cost and emissions [12].
Akram et al. [13] have proposed a methodology to find an optimal combination of hybrid renewable power generation system and energy storage for grid connected microgrids. The modeled hybrid generation system is comprised of solar photovoltaic (PV) and wind turbine (WT), while the hybrid energy storage system (HESS) includes the battery energy storage (BES) system and supercapacitor (SC) technology [13]. To minimize the generation cost of the microgrid, a reduced gradient algorithm (RGA) is applied on three generating units considering load demand as a constraint [14]. An algorithm based on dynamic programming (DP) has been proposed to minimize the cost and emission of CO2 as a form of cost [15]. Liu et al. [16] proposed that an optimal day-ahead bidding strategy can be used for finding the lowest possible net expected cost based on a hybrid robust or stochastic algorithm. Based on a robust optimization technique taking islanding capability as a constraint and cost minimization as a single objective, an economic dispatching model for a microgrid can be implemented [17].
For dealing with the reliability analysis, probabilistic techniques are extensively used. Billinton et al. [18] have presented composite DC power system adequacy assessment with monte carlo simulation (MCS). Billinton and Jonnavithula [19] have presented two variance-reduction techniques to improve the performance of sequential monte carlo simulation. The enhanced model is then applied for the adequacy analysis of a six-bus test system and a 24-bus system. It was suggested that system adequacy assessment of a composite system can also be evaluated by using a procedure called contingency evaluation instead of monte carlo simulation (MCS) [20]. A system reliability assessment based on spot pricing has been propose by Goel et al. [21]. Billinton and Wenyuan have evaluated the reliability of bulk composite system with the help of monte carlo simulation [22]. Henneaux et al. [23] have estimated the confidence intervals (CI) of reliability indices using monte carlo simulation method.
In this paper, we have applied the non-dominated sorting genetic algorithm-II (NSGA-II) for multi-objective optimization by adding a nonlinear and non-convex objective for green-house-gas (GHG) emission, generation cost and system reliability. The proposed non-dominated sorting genetic algorithm-II (NSGA-II) is designed using MATLAB simulation software. The designed algorithm is then applied for multi-objective optimization purposes to optimize cost, emission and reliability by taking them in pairs, considering double objective functions at a time. The simulation results provide trade-offs between fuel cost Vs emission; fuel cost Vs reliability; and emission Vs reliability. In order to compare and verify the effectiveness of our proposed model, the simulation results of the energy dispatch, cost and emission quantities are compared with relevant parameters of another model which uses the strength pareto evolutionary algorithm (SPEA). The comparison between NSGA- II and SPEA model, verifies that the NSGA- II performes efficiently. After verifiying the performance of the proposed model, NSGA- II algorithm is applied to find out the optimized values of cost and emission but at this time the reliability factor is considered as a constraint.
The structure of this paper is organized as follows: section 2 presents the system description, section 3 demonstrates the problem statement, section 4 presents the solution methodology, section 5 shows the simulation results and lastly the conclusion of this study is presented in section 6.
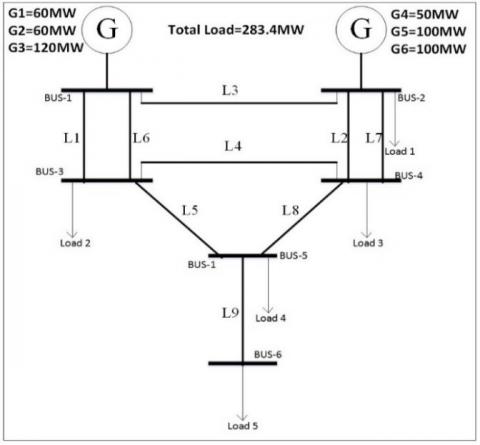
The topological model of the studied microgrid system is shown in Figure 1. The test system shown in Figure 1 is a modified version of Roy Bilinton Test System (RBTS) which is a widely used test system for electric power system analysis. Figure 1 illustates the diagram of the modified 6-bus RBTS system with the six distributed generators (DGs) and load connections. The microgrid is assumed to be connected with the main grid at bus 1.
Figure 1. System topology
To develop an on line algorithm, we need load data and status of the generators. In order to collect these data, the DGs should communicate with each other in a microgrid as illustrated in Figure 1. All the information is analyzed by the algorithms to select which generation sources should supply power to the loads with the least possible cost and toxic gas emission like SO2 and NO2.
3.1 Problem objective
An economic, environment friendly and reliable power dispatching problem has three objective functions, one is minimizing fuel cost, second one is minimizing the emission from the generators and the third one is minimizing the unserved energy (EENS) or maximizing the reliability.
The electricity generation schemes largely depend on its cost. For minimizing the cost of the studied microgrid, a common quadratic cost function has been considered. This cost function FC(Pg) can be expressed as follows [24]:
$F C\left(P_{g}\right)=C_{g i}\left(P_{g i}\right)=\alpha_{g i} P_{g i}^{2}+\beta_{g i} P_{g i}+\gamma_{g i}$ (1)
In Eq. (1), C denotes the cost per hour in USD($), gi implies the i th distributed generator, P denotes the real power generated by a distributed generator in MW, and α, β and γ are the cost coefficients which are listed in Table I.
The environmental pollutant gases emitted from fossil-fuel-run conventional generators have been modeled separately in [25]. The emission can be expressed in ton/hr to detect the amount of the pollutant gases emitted from the generators. The total emission function E(Pg) can be written as follows [25],
$E\left(P_{g}\right)=\sum_{i=1}^{N G}\left[10^{-2}\left(a_{i}+b_{i} P_{g i}+c_{i} P_{g i}^{2}\right)+d_{i} \exp \left(e_{i} P_{g i}\right)\right]$ (2)
where, NG is the number of generators; Pg refers to the real power output vector consists of all the generator outputs such that $P_{g}=\left[P_{g 1, P_{g 2}, P_{g 3, \ldots \ldots,}} P_{g N G}\right]$; $P_{g i}$ represents the real power generated from i-th generator; and $a_{i}, b, c i, d i, e_{i}$ are the emission coefficients of the i-th generator listed in Table 1 [25].
The reliability evaluation algorithm calculates the total curtailed power with the help of power flow algorithm and finds the total amount of unserved power of the system. Finally, it calculates the expected energy not served (EENS) by using the simplified equation of the reliability evaluation function R(Pg) [26],
$R\left(P_{g}\right)=E E N S\left(P_{g}\right)=\sum_{i \in S} C_{i} F_{i} D_{i}=\sum_{i \in S} 8760 C_{i} p_{i}$
$E D N S=\sum_{i \in S} C_{i} p_{i}$ (3)
where, S is the set of all system states associated with loss of load; Ci is the curtailment of load for ith system state; Fi represents the frequency of departing system state i, pi is the duration of system state i; and pi is the probability of the ith system state. In Eq. (3) EDNS stands for expected demand not supplied (MW).
3.2 Objective constraints
Constraint of power balance: The power balance constraint is a very important constraint for the minimization cost problem. That is because if the dispatching algorithm does not meet this constraint, it can generate power more than the demanded power which will end in higher fuel cost and higher emission of toxic gas. Likewise, it can also generate power that is lower than the demand if this constraint is not satisfied. Both these conditions inrrupts the economic power dispatch process. That is why, the total power generation must be equal to the total power load demand Pd and the real power loss PLoss, for the power transmission. PLoss is assumed to be zero here. Therefore, the resulting power balance equation is shown in Eq. (4),
$\sum_{i=1}^{N G} P_{g i}-P_{d}-P_{\text {Loss}}=0$ (4)
Constraint of generation capacity: The real power output from each generator is confined by a lower limit and an upper limit for the stable operation of the generators as follows:
$P_{g i}^{\max } \geq P_{g i} \geq P_{g i}^{\min }, i=1,2, \ldots \ldots, N G$ (5)
Reliability constraint: The expected energy not served (EENS) calculated by the Eq. (3) is confined by an upper limit for the reliable operation of the generators. This limitation is implemented by Eq. (6) as follows,
$R\left(P_{g)} \leq E E N S_{P g}^{\max }\right.$ (6)
3.3 Problem statement
Combining all the objectives and constraints, the multi-objective optimization problem can be mathematically formulated as a non-linear constrained problem as follows:
Minimize$P_{g}$$\left[\begin{array}{c}F C\left(P_{g}\right), E\left(P_{g}\right) ; F C\left(P_{g}\right), R\left(P_{g}\right) ;\\ E\left(P_{g}\right), R\left(P_{g}\right)\end{array}\right]$ (7)
A penalty factor has been used as a preference controller for the constraint given in Eq. (4) when combined with Eq. (1) during optimization. The value of this penalty factor is 10 in our case which is directly taken from [7].
3.4 Monte Carlo simulation for reliability analysis
The reliability of a system is represented by a numerical value between 0 and 1 or 0 to 100%. A power system is normally very complex as huge amount of equipments are connected with each other, and it is very difficult to evaluate the reliability value for the whole system. Therefore, some of the system adequacy parameters such as EENS, EDNS etc. are used to define the reliability of a system. So, to define the reliability of a system shown in Figure 1, evaluation of EENS is considered as a reliability function. The EENS is calculated as a function of generated/ dispatched power from each generator. Though the dispatched power is not directly involved in the calculation of EENS, a dispatching sample is passed from the optimization algorithm to the EENS evaluation algorithm. EENS evaluation algorithm then evaluates the amount of load curtailed that means the power shortage between the load and the generated power due to the outage of a generator and line failures [26]. The outage of a generator or a line failure is calculated by the use of Monte Carlo Simulation Technique.
For the reliability analysis, Monte Carlo Simulation has been implemented to find the system adequacy parameters. For the calculation of reliability, some indices are used in order to assess the system adequacy. Since the reliability is a numerical parameter that can vary between zero and one mathematically, the values of these indices will determine the system adequacy. Some of these indices are loss of load probability (LOLP), expected demand not served (EDNS), expected energy not served (EENS), system minutes (SM) etc. EENS calculation will be used for this paper as reliability function.
We have focused on EENS (MWh/yr). It is one of the major indices of system adequacy assessment. All most all literature on system adequacy assessment, calculates the EENS [27, 28].
Different papers have used different formula to calculate the EENS. In our calculation, we have used the formula for the implementation in MATLAB stated below,
$E E N S=\frac{1}{\text {simulation}} \sum_{i=1}^{\text {simulation}}\left(\frac{1}{\text {sample}} \sum_{j=1}^{\text {sample}}\right.$discont.load$)$ (8)
$F O R=\frac{\lambda[f / y e a r] * r[h]}{(\lambda[f / y e a r] * r[h])+8760}$ (9)
where, discont. load is an abbreviation of disconnected load, FOR refers to forced outage rates, λ is outage rate per year and 'r' represents outage duration. 8760 shows the number of hours per year. Eq. (8) has been used in Monte Carlo Simulation to calculate the outage rate of all the generators and lines. According to their outage, the loads are disconnected which is used in Eq. (7) in MATLAB formulation for calculating EENS. All the reliability parameters for our system is given in Table 2.
4.1 Heuristic methods for optimization
Although the distributed generation of electricity using RESs is more environment friendly compared to conventional energy production, it is often very challenging to find the best dispatch scheme for the distributed energy source (DERs) without analyzing the generation/fuel cost. Both of these conflicting but vital objectives are trade-offs which are not possible to be solved without heuristic optimization techniques. There are a lot of algorithms which have already been applied to find the best possible trade-offs. For example, many authors have applied memory-based genetic algorithm (MGA), artificial fish swarm (AFS), additive-increase multiplicative-decrease (AIMD), direct search method (DSM), lambda iteration, lambda logic, and particle swarm optimization (PSO) for finding the best economic dispatch considering different constraints [7, 24, 29, 30]. But to the best of our knowledge, none of them has employed NSGA-II algorithm for finding the trade-offs between lowest cost, least emission entities as well as highest reliability all together. Therefore, NSGA-II algorithm has been considered here to find the optimal solution for dispatching six generators with the minimum possible cost, lowest toxic gas emission, and the highest reliability.
4.2 NSGA-II: Non-dominated sorting genetic algorithm-II
Complex calculation process, absence of elitism, and requirement of specified sharing parameter are the main drawbacks of non-dominantly sorted and shared multi-objective evolutionary algorithms. For eliminating these difficulties, Deb et al. have proposed a new non-dominated sorting-based evolutionary algorithm called NSGA-II [31]. The authors have proposed an improved version of the non-dominated sorting genetic algorithm which was proposed in [32]. They modified it for eliminating the criticisms mentioned above. The modified NSGA- II algorithm provides superior performance for both single and multi-objective optimization problems with or without constraint functions. Furthermore, NGSA-II does not need memory and it performs well in single and multi-objective as well as multi-constraints scenarios. It is also easy to implement and interpret. In addition, it works well as an online algorithm for optimization. For all these reasons, NSGA-II is chosen as a base to propose a solution.
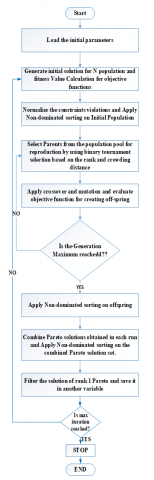
Figure 2. Flow chart of proposed algorithm
The application of basic NSGA-II [31, 33] have been combined in this paper in order to propose a new approach for optimal dispatching method as well as for multi-objective optimization. The performance comparison of NSGA-II performed by Deb et al. [31] has dealt with the un-equality constraints only for all the four constrained multi-objective optimization problems. But in the multi-objective optimization case1 discussed in this paper, one equality constraint Eq. (4) has been considered. To deal with this issue, the constraint handling techniques have been modified here in our modified version. Other modifications are shown in the flow chart in Figure 2 in comparison with the flow chart presented in previous literature [33].
Like all other genetic algorithm, this algorithm has also been used population and maximum number of generation. For a defined number of iteration, this algorithm has been started from generation of initial population according to the limit of each power generator and applying random matrix function to produce random initial solution matrices. Using our defined multi objective function, this initial population has been evaluated and saved in matrices according to the serial number of best solution and accuracy. After normalising the errors with a user defined normalisation function, this initial population has gone through non domination sorting and crowding distance evaluation through another user defined function. After that the generation count starts inside a loop where the last population has gone through tournamnt selection, crossover and polynomial mutation to create child offspring. After that this child offspring has gone through the objective evaluation function mentioned earlier again to determine the accuracy and fitness with the multi-objective functions to build intermediate population. This intermediate population then gone through the non dominated sorting and according to the fitness rank and accuracy, new population has been built by replacing the previous intermediate population. Finally this new population has been combined with the pareto solution obtained in each run and the rank one solution is saved with a front number. These steps continued untill the maximum generation number reached and all of these steps continued for the defined number of iteration.
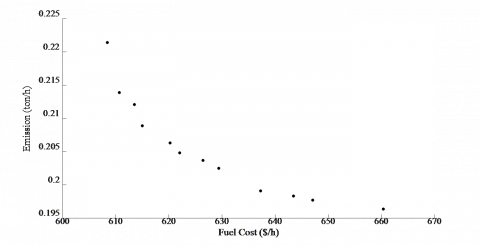
After the number of iteration reached to its maximum value, all the highest rank solutions are plotted and the pareto optimal front is obtained as shown in Figure 3. These procedures have been repeated for all the multi-objective pairs and for both case 1 and 2. In the user defined objective function we have considered reliability (EENS) as an objective function in case-1; for case 2, the same reliability parameter EENS has been used as a constraint.
Figure 3. Pareto-optimal front of solutions for cost and emission
The proposed non-dominated sorting genetic algorithm-II (NSGA- II) models are designed using MATLAB simulation software. The proposed algorithm is designed to optimize two objective functions at a time, and for this reason, pairwise objective functions among fuel cost, emission, and reliability (expected energy not served -EENS) are considered. The proposed algorithms have been run 30 times and the best performance of each run of each algorithm is reported. The parameter setting of the proposed algorithms are as follows: Population size = 100, maximum number of generations =500, distribution index for crossover=20, distribution index for mutation/mutation constant=100 and Mutation Probability=0.16667. For multi-objective optimization, two different cases have been considered.
Case 1: the power balance equation given in Eq. (4) is taken as constraint to optimize:
a) Eq. (1) and Eq. (2) to find the optimized values or trade-offs between fule cost and emission
b) Eq. (1) and Eq. (3) to find the optimized values or trade-offs between fule cost and reliability (expected energy not served -EENS)
c) Eq. (2) and Eq. (3) to find the optimized values and dispatch parameters for emission and reliability (expected energy not served -EENS)
The capacity of the fossil-fuel-run generators and the cost coefficients of emission function are necessary for analyzing the cost and emission function, and the co-efficient values are listed in Table 1 [24, 25]. In Table 1. α, β, γ represents the cost coefficients and a,b,c,d,e are the emission coefficients.
Table 1. Cost and emission coefficients of the distributed generators [24, 25]
|
|
|
G1 |
G2 |
G3 |
G4 |
G5 |
G6 |
|
Cost |
α |
10 |
10 |
10 |
20 |
20 |
10 |
|
β |
150 |
150 |
100 |
180 |
180 |
200 |
|
|
γ |
120 |
100 |
60 |
40 |
40 |
100 |
|
|
Emission |
a |
2.543 |
6.131 |
5.426 |
4.258 |
4.258 |
4.091 |
|
b |
-6.04 |
-5.55 |
-3.55 |
-5.09 |
-5.09 |
-5.55 |
|
|
c |
5.638 |
5.151 |
3.38 |
4.586 |
4.586 |
6.49 |
|
|
d |
5E- 4 |
1E- 5 |
2E- 3 |
1E- 6 |
1E- 6 |
2E- 4 |
|
|
e |
3.333 |
6.667 |
2.000 |
8.000 |
8.000 |
2.857 |
For case 1, at first, the fuel cost of generators and emissions from each generator are minimized with the proposed multi-objective optimization algorithm for the microgrid considered in Figure 1. The best economic fuel cost and the lowest emission objectives have been optimized separately by the proposed approach in order to find the lowest possible cost and emission points in solution space. The diversity of the solution space can also be evaluated by this method. The results of the best fuel cost and lowest emission are given in Table 3. The paprameters G1, G2, ..., G6 represents the power dispatch in mega-watts for generators 1, 2, ..., 6 respectively.
In order to validate the accuracy of the applied NSGA- II, the results are compared with another multi-objective optimization model based on the strength pareto evolutionary algorithm (SPEA). The comparison between NSGA- II and SPEA is demonstrated in Table 4. The Pareto-optimal front of solutions for cost and emission is shown in Figure 3. From Table 4 and Figure 3, it can be stated that the proposed NSGA- II algorithm is a good choice for minimizing the fuel cost and emission. The results are very close to each other with small differences in values in comparison with SPEA but pareto optimal front (shown in Figure 3) proves that the proposed algorithm can also perform the multi-objective optimization very effectively. Therefore, the designed algorithm is capable of performing optimization for other multi-objective optimization processes as well.
Table 2. Modified reliability parameters
|
Reliability information |
||||
|
Component Number |
Component name |
λ [f/year] |
r [h] |
Unavailability or FOR |
|
|
G1 |
6.05 |
45 |
0.03 |
|
|
G2 |
6.05 |
45 |
0.03 |
|
|
G3 |
12.45 |
45 |
0.06 |
|
|
G4 |
10.25 |
45 |
0.05 |
|
|
G5 |
10.25 |
45 |
0.05 |
|
|
G6 |
4 |
45 |
0.02 |
|
|
Load 1 |
-1 |
0 |
0 |
|
|
Load 2 |
-1 |
0 |
0 |
|
|
Load 3 |
-1 |
0 |
0 |
|
|
Load 4 |
-1 |
0 |
0 |
|
|
Load 5 |
-1 |
0 |
0 |
|
|
Line 1 |
1.5 |
10 |
0.0011 |
|
|
Line 2 |
5 |
10 |
0.0011 |
|
|
Line 3 |
4 |
10 |
0.0011 |
|
|
Line 4 |
1 |
10 |
0.0011 |
|
|
Line 5 |
1 |
10 |
0.0011 |
|
|
Line 6 |
1.5 |
10 |
0.0011 |
|
|
Line 7 |
5 |
10 |
0.0011 |
|
|
Line 8 |
1 |
10 |
0.0011 |
|
|
Line 9 |
1 |
10 |
0.0011 |
Table 3. Fuel cost and emission optimized for case 1
|
|
Fuel Cost |
Emission |
|
G1(MW) |
27.25 |
46.22 |
|
G2(MW) |
34.14 |
47.80 |
|
G3(MW) |
100.77 |
37.38 |
|
G4(MW) |
42.51 |
59.21 |
|
G5(MW) |
64.37 |
59.44 |
|
G6(MW) |
17.04 |
36.32 |
|
Cost($/hr) |
607.51 |
--- |
|
Emission(ton/hr) |
--- |
0.19465 |
Table 4. Optimized results for fuel cost and emission for case1
|
Parameters |
Fuel Cost |
Emission |
||
|
SPEA [25] |
NSGA-II |
SPEA [25] |
NSGA-II |
|
|
G1(MW) |
30.56 |
20.51 |
45.25 |
54.06 |
|
G2(MW) |
35.84 |
35.34 |
50.05 |
49.98 |
|
G3(MW) |
98.46 |
102.56 |
40.79 |
37.20 |
|
G4(MW) |
58.18 |
57.84 |
55.25 |
60.53 |
|
G5(MW) |
52.88 |
62.28 |
54.68 |
47.37 |
|
G6(MW) |
10.86 |
7.86 |
40.43 |
36.98 |
|
Cost ($/hr) |
607.807 |
608.413 |
642.603 |
647.101 |
|
Emission(ton/hr) |
0.22015 |
0.2271 |
0.19422 |
0.19516 |
In the next stage, the cost function and EENS function (as a measurement of reliability) are considered for double objective optimization. Both the fuel cost and EENS are set as a minimization function in this scenario. The best results obtained after performing the optimization with the proposed algorithm are presented in Table 5.
Table 5. Optimized results for fuel cost and reliability for case 1
|
Parameters |
Best Cost |
Most Reliable |
|
Dispatch (MW) |
Dispatch (MW) |
|
|
G1 |
23.70 |
42.86 |
|
G2 |
21.75 |
19.09 |
|
G3 |
115.03 |
88.42 |
|
G4 |
37.10 |
24.67 |
|
G5 |
59.22 |
63.30 |
|
G6 |
28.79 |
46.18 |
|
Cost ($/hr) |
612.8253 |
624.4329 |
|
EENS(MWhr/yr) |
122603 |
95427 |
|
EDNS(MW) |
13.99 |
10.89 |
In Table 5, EDNS refers to the expected demand not supplied. From Table 5, it can be seen that in order to have the most economic dispatch for the microgrid, the generation system needs to reserve 3.1 more MW generation capacity than the most reliable dispatch. On the other hand, for maintaining the most reliable dispatch for the microgrid, 11.60 more USD needs to be spent on the fuel every hour.
Lastly for case 1, the emission objective function of the generators in equation Eq. (2) is considered along with the EENS function shown in Eq. (3). The proposed algorithm has been tried to minimize both of them remaining in the boundary of power balance or subjecting to the constraint of power balance alone. The simulation results have been presented in Table 6. Table 6, presents the dispatch values of all the six generators for achieving the least emission and least EENS (in other words highest reliability).
Table 6. Optimized results for emission and reliability objectives for case 1
|
Parameters |
Dispatch (MW) |
|
G1 |
33.60 |
|
G2 |
36.34 |
|
G3 |
70.57 |
|
G4 |
59.93 |
|
G5 |
49.03 |
|
G6 |
36.58 |
|
Least Emission(ton/hr) |
0.20146 |
|
Least EENS(MWhr/yr) |
87499.62 |
|
Least EDNS(MW) |
9.989 |
Case 2: The fuel cost function in Eq. (1) and the emission function in Eq. (2) have been considered for a multi-objective optimization process taking the power balance, generation capacity, and reliability constraints into account. In case 1, reliability is considered as an objective in terms of EENS. But, in this case, the EENS factor is applied as a constraint in order to optimize cost and emission. The maximum EENS allowed in this case, is 1.165% (50000 MWhr/yr) of the total energy supplying capacity of the generators. The best results for cost and emission are presented in Table 7.
From Table 7, it can be observed that by keeping the EENS within a certain limit to ensure higher system reliability, saving fuel cost will cause more environmental pollution, while saving the environment by keeping the system highly reliable will cost 27.1 USD more per hour.
Table 7. Optimized results for cost and emission for achieving highest reliability for case 2
|
|
Best Cost |
Best Emission |
|
Dispatch (MW) |
Dispatch (MW) |
|
|
G1 |
19 |
48 |
|
G2 |
56 |
56 |
|
G3 |
119 |
73 |
|
G4 |
27 |
47 |
|
G5 |
43 |
15.4 |
|
G6 |
22.4 |
47 |
|
Cost($/hr) |
614.8901 |
641.9970 |
|
Emission(ton/hr) |
0.2375 |
0.2073 |
In this paper, a non-dominated sorting genetic algorithm- II is applied to a modified 6-bus RBTS system consisting of 6 distributed generators to optimize generation cost, emission of toxic gases, and system reliability. The NSGA- II has been employed to optimize two objective functions at a time and that is why objective functions among fuel cost, emission, and EENS (as a measurement of reliability) are considered as a pair. The simulation data of cost and emission optimization process are then compared with another model based on strength pareto evolutionary algorithm (SPEA) in order to validate the accuracy of the taken approach. After the verification, the generation cost and emission of toxic gases are optimized again but in that time the EENS function is applied as a constraint in order to keep the reliability at a certain high level. According to the data, it can be concluded that the taken research approach and the modified NSGA- II algorithm performs well in both the multi-objective and multi-constraints environment and provides optimized values of generation cost, emission quantity of toxic gases and reliability for a microgrid.
|
AFS |
artificial fish swarm |
|
AIMD |
additive-increase-multiplicative-decrease |
|
BES |
battery energy storage |
|
DER |
distributed energy resource |
|
DG |
distributed generator |
|
DSM |
direct search method |
|
EDNS |
expected demand not supplied |
|
EENS |
expected energy not served |
|
FOR |
forced outage rates |
|
GHG |
greenhouse gas |
|
HESS |
hybrid energy storage system |
|
hr |
hour |
|
LOLP |
loss of load probability |
|
MCS |
monte carlo simulation |
|
MW |
mega watt |
|
NSGA-II |
non-dominated sorting genetic algorithm- II |
|
PV |
photovoltaic |
|
PSO |
particle swarm optimization |
|
RBTS |
roy bilinton test system |
|
RES |
renewable energy source |
|
SC |
supercapacitor |
|
SPEA |
strength pareto evolutionary algorithm |
|
SM |
system minutes |
|
Greek symbols |
|
|
a |
cost coefficient |
|
b |
cost coefficient |
|
ϒ |
cost coefficient |
|
λ |
outage rate per year |
|
Subscripts |
|
|
cf |
constriction factor |
|
d |
Load demand |
|
gi |
i th distributed generator |
|
w |
inertia weight |
[1] Ton, D.T., Smith M.A. (2012). The US department of energy's microgrid initiative. The Electricity Journal, 25(8): 84-94. https://doi.org/10.1016/j.tej.2012.09.013
[2] Nikmehr, N., Ravadanegh S.N. (2015). Optimal operation of distributed generations in micro-grids under uncertainties in load and renewable power generation using heuristic algorithm. IET Renewable Power Generation, 9(8): 982-990. http://doi.org/10.1049/iet-rpg.2014.0357
[3] Bayat, M., Sheshyekani, K., Hamzeh, M., Rezazadeh, A. (2016). Coordination of distributed energy resources and demand response for voltage and frequency support of MV microgrids. IEEE Transactions on Power Systems, 31(2): 1506-1516. https://doi.org/10.1109/TPWRS.2015.2434938
[4] Wang, R., Wang, P., Xiao, G.X. (2015). A robust optimization approach for energy generation scheduling in microgrids. Energy Conversion and Management, 106: 597-607. https://doi.org/10.1016/j.enconman.2015.09.066
[5] Hosseinnezhad, V., Rafiee, M., Ahmadian, M., Siano, P. (2016). Optimal day-ahead operational planning of microgrids. Energy Conversion and Management, 126: 142-157. https://doi.org/10.1016/j.enconman.2016.07.076
[6] Gupta, R., Gupta, N.K. (2015). A robust optimization based approach for microgrid operation in deregulated environment. Energy Conversion and Management, 93: 121-131. https://doi.org/10.1016/j.enconman.2015.01.008
[7] Askarzadeh, A. (2017). A memory-based genetic algorithm for optimization of power generation in a microgrid. IEEE Transactions on Sustainable Energy, 9(3): 1081-1089. https://doi.org/10.1109/TSTE.2017.2765483
[8] Sen, G.D., Sharma, J., Goyal, G.R., Singh, A.K. (2017). A multi-objective PSO (MOPSO) algorithm for optimal active power dispatch with pollution control. Mathematical Modelling of Engineering Problems, 4(3): 113-119. http://doi.org/10.18280/mmep.040301
[9] Rao, D.S.N.M., Kumar, N. (2018). Optimal load dispatch solution of power system using enhanced harmony search algorithm. European Journal of Electrical Engineering, 20(4): 469-483. https://doi.org/10.3166/EJEE.20.469-483
[10] Sundaram, A. (2020). Combined heat and power economic emission dispatch using hybrid NSGA II-MOPSO algorithm incorporating an effective constraint handling mechanism. IEEE Access, 8: 13748-13768. https://doi.org/10.1109/ACCESS.2020.2963887
[11] Zhao, F., Yuan, J., Wang, N. (2019). Dynamic economic dispatch model of microgrid containing energy storage components based on a variant of NSGA-II algorithm. Energies, 12(5): 871. https://doi.org/10.3390/en12050871
[12] Neyestani, M., Hesari, S., Hatami, M. (2019). Planned production of thermal units for reducing the emissions and costs using the improved NSGA II method. Case Studies in Thermal Engineering, 13: 100397. https://doi.org/10.1016/j.csite.2019.100397
[13] Akram, U., Khalid, M., Shafiq, S. (2017). An innovative hybrid wind-solar and battery-supercapacitor microgrid system—development and optimization. IEEE Access, 5: 25897-25912. https://doi.org/10.1109/ACCESS.2017.2767618
[14] Ramabhotla, S., Bayne, S., Giesselmann, M. (2014). Economic dispatch optimization of microgrid in islanded mode. International Energy and Sustainability Conference, Farmingdale, NY, pp. 1-5. https://doi.org/10.1109/IESC.2014.7061838
[15] Kanchev, H., Colas, F., Lazarov, V., Francois, B. (2014). Emission reduction and economical optimization of an urban microgrid operation including dispatched PV-based active generators. IEEE Transactions on Sustainable Energy, 5(4): 1397-1405. https://doi.org/10.1109/TSTE.2014.2331712
[16] Liu, G., Xu, Y., Tomsovic, K. (2016). Bidding strategy for microgrid in day-ahead market based on hybrid stochastic/robust optimization. IEEE Transactions on Smart Grid, 7(1): 227-237. https://doi.org/10.1109/TSG.2015.2476669
[17] Liu, G., Starke, M., Xiao, B., Tomsovic, K. (2017). Robust optimisation-based microgrid scheduling with islanding constraints. IET Generation, Transmission & Distribution, 11(7): 1820-1828. https://doi.org/10.1049/iet-gtd.2016.1699
[18] Billinton, R., Sankarakrishnan, A. (1994). Adequacy assessment of composite power systems with HVDC links using Monte Carlo simulation. IEEE Transactions on Power Systems, 9(3): 1626-1633. https://doi.org/10.1109/59.336095
[19] Billinton, R., Jonnavithula, A. (1997). Composite system adequacy assessment using sequential Monte Carlo simulation with variance reduction techniques. IEE Proceedings-Generation, Transmission and Distribution, 144(1): 1-6. https://doi.org/10.1049/ip-gtd:19970763
[20] Billinton, R., Adzanu, S. (1997). Composite generation and transmission system adequacy assessment with time varying loads using a contingency enumeration approach. IEEE WESCANEX 97 Communications, Power and Computing. Conference Proceedings, Winnipeg, Manitoba, Canada, pp. 41-46. https://doi.org/10.1109/WESCAN.1997.627110
[21] Goel, L., Wu, Q., Wang, P. (2006). Reliability enhancement of a deregulated power system considering demand response. IEEE Power Engineering Society General Meeting, Montreal, Que., pp. 6. https://doi.org/10.1109/PES.2006.1708965
[22] Billinton, R., Wenyuan, L. (1992). Consideration of multi-state generating unit models in composite system adequacy assessment using Monte Carlo simulation. Canadian Journal of Electrical and Computer Engineering, 17(1): 24-28. https://doi.org/10.1109/CJECE.1992.6593903
[23] Henneaux, P., Bouchez, F.X., Rese, L. (2016). Confidence intervals for adequacy assessment using Monte Carlo sequential simulation. IEEE International Energy Conference (ENERGYCON), Leuven, pp. 1-6. https://doi.org/10.1109/ENERGYCON.2016.7514142
[24] Crisostomi, E., Liu, M., Raugi, M., Shorten, R. (2014). Plug-and-play distributed algorithms for optimized power generation in a microgrid. IEEE Transactions on Smart Grid, 5(4): 2145-2154. https://doi.org/10.1109/TSG.2014.2320555
[25] Abido, M.A. (2003). Environmental/economic power dispatch using multiobjective evolutionary algorithms. IEEE Transactions on Power Systems, 18(4): 1529-1537. https://doi.org/10.1109/TPWRS.2003.818693
[26] Li, W., Billinton, R. (2013). Reliability Assessment of Electric Power Systems Using Monte Carlo Methods. Springer Science & Business Media, pp. 23-27.
[27] Bagchi, A., Goel, L., Wang, P. (2016). Composite system adequacy assessment incorporating virtual power plants. IEEE International Conference on Power System Technology (POWERCON), Wollongong, NSW, pp. 1-6. https://doi.org/10.1109/POWERCON.2016.7754004
[28] Safdarian, A., Fotuhi-Firuzabad, M., Aminifar, F. (2013). Composite power system adequacy assessment based on post optimal analysis. Turkish Journal of Electrical Engineering & Computer Sciences, 21(1): 90-106. https://doi.org/10.3906/elk-1104-36
[29] Maulik, A., Das, D. (2017). Optimal operation of microgrid using four different optimization techniques. Sustainable Energy Technologies and Assessments, 21: 100-120. https://doi.org/10.1016/j.seta.2017.04.005
[30] Kumar, K.P., Saravanan, B., Swarup, K. (2016). Optimization of renewable energy sources in a microgrid using artificial fish swarm algorithm. Energy Procedia, 90: 107-113. https://doi.org/10.1016/j.egypro.2016.11.175
[31] Deb, K., Pratap, A., Agarwal, S., Meyarivan, T. (2002). A fast and elitist multi objective genetic algorithm: NSGA-II. IEEE Transactions on Evolutionary Computation, 6(2): 182-197. https://doi.org/10.1109/4235.996017
[32] Srinivas, N., Deb, K. (1994) Muilti objective optimization using non dominated sorting in genetic algorithms. Evolutionary computation, 2(3): 221-248. https://doi.org/10.1162/evco.1994.2.3.221
[33] Garg, M.P., Jain, A., Bhushan, G. (2012). Modelling and multi-objective optimization of process parameters of wire electrical discharge machining using non-dominated sorting genetic algorithm-II. Proceedings of the Institution of Mechanical Engineers, Part B: Journal of Engineering Manufacture, 226(12): 1986-2001. https://doi.org/10.1177/0954405412462778